Citizens, Knowledge, and the Information Environment pdf
Bạn đang xem bản rút gọn của tài liệu. Xem và tải ngay bản đầy đủ của tài liệu tại đây (197.82 KB, 17 trang )
Citizens, Knowledge, and the Information
Environment
Jennifer Jerit
University of Connecticut
Jason Barabas
Harvard University
Toby Bolsen
Northwestern University
In a democracy,knowledge is power. Research explaining the determinants of knowledge focuses on unchanging demographic
and socioeconomic characteristics. This study combines data on the public’s knowledge of nearly 50 political issues with
media coverage of those topics. In a two-part analysis, we demonstrate how education, the strongest and most consistent
predictor of political knowledge, has a more nuanced connection to learning than is commonly recognized. Sometimes
education is positively related to knowledge. In other instances its effect is negligible. A substantial part of the variation in the
education-knowledge relationship is due to the amount of information available in the mass media. This study is among the
first to distinguish the short-term, aggregate-level influences on political knowledge from the largely static individual-level
predictors and to empirically demonstrate the importance of the information environment.
I
s there a permanent information underclass in the
United States? Decades of research would seem to
suggest so. A voluminous literature shows that so-
cioeconomic factors, such as being rich or educated, are
positively associated with political knowledge (e.g., Ben-
nett 1988; Delli Carpini and Keeter 1996; Neuman 1986).
So well developed is this literature that the characteris-
tics commonly associated with political knowledge are
referred to as the “usual suspects” (e.g., Delli Carpini and
Keeter 1996, 179). However, the focus on individual-level
factors gives the impression of a static relationship be-
tween socioeconomic status and political awareness. Not
only is this a normatively unsatisfying position, but it also
strikes us as inaccurate. Citizens experience politics in an
environment that changes over time as domestic and for-
eign developments unfold. In addition to individual-level
characteristics, variation in the information environment
likely has an influence on political knowledge.
Determining the nature of this influence has im-
portant implications for representative democracy. The
Jennifer Jerit is a Fellow at the Roper Center for Public Opinion Research at the University of Connecticut and assistant professor
of political science (on leave), Southern Illinois University, Carbondale, IL 62901-4501 (). Jason Barabas is Robert Wood
Johnson Scholar in Health Policy Research, Center for Government and International Studies, Harvard University, 1730 Cambridge Street,
Cambridge, MA 02138 and assistant professor of political science (on leave), Southern Illinois University, Carbondale, IL 62901-4501
(). Toby Bolsen is a Ph.D. candidate of political science, Northwestern University, 601 University Place, Evanston,
IL 60208 ().
We thank the following people for helpful comments and assistance: Scott Althaus, John Benson, Bob Blendon, Jake Bowers, Jamie
Druckman, Tobin Grant, Bill Jacoby, Jim Kuklinski, Scott McClurg, Bob Luskin, Steve Nicholson, Skip Lupia, Jeff Mondak, Markus Prior,
Paul Quirk, Jas Sekhon, and participants in workshops at the University of Connecticut, Harvard University, and Northwestern University.
The Roper Center for Public Opinion Research provided the survey data used in these analyses.
uneven distribution of political knowledge biases the
shape of collective opinion (Althaus 2003). Not only
does political knowledge help citizens form stable, con-
sistent opinions, but it also enables them to translate their
opinions into meaningful forms of political participation
(Delli Carpini and Keeter 1996). If variations in media
coverage do little to offset the information advantage as-
sociated with high socioeconomic status, then large seg-
ments of the population will remain on the periphery of
the American political system. If, on the other hand, the
information environment can reduce the differences in
political knowledge that exist between certain elements
of society, there is hope that traditionally disadvantaged
groups, such as the uneducated or the poor, can make
their voices heard.
Our study investigates this issue by analyzing over
three dozen public opinion surveys for a period of more
than 10 years. In a two-part analysis, we examine whether
differences in the quantity of media coverage alter the
relationship between individual-level predictors, such as
American Journal of Political Science, Vol. 50, No. 2, April 2006, Pp. 266–282
C
2006, Midwest Political Science Association ISSN 0092-5853
266
CITIZENS, KNOWLEDGE, AND THE INFORMATION ENVIRONMENT 267
education and political knowledge. We find that higher
levels of information in the environment elevate knowl-
edge for everyone, but the educated learn dispropor-
tionately more from newspaper coverage. Increases in
television coverage, by contrast, benefit the least educated
almost as much as the most educated. Thus, the environ-
ment has a nuanced effect: certain news formats reinforce
existing differences in political knowledge; others dimin-
ish those differences.
The Study of Political Knowledge
and Knowledge Gaps
Scholars have long recognized the role that opportunity,
or the availability of information, plays in the acquisi-
tion of political knowledge (e.g., Delli Carpini and Keeter
1996; Luskin 1990). And yet, with the exception of a hand-
ful of studies (e.g., Althaus 2003; Delli Carpini, Keeter,
and Kennamer 1994; Hutchings 2001; Nicholson 2003),
the overwhelming tendency has been to focus on the
individual-level correlates of knowledge.
1
Though this lit-
erature has generated important insights, the characteris-
tics which tend to be associated with high levels of knowl-
edge are either fixed (e.g., race, gender) or they change
slowly (e.g., education, income). As a result, the conclu-
sions generatedby thisbodyof work areratherpessimistic.
Those who are the most likely to possess knowledge to
begin with (i.e., individuals with high socioeconomic sta-
tus) are the best equipped to add to their store of political
knowledge. The “informationally rich get richer,” to use
Price and Zaller’s (1993, 138) words, while the bottom
dwellers of the knowledge distribution remain informa-
tion poor (Converse 1990).
Moreover, the few studies examining environmental-
level correlates of knowledge paint an incomplete pic-
ture. There is evidence that increasing the opportunity
to learn about politics—through front-page coverage in
the media (Nicholson 2003) or geographical proximity
to a news source (Delli Carpini, Keeter, and Kennamer
1994)—raises aggregate levels of political awareness (also
see Delli Carpini and Keeter 1996, 121). At the same time,
work by Hutchings (2001, 2003) indicates that the envi-
ronment might work more selectively. He finds that cues
in the political environment motivate greater levels of
1
For example, Delli Carpini and Keeter state: “the information en-
vironment varies with greatconsequencefor how wellthepublic
is able to comprehend the political world.” They also acknowledge
that their model “is a closed system based entirely on factors spe-
cific to the individual and does not take account of external factors
critical to political learning” (1996, 209).
attentiveness for the particular subgroups (e.g., women,
African Americans) most affected by an issue. On the
whole, then, political scientists are just beginning to un-
derstand how variations in media coverage affect citizen
knowledge (Hutchings 2001, 847). The extent to which
the information environment reinforces the relationship
between socioeconomic status and political knowledge
remains largely unsettled.
Some important insights have come from other disci-
plines, however.Inanow classic studyinthefieldof speech
communications, Tichenor, Donohue, and Olien (1970)
observed that infusions of information into society have
an uneven effect on citizen knowledge. Those who have
attained a higher level of formal education show greater
gains than those with fewer years of formal schooling,
leading to “knowledge gaps.” According to this body of
work, the information environment has a powerful indi-
rect influence, with increases in media publicity strength-
ening the association between education and knowledge.
Although dozens of studies have investigated and
found support for the knowledge gap hypothesis, this lit-
erature suffers from an important limitation. Few studies
include actual measures of media content, relying instead
on self-reported measures of media exposure to estimate
the effect of the information environment (see Gaziano
1997 for a review). One common approach is to exam-
ine the correlation between education and knowledge for
individuals high in media use versus those low in me-
dia use—with the expectation that the correlation will be
strongest for the former (e.g., Eveland and Scheufele 2000;
Kwak 1999; McLeod, Bybee, and Durall 1979). As others
have noted, this approach does not demonstrate that the
knowledge gap between the least and the most educated is
actually caused by media coverage (Gaziano 1983; Klein-
nijenhuis 1991). Nor does it shed light on which features
of the news lead to the formation of gaps in the first place.
2
We address this void in the literature by content ana-
lyzing news coverage across a wide array of domestic and
foreign policy issues and then directly linking variations
in media content to political knowledge on these same
2
Tichenor, Donohue, and Olien (1970) describe other ways of test-
ing the knowledge gap hypothesis—for example, examining the
correlation between education and knowledge for issues that re-
ceive varying amounts of media coverage or for a single issue over
time (on the assumption that time is a proxy for changing levels
of media coverage). Another approach is to interact respondent
education with some measure of time and then examine the rela-
tionship between this interaction and knowledge (Holbrook 2002;
Rhine, Bennett, and Flickinger 2001). Despite the variety of ways
the knowledge gap hypothesis has been tested, Gaziano’s character-
ization remains valid: “Very little research with data on associations
between knowledge and education has involved mass media cover-
age of issues and news topics as a variable” (1983, 474, emphasis in
original).
268 JENNIFER JERIT, JASON BARABAS, AND TOBY BOLSEN
topics (also see Price and Czilli 1996). In particular, we are
interested in whether the relationship between socioeco-
nomic status and political knowledge varies (strengthen-
ing, weakening, or disappearing altogether) across issues
receiving different amounts of media coverage. In the end,
we provide one of the most rigorous tests of the knowledge
gap thesis to date. We also extend the work of others who
have simulated the effect of the environment by providing
information to respondents in survey-based experiments
(e.g., Gilens 2001; Kuklinski et al. 2000; Kuklinski et al.
2001).
Hypotheses
There are several reasons, mainly cognitive in nature,
why the relationship between education and knowledge
should become stronger in an informationally rich envi-
ronment. Simply consider Graber’s depiction of contem-
porary media coverage:
News stories often overwhelm people with more
facts and figures and even pictures than they
can readilyabsorb Stories are routinelywritten
or narrated at an eighth-grade, or even twelfth-
grade, comprehension level that ignores the fact
that most American adults do not function com-
fortably above a sixth-grade level. (2004, 558)
Compared to the less educated, individuals with
more years of formal schooling are better able to di-
gest the information in news stories. Not only is their
reading ability likely to be greater, but they also are
better at sorting and storing key points of information
(Robinson and Levy 1986; also see Price and Zaller 1993,
138).
3
Following Tichenor, Donohue, and Olien (1970), we
expect that as the volume of information about a topic
increases, every one will gain knowledge but at differ-
ent rates. More formally, we hypothesize that increases
in the overall amount of media attention to an issue will
increase the average amount of knowledge in the popula-
tion (Hypothesis 1a), but that the gap in knowledge be-
tween individuals with low and high levels of education
also will increase (Hypothesis 1b). Rather than allowing
3
A similar dynamic has been observed in studies of priming, in
which well-informed individuals are more likely to manifest prim-
ing effects than their least-informed counterparts (Krosnick and
Brannon 1993). The difference arises from the ability of the well-
informed to understand news content, store the information or its
implications in memory, and retrieve it at a later date.
the less educated to “catch up,” increasing the amount
of media coverage reinforces the positive relationship be-
tween education and political knowledge.
4
If knowledge gaps appear because of cognitive dif-
ferences across individuals with low and high levels of
education, more cognitively taxing news formats should
reinforce those gaps, while less cognitively taxing for-
mats ought to diminish them. Indeed, Neuman, Just,
and Crigler (1992) show that differences in the format
of print and broadcast coverage influence the extent to
which people learn from the news. They find that the first
few paragraphs of newspaper stories are dominated by
facts as opposed to explanatory devices such as framing or
analysis. Other scholars have noted that the complex and
compactly written stories of print news outlets require a
certain level of literacy (Graber 1994; also see Kleinnijen-
huis 1991). Television, by contrast, is better able to exploit
the dramatic and emotional components of a news story
through visuals (Graber 2004). Often, the visual compo-
nent of a news story is consistent with or complementary
to the verbal content (Neuman, Just, and Crigler 1992),
making information more accessible to those with weaker
cognitive skills.
Based upon these studies, we can refine our expecta-
tions regarding the influence of the information environ-
ment to include the following hypotheses. All else held
constant, increasing the amount of newspaper coverage
will raise the average level of knowledge in the population,
but it should primarily benefit those with high levels of
education (Hypothesis 2a). Restated, we expect increases
in print coverage to boost the intercept (i.e., the average
level of knowledge in a given survey) and to strengthen
the relationship between education and knowledge. The
effect of television is more subtle. Those with low levels of
education likely learn more, in relative terms, than their
more educated peers, but it is doubtful that they learn
enough to completely eliminate the information advan-
tage of the most educated (e.g., Freedman, Franz, and
Goldstein 2004, 733–34). Therefore, Hypothesis 2b states
that an increase in television coverage will raise the aver-
age level of knowledge in the population, but it will not
alter the relationship between education and knowledge
(i.e., no statistically meaningful effect in either direction).
4
Hypothesis 1a implies a positive intercept shift in environments
with abundant political information. Hypothesis 1b entails a
strengthening of the relationship between education and knowl-
edge (represented by an increase in the size of the coefficient on
education). We follow in the tradition of the knowledge gap lit-
erature and focus on education, the most important predictor of
political knowledge (Delli Carpini and Keeter 1996) and one of the
most commonly used measures of socioeconomic status.
CITIZENS, KNOWLEDGE, AND THE INFORMATION ENVIRONMENT 269
We test both of these hypotheses in the second part of our
study.
5
Data and Methods
Our use of the term “environment” is distinct from schol-
ars who study the influence of contextual factors, such
as neighborhoods or workplaces (e.g., Huckfeldt 2001;
Krassa 1990; MutzandMondak2006).Wealsodistinguish
ourselves from those who study the broader political envi-
ronment, such as district competitiveness or institutional
arrangements (e.g., Gordon and Segura 1997; Hutchings
2001, 2003; Smith 2002). Instead, we focus on the infor-
mation people are exposed to in the media. This includes
statements made by public officials, interest groups, jour-
nalists, and other actors regarding political developments
and policy issues (Kuklinski et al. 2001). In making this
distinction we do not deny the role that neighborhoods,
workplaces, and other contexts play in filtering informa-
tion citizens receive from the mass media.
6
To test our hypotheses regarding the information
environment, we combined more than three dozen pub-
lic opinion surveys and collected data on the availability
of information prior to each one of these surveys. Our
first study examines a series of knowledge questions on
two issues that gained prominence in the late 1990s (the
tobacco settlement with the states and congressional pro-
posals on Medicare). Our second study examines 41 issues
over a period of 10 years. The magnitude of this data col-
lection effort required that a number of decisions be made
regarding the measurement of knowledge and the infor-
mation environment. We summarize the most important
of these decisions here and provide additional details in
the appendix.
Measuring Knowledge
Traditionally, political knowledge has been categorized as
either generalordomainspecific(DelliCarpiniandKeeter
1996; Gilens 2001; Zaller 1992). General, or chronic,
5
These ideas also have their roots in the knowledge gap literature
(e.g., Eveland and Scheufele 2000; Kwak 1999). As discussed ear-
lier, however, these studies do not incorporate measures of media
content, making it difficult to explore the mechanism behind the
differential effects of print and television news (e.g., Miyo 1983).
6
We also distinguish ourselves from the literature on campaign ef-
fects. While there is evidence that learning takes place in election
campaigns (e.g., Alvarez 1997; Brians and Wattenberg 1996; Freed-
man, Franz, and Goldstein 2004), few studies directly examine the
information environment as we do below (but see Druckman 2005;
Just et al. 1996).
knowledge consists of civics-style facts one might learn
from a textbook, such as the branch of the federal gov-
ernment which can declare laws unconstitutional or the
vote margin needed in Congress to overturn a presidential
veto. By contrast, policy- or domain-specific knowledge
represents facts about particular programs, policies, or
problems, such as the percent of the budget devoted to
foreign aid or recent trends in the crime rate (e.g., Gilens
2001; Iyengar 1990).
General measures are widely available and therefore
tend to be used more frequently (Gilens 2001, 380), but
they suffer from an important limitation. Once general
knowledge is obtained, the typical citizen might go years,
decades, or even a lifetime without the need to update
their knowledge of who occupies the vice presidency,
which party controls the House of Representatives, or the
protections guaranteed by the First Amendment (Graber
2004, 561). For this reason, domain-specific measures are
preferable for examining the impact of the information
environment. In this study, we focus on a particular kind
of domain-specific knowledge—news events (Price and
Zaller 1993) or what Delli Carpini and Keeter call “surveil-
lance facts” (1991, 598). Survey questions about these top-
ics have one essential quality: knowing the correct answer
depends upon recent exposure to information in the me-
dia rather than learning that occurred years ago.
Focusing on surveillance knowledge is appropriate
for another reason. In recent years, scholars have ques-
tioned the notion that citizens need a large store of general
knowledge in order to function in a democratic society
(Lupia and McCubbins 1998; see Leighley 2004, 151–61,
for a discussion). The outlines of a new standard can be
seen in the work of Schudson (1998), who frames citi-
zenship in terms of a monitorial obligation. According to
this view, citizens should be knowledgeable about acute
problems and pressing issues that appear in the head-
lines, but little else. In contrast to the person who follows
public affairs in all their details, the monitorial citizen
intermittently surveys political news. With more schol-
ars embracing this view of citizenship (e.g., Graber 2004;
Zaller 2003), understanding how people acquire surveil-
lance knowledge is of great normative interest.
7
Our study employs 41 cross-sectional public opinion
surveys administered by Princeton Survey Research As-
sociates (PSRA) from 1992 to 2003. These surveys asked
respondents about recent political developments (e.g.,
“Does the Clinton health care reform plan guarantee that
workers do not lose their health insurance coverage, if they
7
To the extent that people make “online” judgments (e.g., Lodge,
Steenbergen, and Brau 1995), their ability to recall surveillance
facts may not indicate how responsive they are to the information
environment.
270 JENNIFER JERIT, JASON BARABAS, AND TOBY BOLSEN
lose or quit their jobs, or doesn’t the plan go that far?”),
and hence they are more topical than general knowledge
questions. However, it was precisely because the ques-
tions asked respondents about specific, recent political
developments that we expected to observe a relationship
between features of the information environment and
performance on the knowledge questions. The dependent
variable in our analysis is a dichotomous measure coded
“1” if the respondent answered the knowledge question
correctly and “0” otherwise.
8
Individual-Level Predictors
Following in the tradition of researchers who have
examined the individual-level predictors of political
knowledge (e.g., Bennett 1988; Delli Carpini and Keeter
1996; Neuman 1986), we included measures of education,
income, age, race, and gender in our models.
9
In addition,
several studies have documented that following politics
in the news is associated with higher levels of political
knowledge (Delli Carpini and Keeter 1996; Luskin 1990).
Like previous scholars, we view the “follows” measure as
conveying important information about exposure to the
information environment (Dalton, Beck, and Huckfeldt
1998; Hetherington 1996). The follows measure used be-
low improves upon past research because it is specific to
the particular surveillance issue mentioned in the knowl-
edge question (e.g., “How closely have you been following
the debate over health care reform?”).
10
The Information Environment
We conducted a content analysis of the full text transcripts
of three national media outlets during the six weeks prior
8
We combine incorrect and “don’t know” responses (Luskin and
Bullock 2005). Randomly reassigning “don’t know” responses
(Mondak 2001) or including a dummy variable when respondents
were reminded of the option to say “don’t know” did not alter our
conclusions.
9
The range and coding for the variables are as follows: education
(1–7; 7 = post-graduate), income (1–6; 6 = $100,000+), age (18–
97; 97 = 97 years old), black (0–1; 1 = African American), female
(0–1; 1 = female). Missing demographic responses were imputed
to avoid listwise deletion of approximately 20% of our cases. Using
the Amelia computer software, we created ten data sets of imputed
values, conducted our empirical analyses on each new dataset, av-
eraged the coefficients, and adjusted the standard errors for esti-
mation uncertainty (King et al. 2001, 53).
10
Coding categories are: 1 = not at all closely; 2 = not too closely;
3 = fairly closely; 4 = very closely. The causal relationship may
run in the opposite direction—i.e., knowledge about a particular
issue may stimulate one to follow that topic in the news. In separate
analyses we explored the possibility of endogeneity. Our key sub-
stantive findings hold whether we employ alternate specifications
that account for endogeneity or exclude follows from the analysis
altogether.
to the first day of each PSRA survey. The choice of a six-
week coding period was deliberate. The sponsors of the
PSRA surveys designed knowledge questions in response
to political developments occurring during this period of
time (Brodie et al. 2003).
We use the Associated Press (AP) to represent the total
amount of media attention devoted to an issue. This deci-
sion can be justified on a number of grounds. As the major
newswire service in the United States, the AP serves 5,000
radio and television stations () and
nearly all of the nation’s daily newspapers (Graber 2002,
44). While few people actually read the AP newswire, it in-
fluences news coverage widely and serves as a good proxy
for the amount of information in the environment at any
given time.
In Study 2, we concentrate on differences between
print and television coverage. For our broadcast source,
we randomly selected one television station from the
three major networks and content analyzed its evening
news program (CBS Evening News). We selected USA
Today as our print source because of its wide distribu-
tion. The daily audience for this paper is 5.2 million
people (), earning it the nick-
name “the nation’s most read daily newspaper.”
11
Like
our use of the AP, we view CBS and USA Today as provid-
ing a representative picture of the information that was
appearing on television and in newspapers around the
county.
Once we identified the relevant sample of news sto-
ries in each media outlet, we tallied the total number of
stories mentioning the correct answer during the con-
tent analysis period.
12
A simple story count captured
the essence of what we sought to measure—namely,
the degree to which information about a particular is-
sue was plentiful. We coded stories for other charac-
teristics, such as expert commentary and background-
oriented contextual coverage, which we return to in our
discussion of the empirical findings at the conclusion of
Study 2.
13
11
Among major national newspapers (USA Today, Wall Street Jour-
nal, and the New York Times) the market share of USA Today is 44%
().
12
A story was considered relevant if it discussed the issue underlying
the knowledgequestion.Intercoder reliability analysesindicatehigh
levels of agreement for identifying relevant articles (kappa = .71)
and identifying articles containing the correct answer (kappa =
.84). According to Cicchetti and Sparrow (1981), a value of kappa
above .60 is good; .75 or higher is excellent. Media reports for all
three sources were obtained from Lexis-Nexis and evaluated by
multiple coders. Coding and intercoder reliability were conducted
at the article level.
13
The kappa scores for our context and source codes were .67 and
.58, respectively.
CITIZENS, KNOWLEDGE, AND THE INFORMATION ENVIRONMENT 271
Study 1: Variation in Media Coverage
within an Issue
Two of the 41 surveys in our sample asked respondents
multiple questions about the same surveillance issue. Im-
portantly, media coverage of the issue varied in a way that
allows us to test Hypotheses 1a and 1b. The first surveil-
lance issue we examine is the 1998 tobacco settlement
with the states. There were multiple components of the
deal (e.g., payments to the states, a ban on tobacco ad-
vertisements such as Joe Camel) each of which received
different amounts of coverage in the media. Our second
surveillance issue, congressional proposals on Medicare
during 1997, is similar in the sense that Congress was con-
sidering several ideas (e.g., making the wealthy pay higher
premiums, increasing patient choice), each of which re-
ceived more or less coverage in the news. Thus, in both
surveys, the same individual is asked multiple questions
about the same issue. For any given respondent, variation
in knowledge across the questions can be attributed to
differences in the amount of media coverage devoted to
particular aspects of the tobacco settlement or Medicare.
And differences in media coverage there were. When
it came to the tobacco settlement, the media focused
almost exclusively on one feature of the deal: the bil-
lions of dollars that the tobacco industry was to pay to
the states. In the six weeks leading up to the PSRA sur-
vey, this aspect of the deal was covered in 28 Associated
Press stories (approximately one story every other day).
Other parts of the settlement, such as the ban on adver-
tisements, received a moderate amount of attention (11
stories), while still others, such as the right of individuals
to sue the tobacco industry, received little media attention
(4 stories). Coverage of Medicare was similarly uneven.
The media paid the most attention to proposals that made
the wealthy pay higher premiums (25 stories). Giving se-
niors more choice under Medicare received some coverage
(11 stories), while means testing for benefits received no
attention (0 stories). We expect these differences in media
coverage to be related to variations in political knowledge
within each survey.
14
Hypothesis 1a leads us to expect that the average
level of knowledge among survey respondents will be
highest for those topics receiving the most media at-
tention. Aggregate patterns of political knowledge fol-
low precisely this pattern. Over 70% of respondents cor-
rectly answered questions regarding the billion dollar
payment to the states and the ban on advertisements.
14
The other factor that is varying is how the individual questions
regarding tobacco and Medicare were worded. We deal more sys-
tematically with question difficulty in Study 2.
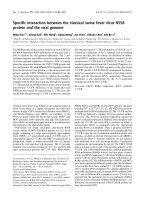
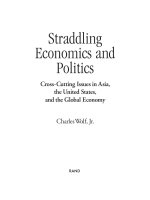
FIGURE
1 The Varying Relationship Between
Education and Knowledge
Panel A. The 1998 Tobacco Settlement
Panel B. Congressional Proposals on Medicare in 1997
-0.40
-0.30
-0.20
-0.10
0.00
0.10
0.20
0.30
0.40
Coefficient
Right to Sue Advertising Ban Payments to States
(4 stories) (11 stories) (28 stories)
-0.40
-0.30
-0.20
-0.10
0.00
0.10
0.20
0.30
0.40
Coefficient
Means Patient Wealthy
Test Benefits Choice of Provider Pay More
(0 stories) (11 stories) (25 stories)
Note: Solid black dots denote the education coefficient values.
Gray lines represent 95% confidence intervals.
Only 25% of respondents correctly answered the ques-
tion regarding the right to sue, the topic that received
the least attention in the news (t-tests for differences in
knowledge significant at p < .01). On Medicare, 62% of
the sample correctly answered questions about the most
heavily covered topic (wealthy pay more); 47% correctly
answered the question about patient choice, and only 37%
provided the right answer to the question about means
testing for benefits (t-tests significant at p < .01). Again,
these patterns follow the level of coverage devoted to each
issue.
Due to the cognitive differences between individu-
als with low and high levels of education, the least edu-
cated are the least equipped to process increases in the
amount of political information. Accordingly, Hypoth-
esis 1b predicts that the relationship between education
and knowledge will become stronger as media coverage
increases. This pattern is shown in Panel A of Figure 1,
which displays the coefficient on education from a probit
model predicting knowledge.
15
15
We ran a multivariate probit (Greene 2003, 714–19) that included
the usual array of individual-level predictors: education, income,
age, gender, race, and whether the respondent was following news
272 JENNIFER JERIT, JASON BARABAS, AND TOBY BOLSEN
The coefficients are arranged in order of increas-
ing media coverage. For example, the left-most co-
efficient (
ˆ
 =−.001; standard error =.027) represents
the relationship between education and knowledge on
the part of the settlement that received the least cov-
erage (the right to sue). This relationship is statisti-
cally insignificant, as indicated by the 95% confidence
interval that overlaps zero. Consistent with our expecta-
tions, this relationship is weaker than the relationship be-
tween education and knowledge on the two tobacco top-
ics that received more coverage (ad ban, payments to the
states).
16
Toputthecoefficients in perspective,consider the gap
in knowledge between two typical respondents, one with a
high school degree and the other with schooling after col-
lege.
17
When it comes to the right to sue, a highly educated
respondent is no more likely to provide the correct answer
to the question than a poorly educated respondent (23%
for both). The confidence intervals around these predic-
tions are large and overlap considerably. As media cover-
age increases, both individuals are more likely to correctly
answer questions about the settlement, but it is the highly
educated person who benefits the most from an increase
in media coverage. For the most heavily covered topic
(payments to the states), a person with low education has
a 65% chance of correctly answering the question (95%
C.I. from 61 to 69%). A respondent with high education
has a 77% chance of getting the question correct (95% C.I.
from 72 to 82%), translating into a 12-percentage-point
knowledge gap.
Figure 1b presents education coefficients for ques-
tions about congressional proposals on Medicare. The
coefficients are arrayed in terms of the level of media
coverage for each proposal (low, medium, or high). For
the most part, Figure 1b reproduces the pattern seen in
Figure 1a: an insignificant relationship between educa-
tion and knowledge when the amount of media coverage
is low (or moderate) and a positive and significant rela-
tionship when media coverage is high.
18
Like the previous
models, the gap between the least and most educated is
about the tobacco settlement (or Medicare). See the appendix for
the table of coefficients.
16
Using a nonlinear Wald test, the difference between the coefficient
in theright tosue modelis significantly differentthan thecoefficient
in the payment to states model (p < .01). The ad ban vs. payment
to the states comparison also is significant (p < .10).
17
The typical respondent is a white female who takes on the average
value of all other variables.
18
The coefficient in the patient choice model is significantly dif-
ferent from the coefficient in the wealthy pay more model (p ≤
.05).
largest for the aspect of the issue receiving the most news
coverage.
19
Lookingatthesamerespondents acrossthesameissue
(either tobacco or Medicare), we have shown that varia-
tionsinthelevelofknowledge correspond todifferencesin
the amount of news coverage. We also have shown that the
well-known relationship between education and knowl-
edge is not fixed—not even within the same issue. How
generalizable are these findings? We turn to that question
next.
Study 2: Variation in Media Coverage
across Issues
In this study, we pooled 41 public opinion surveys and
collected data on the availability of information prior to
each one of the surveys. Although the subject of these
questions varies over time, they are equivalentmeasuresof
knowledge in at least one respect: they have passed Zaller’s
(2003) “burglar alarm” news standard, which is to say that
they represent important issues journalists were covering
in the weeks leading up to the survey (also see Schudson
1998).
20
Put somewhat differently, whereas Study 1 had a
high degree of internal validity, Study 2 has a high degree
of external validity.
To return to our central claim, we argue that in addi-
tion totheindividual-levelpredictorsof knowledge,varia-
tion in the information environment affects what citizens
know about politics. Thus, the first step was to document
that knowledge of recent political developments changes
across the 41 surveys in our study.If it did not, there would
be little reason to look beyond the stable individual-level
factors that are associated with knowledge.
Figure 2 presents the percentage of respondents giv-
ing the correct response to a question tapping their
19
There were two other Medicare questions in the survey. The first
asked about a proposal to cut provider payments. This topic re-
ceived about the same amount of coverage as the proposal to in-
crease patient choice (12 stories), and roughly the same percentage
of respondents (45 and 47%, respectively) could answer these items
correctly. The other question asked about proposals to increase the
eligibility age. This topic received about the same amount of cover-
age as making the wealthy pay more (22 stories), and, once again,
roughly the same number of people (56 and 62%, respectively)
provided the correct answer to these questions. We report the edu-
cation coefficients for these models in Table A2. The pattern in this
table suggests the possibility of nonlinear effects; we address this
more systematically in Study 2.
20
Because all of these issues represent important, not just recent,
political developments, every one of the issues we examine in Study
2 was covered by at least one of our three media sources.
CITIZENS, KNOWLEDGE, AND THE INFORMATION ENVIRONMENT 273
FIGURE
2 The Distribution of Knowledge: Surveillance Issues
1992–2003
0
25
50
75
100
Issue
Percent Correct
Bush
drug plan
Soc. Sec.
solvency
Abortion
decision
Invest Soc. Sec.
trust fund
West Nile Virus
Medicare
knowledge of surveillance issues from 1992 to 2003. As
Figure 2 demonstrates, levels of political knowledge were
anything but constant across the topics queried in the
PSRA surveys, ranging from a low of 4% (President Bush’s
drug plan) to a high of 90% (West Nile Virus). There also
is no obvious pattern to citizen knowledge on this sample
of issues. Citizens are no more—or less—knowledgeable
about partisan issues (compare, for example, the varying
levels of knowledge about Social Security, Medicare, and
abortion). We remain hopeful, then, that at least some
portion of political knowledge can be linked to changing
levels of media coverage across these subjects.
Like the two issues we examined in Study 1, there was
a great deal of variation in media attention to the 41 issues.
The mean level of coverage in the AP was ten news stories.
The variation around that mean was substantial, however,
with some issues receiving no coverage and others as many
as 39 stories. As for the volume of print coverage, the mean
number of stories in USA Today was five (min = 0; max =
17). The average number of stories on CBS Evening News
was two (min = 0; max = 7).
Hypothesis 1a predicts thattheaveragelevel of knowl-
edge among survey respondents will be positively related
to the volume of information in the media. An explicit
test of this proposition will come later, when we combine
our surveys and examine whether the variation in the in-
tercept is significantly greater than zero. In the meantime,
we see support for Hypothesis 1a in the aggregate-level
relationships. The bivariate correlation between our me-
dia measures and the knowledge series ranges from .50
to .63 (p < .01). The outline of this relationship can be
seen in Figure 2. There were three stories in the AP about
the Bush drug plan and Social Security solvency, 12 on
the Supreme Court’s abortion decision, 16 about invest-
ing the Social Security trust fund, 24 on the subject of
Medicare premiums, and 33 about West Nile Virus.
FIGURE 3 Knowledge across Education Groups
on Issues with Low and High Media
Coverage
Panel A. Issues with Low Coverage
0
20
40
60
80
100
Bush's drug
plan
SS solvency Price fixing Prescription
drugs
Morning-
after pill
Tobacco
settlement
Medical
errors
Panel B. Issues with High Coverage
0
20
40
60
80
100
Rwanda Abortion Invest SS Stem cell
research
Means test
Medicare
Gays in the
military
West Nile
Virus
% Correct
Low Education High Education
% Correct
We also see some initial support for Hypothesis 1b
which states that the knowledge gap between the least
and the most educated will be largest on issues with the
most media coverage. Figure 3 shows the percent cor-
rect across education groups for the seven least and most
covered issues (which corresponds roughly to the lower
and upper quintiles of our sample). For issues that re-
ceive relatively little coverage, there is no consistent pat-
tern between a person’s level of education and what they
know about recent political developments. On some is-
sues the highly educated know more (e.g., Social Security
274 JENNIFER JERIT, JASON BARABAS, AND TOBY BOLSEN
solvency), while on others the least educated appear to
know more (medical errors) or there is no difference be-
tween the two groups (the tobacco settlement). The aver-
age knowledge gap across these seven issues is 2 percent-
age points. Panel B, by contrast, shows that on issues with
high levels of media coverage, there is a consistent gap
between education groups. The average size of this gap
is 20 percentage points, and it ranges from 7 percentage
points (West Nile Virus) to 33 percentage points (stem
cell research).
Having shown that the relationship between educa-
tion and knowledge varies (also see Figure 1, Study 1), we
turn next to the role that media coverage plays in account-
ing for the variance in this relationship. Because we are
combining 41 cross-sectional surveys, subtle differences
in survey topics or questions might affect patterns of po-
litical knowledge. One obvious factor is the inherent dif-
ficulty of the question. When respondents are confronted
with a question that is worded in a confusing manner or
when they are queried about a complex subject, the mean
of all respondents answering this item will be lower than
we would otherwise expect. In our next and final set of
analyses, we employ an item-response model (Hambleton
and Swaminathan 1985; Lord and Novick 1968) to cre-
ate a measure of question difficulty. We use this variable
to control for differences across surveys. In its original
form, Item Difficulty represents the objective probability
of correctly answering a knowledge question. We sub-
tracted the variable from 1 so that higher values indicate
a more difficult question.
21
A Multilevel Model
Our data combine survey respondents who are nested in
different information environments, which is to say that
we have data at two levels. The first is the level of the
individual survey respondent; the second corresponds to
the information environment preceding each survey. Be-
cause individuals in any given survey confront similar in-
formation environments, there is a significant amount of
clustering in our data. In this situation, multilevel models
are an appropriate solution (Raudenbush and Bryk 2002;
Goldstein 2003).
Given our argument, a multilevel model entails the
specification of three equations:
Knowledge
ij
= 
0 j
+ 
1 j
Education
ij
+···
+ 
k
x
kij
+ ε
ij
(1)
21
We also operationalized question difficulty in terms of the num-
ber of response options and the number of words in the question.
Neither variable was statistically significant in our models.

0 j
= ␥
00
+ ␥
01
Volume
j
+ ␥
02
Difficulty
j
+ ␦
0 j
(2)

1 j
= ␥
10
+ ␥
11
Volume
j
+ ␥
12
Difficulty
j
+ ␦
1 j
(3)
Equation (1) models the relationship between the
usual suspects (education, age, income, etc.) and polit-
ical knowledge. The multilevel model departs from the
typical regression in that the parameters in the first equa-
tion are allowed to vary across the j level-two units. Thus,
equation (2) models the intercept (
0 j
), the variation in
the average level of knowledge among a group of survey
respondents, as a function of the volume of information
in the environment (measured in terms of the AP, CBS,
or USA Today) and the inherent difficulty of the ques-
tion. The third equation models the variation in the ed-
ucation parameter (
1 j
) as a function of these same fac-
tors. The relationship posited by equation (3) commonly
is referred to as a “cross-level interaction” because it in-
volves the relationship between a level-one and a level-two
predictor.
22
According to Hypothesis 1a, increases in the over-
all volume of the information environment will raise
the average level of knowledge (i.e., ␥
01
will be posi-
tive and significant). Hypothesis 1b predicts that most
of this increase will take place among the most ed-
ucated, leading to a strengthening of the relationship
between education and knowledge in high volume en-
vironments (i.e., ␥
11
will be positive and significant). We
expect that increases in the amount of newspaper cov-
erage will strengthen the relationship between education
and knowledge (Hypothesis 2a), which again implies a
positive sign for the cross-level interaction between the
volume of newspaper coverage and education. Increases
in the amount of television coverage should have no ef-
fect on that relationship (Hypothesis 2b), leading to an
insignificant cross-level interaction between the volume
of television coverage and education.
A useful starting point in the analysis of multilevel
data is the random effects ANOVA model (Raudenbush
and Bryk 2002, 24). In this representation,
Y
ij
= ␥
00
+ ␦
0j
+ ε
ij
(4)
the probability of correctly answering a question is mod-
eled as a function of ␥
00
, the grand mean of Y . The model
22
Equations (2) and (3) also include disturbance terms (␦). One
of the virtues of multilevel models is that researchers do not as-
sume the level-two variables account perfectly for the variation in
the level-one parameters (Steenbergen and Jones 2002, 221). Most
existing studies that examine the environmental-level influence on
knowledge implicitly make such an assumption.
CITIZENS, KNOWLEDGE, AND THE INFORMATION ENVIRONMENT 275
also includes two random parameters. The first, ␦
0 j
rep-
resents a survey-level random effect while the second, ε
ij
,
represents an individual-level random effect. What makes
this modelparticularly useful is the factthatitdecomposes
the variance in Knowledge across levels of analysis. Thus,
we can determine how much between-survey variation
(
00
) there is relative to within-survey variation (
2
). For
example, the ratio of
00
to the total variance (
00
+
2
)
indicates how much of the variance in knowledge can be
attributed to environmental-level factors. Given the im-
portance of individual-level factors in predicting knowl-
edge, it should come as little surprise that approximately
75% of the variance in this variable can be attributed to the
individual-level. Importantly, however, 25% of the vari-
ance is attributable to environmental-level factors. Schol-
ars have long acknowledged that the information envi-
ronment has an important influence on knowledge; this
study is the first to estimate the relative magnitude of that
influence.
23
Table 1 reports the results of two multilevel models
where the first corresponds to the overall information
environment, using Associated Press coverage as a proxy,
and the second compares the effect of newspaper (USA
Today) and broadcast (CBS Evening News)coverage.
24
We begin by presenting the coefficients for the level-
one fixed effects. These terms represent the average effect
of each level-one variable across our sample of issues.
Focusing on the first column, the Education coefficient,
ˆ

1
= .071 (standard error = .008), represents the esti-
mated average slope for education across the 41 surveys.
The fact that the coefficient is positive and significant con-
firms decades of studies showing a relationship between
education and political knowledge. Other level-one pre-
dictors perform exactly as one would expect given past
research in this area. Higher levels of political knowledge
are associated with having a high income, being older,
male, white, and following a particular issue in the news.
23
Another way of illustrating the importance of between-survey
variation in our data is a Wald test, where the null hypothesis states
that
00
= 0 (Rasbash et al. 2000, 108). We reject the null (
2
=
20 .235; 1df; p < .01) and conclude that the variation in
00
is sig-
nificantly greater than zero (i.e., the intercept should be specified
as a random parameter). We also estimated a random coefficients
model in which we treat the education parameter as a random vari-
able (i.e., 
1 j
= ␥
10
+ ␦
1 j
). We conducted a Wald test, where the
null hypothesis states that the variance component for education is
equal to zero. We reject the null (
2
= 6 .183; 1df; p < .05) and con-
clude that the variation in the education coefficient is significantly
greater than zero.
24
Our dependent variable is dichotomous, so we use a probit link
function. Statistical estimates were generated using MLwiN 2.0
(Rasbash et al. 2000) and R 1.9.1 (Pinheiro and Bates 2000). Con-
tinuous variables are grand mean centered (see Raudenbush and
Bryk [2002] for a discussion).
T
ABLE 1 The Information Environment
and Political Knowledge: Multilevel
Statistical Estimates
Overall
Information Newspaper vs.
Environment Television
Parameter Estimates Estimates
Fixed Effects
Intercept −0.281
∗∗
−0.291
∗∗
(0.065) (0.056)
Education 0.071
∗∗
0.071
∗∗
(0.008) (0.008)
Income 0.037
∗∗
0.038
∗∗
(0.007) (0.007)
Age 0.003
∗∗
0.003
∗∗
(0.001) (0.001)
Female −0.091
∗∗
−0.090
∗∗
(0.032) (0.032)
Black −0.073+−0.073+
(0.038) (0.038)
Follows issue 0.270
∗∗
0.270
∗∗
(0.016) (0.016)
Item difficulty −0.901
∗∗
−0.833
∗∗
(0.284) (0.228)
Newswire coverage 0.028
∗∗
–
(0.009) –
Newspaper coverage – 0.047
∗∗
–(0.015)
Te l e v i s i o n c o v e r a g e – 0 .085
∗
–(0.043)
Education X newswire 0.002
∗
–
(0.001) –
Education X newspaper – 0.004
∗∗
–(0.002)
Education X television – 0.002
–(0.003)
Education X item −0.075
∗∗
−0.072
∗∗
difficulty (0.025) (0.024)
Variance Components
Intercept 0.186
∗∗
0.132
∗∗
(0.034) (0.021)
Education 0.003
∗∗
0.002
∗∗
(0.001) (0.001)
N
i
/N
j
45365/41 45365/41
Note : Table entries are maximum likelihood (IGLS/PQL) estimates
with estimated standard errors in parentheses. The data have been
weighted to reflect the U.S. population.
+=p ≤.10,
∗
= p ≤.05,
∗∗
p ≤.01
The results for the individual-level predictors are similar
acrossboth models, so we insteadconcentrate on variables
that have the most relevance for our theoretical argument.
Turning to the coefficients for the level-two fixed ef-
fects, we see support for Hypothesis 1a. The positive and
276 JENNIFER JERIT, JASON BARABAS, AND TOBY BOLSEN
significant coefficient on Newswire coverage indicates that
even when we control for the difficulty of the question, an
increase in the overall amount of media attention to an is-
sue raises the average level of knowledge. Consistent with
Hypothesis 1b, the coefficient on the cross-level interac-
tion between Education and Newswire coverage is positive
and significant. This implies that as the volume of in-
formation increases, the relationship between education
and knowledge becomes stronger.
25
Predicted probabili-
ties put this last finding in perspective.
26
In an environ-
ment devoid of information, the typical citizen with low
education has a 22% chance of getting the correct answer
on a knowledge question (95% C.I. from 19 to 25%). A
more educated respondent has a 29% chance of provid-
ing the correct answer (95% C.I. from 26 to 33%), for an
estimated knowledge gap of approximately 7 percentage
points. The knowledge gap between these hypothetical
citizens triples in an environment that is rich with infor-
mation (the difference between 57 and 78%).
The second column of results compares the condi-
tioning role of newspaper and television news coverage.
Focusing first on the level-two fixed effects, an increase in
either news source ispositivelyassociatedwithknowledge.
In other words, variation in aggregate political knowl-
edge across surveys can be attributed to differences in
the amount of newspaper and television coverage. Go-
ing from the minimum to the maximum on print and
broadcast coverage results in 30 and 23 percentage point
increases in aggregate political knowledge, respectively.
The coefficients on the cross-level interactions (Edu-
cation X newspaper and Education X television) also show
support for our hypotheses. Higher amounts of print cov-
erage strengthen the relationship between education and
knowledge, while television has no effect on that relation-
ship. The substantive effect of both terms is best displayed
graphically.
Consistent with Hypothesis 2a, the first panel of
Figure 4 shows that the highly educated benefit the most
from an increase in print coverage. When newspaper cov-
erage is at its lowest,the difference between low- and high-
education respondents is modest (8 percentage points).
The gap in knowledge between these groups grows nearly
25
We get similar results when we use alternate measures, such as the
sum of news stories across our print and broadcast sources and the
sum of news stories across all three sources. Our conclusions also
remain the same when we used a logged measure of media coverage.
26
We computed predicted probabilities using means for continuous
variables and modal values for dichotomous variables. Low edu-
cation corresponds to a person with a high school diploma; high
education corresponds to a person with schooling after college. We
use the sample minimum and maximum for the environmental-
level variables.
FIGURE
4 The Effects of the Information
Environment on the Relationship
between Education and Knowledge
Panel A. Interaction between
Education and Newspaper Coverage
0
10
20
30
40
50
60
70
80
Low Coverage High Coverage
Predicted Percent Correct
Gap: 8 pts.
Gap: 21 pts.
Panel B. Interaction between
Education and Television Coverage
0
10
20
30
40
50
60
70
80
Low Coverage High Coverage
Low Education High Education
Predicted Percent Correct
Gap: 11 pts.
Gap: 14 pts.
three-fold (21 percentage points) when print coverage is
abundant. Underlying this growth are differential rates of
learning. Low education respondents are 24 percentage
points more likely to get the correct answer when news-
paper coverage is at its maximum (the difference between
24 and 48); high-education respondents, by contrast, are
nearly 40 percentage points more likely to get the correct
answer (the difference between 32 and 69).
Panel B displays the comparison between low- and
high-education groups across different levels of television
coverage. While it is true that the gap between low- and
high-education respondents increases along with the vol-
ume of television coverage, the difference is small and
statistically insignificant.
27
The subtle effect of television
can be seen bycomparingtheincrease in predictedpercent
correct across the two groups. Contrary to the preceding
panel, low-education respondents benefit nearly as much
27
The coefficient on Education X television is indistinguishablefrom
zero (Table 1).
CITIZENS, KNOWLEDGE, AND THE INFORMATION ENVIRONMENT 277
from an increase in television coverage as high-education
respondents. They are 21 percentage points more likely
to get the correct answer when television coverage is at
its maximum (the difference between 25 and 46); high-
education respondents are 24 percentage points more
likely to get the correct answer (the difference between
36 and 60). Relative to the starting point for each group,
this translates into a 84% gain for the least educated but
only a 67% gain for the most educated.
28
As others have
noted, television may have little to offer the most educated
beyond what they already know (Eveland and Scheufele
2000). Finally, although it is not our central focus, respon-
dents do worse on more difficult items. The negative sign
on Education X difficulty suggests that the relationship
between education and knowledge diminishes on more
difficult questions.
The motivation for our multilevel model was the fact
that we expected to observe, and indeed found evidence
of, random variation in our parameters. A common way
of assessing the explanatory power of a multilevel model
is to calculate the proportion of the variance explained in
the parameters as one goes from a random coefficients
model without any level-two predictors to one that in-
cludes measures of volume and difficulty. Accounting for
the volume of print and television coverage reduces the
variance in the intercept coefficient by nearly 60%; it re-
duces the variance in the education coefficient by 41%.
29
Thus, not only were we able to account for sizable varia-
tion in the average level of knowledge across our 41 sur-
veys, but we also made significant headwayinunderstand-
ing how the effect of education varies with changes in the
informationenvironment.Thefact that the variance com-
ponents for the interceptand education parameter remain
significant (Table 1) indicates that other environmental-
level factors might further reduce the variance of these
parameters.
28
Freedman, Franz, and Goldstein (2004, 733–34) come to simi-
lar conclusions regarding the impact of television ads on candi-
date knowledge. They find no evidence of differential effects (i.e.,
low information citizens do not learn significantly more from ads
than high-information respondents), but the relative increase in
knowledge for the least informed is large compared to the highly
informed.
29
These figures were calculated by comparing the variance compo-
nents from random intercept and coefficients models with those
for the fully specified models of Table 1. For example, the percent
reduction in variance for the intercept is equal to:
00
(RandomIntercept) −
00
(Full)
00
(RandomIntercept)
.
Discussion
Our analysis has shown that the relationship between ed-
ucation and knowledge varies along with changes in the
information environment (see Kuklinski et al. 2001, 421–
22, for a related finding). Increases in newspaper coverage
primarily benefit the highly educated, thereby reinforcing
the relationship between education and knowledge (Fig-
ure 4a). By contrast, increases in the volume of television
coverage benefit the least educated, in absolute terms, al-
most as much as the most educated (Figure 4b). Addi-
tional content analyses highlight some of the differences
between print and broadcast news and shed further light
on our findings.
For each of the issues in our sample, we tallied the
number of experts that were quoted or paraphrased in
media reports. We also coded each story according to its
level of contextual coverage. As the name implies, con-
textual coverage refers to any kind of reporting that dis-
cusses the historical, political, or social background of
an issue (Bennett 2003; Graber 2004). This includes arti-
cles that consider why a particular policy action has been
taken, that discuss the consequences of a policy change,
or that provide an in-depth discussion of an issue or
problem. Expert commentary and contextual coverage
typically are considered indicators of quality in news re-
porting, however, citizens with low education seem the
least able to digest this type of information. Separate
analyses show that our print source (USA Today) was
significantly more likely to provide contextual coverage
than our broadcast source (CBS Evening News); there
was, however, no significant difference in the level of
expert commentary across print and television news.
30
Thus, differences in the amount of contextual coverage
in newspapers and television, combined with differential
rates of learning, contribute to the patterns found in
Table 1 (see Kleinnijenhuis 1991, 520, for a similar
conclusion).
Although our findings are robust to alternative spec-
ifications, several issues give us pause. First, there is the
potential problem of selection in the newspaper versus
television model (Table 1). Given the abstract writing style
of many newspapers, individuals with low levels of edu-
cation might be more likely to choose television as their
main source of political information. If so, estimates of
the knowledge gap between education groups could be
biased. Fortunately, in 11 of the 41 surveys, respondents
were asked where they got most of their information. The
30
T-tests for the differences in proportions are as follows: t
context
=
−2.345; p < .05 and t
expert
= .784; p < .44.
278 JENNIFER JERIT, JASON BARABAS, AND TOBY BOLSEN
choices were television, newspapers, radio, magazines,
the internet, friends, or other sources. We reestimated
the models in Table 1 on the smaller dataset and repro-
duced the same pattern of findings. We then included
the media use variables in the model to control for the
possibility that high- and low-education groups rely on
different media sources. With the exception of the indi-
cator for friends, which was negatively related to knowl-
edge (p < .05), these dummy variables were not signifi-
cant, nor did their inclusion alter any of our substantive
conclusions.
31
Another concern is that there may be patterns in the
types of issues which receive media attention (i.e., media
coverage is not exogenous). Two types of issues stand out
in this regard.First,wemight expecttoobservedifferences
in coverage for partisan and nonpartisan issues. Partisan
issues often are, or have a history of being, highly con-
tested. The ease with which these issues can be presented
in news stories, and the presence of two readily identi-
fiable “sides,” might make them a favored topic among
members of the media. If so, we would expect there to
be a greater number of news stories on partisan issues.
Second, a number of our cases have to do with presi-
dential initiatives or major statements of administration
policy (e.g., the State of Union Address). Given the role
of the president as a central protagonist in news stories,
we might expect that relative to the other issues in our
dataset, the number of stories will be higher when the
topic is a presidential initiative. Fortunately, t-tests show
no significant differences in the volume of coverage across
our three sources for either partisan issues or presidential
initiatives (p valuesrange from.17to .77). Thus,whileme-
dia coverage may not be entirely exogenous—production
values drive coverage to some extent—we did not un-
cover any relationship between the issues we examined
here and the volume of news stories across any of our
sources.
Finally, many of the surveillance issues in this study
are public health topics. To the extent our sample of issues
is biased, this threatens the generalizability of our results
(i.e., “health knowledge” as opposed to knowledge); it also
could violate the assumption that the j-units are sampled
randomly. In separate analyses, we sought to determine
if issue type was significantly related to the variation in
the parameters. In the aggregate, citizens are more knowl-
edgeable about health issues (p < .10). However, this vari-
able did not moderate the impact of education nor did it
alter the findings we report in Table 1.
31
See Prior (2005) for a discussion of the effect of media choice on
knowledge.
Conclusion
Higher levels of political knowledge have been associated
with an impressive range of outcomes: more tolerance,
greater levels of participation, and an increased ability
to assimilate information, just to name a few (e.g., Delli
Carpini and Keeter 1996; Krosnick and Brannon 1993;
Rahn, Aldrich, and Borgida 1994). To the extent that
the most knowledgeable are more likely to make deci-
sions consistent with their interests and values, the dis-
tribution of knowledge bears directly upon the quality of
representation (Althaus 2003; Converse 1990). Thus we
agree with Eveland and Scheufele who state, “when there
are disparities across social groups in political knowl-
edge democracy is at least a little less democratic, re-
gardless of the underlying reason for these inequities”
(2000, 216).
We examined whether variation in the amount of
media coverage exacerbates the disparities between the
information haves and have-nots. Differences in knowl-
edge that have been attributed to education become
greater in environments in which information is plenti-
ful. This is particularly the case with print news, which
is more abstract and factual, with few visual aids. In-
creases in television coverage do not lead to a sig-
nificant increase in the knowledge gap between low-
and high-education groups. Indeed, our results show
that the least educated benefit nearly as much as the
most educated (and in terms of relative gains, they do
better).
Our findings have important implications for schol-
ars, journalists, and political leaders. Simply providing
more information is likely to reinforce the knowledge
gap that exists between people with low and high levels
of education. Although scholars lament the tendency of
television to provide “simplistic, nonsubstantive, nonhis-
torical and noncontextual” coverage (Postman 1985, 141;
also see Bennett 2003), our results suggest the importance
of transmitting political information in ways that can be
comprehended by the least educated. This conclusion is
supported by others who have noted that the least ed-
ucated gravitate to easily digestible formats such as TV
news (e.g., Neuman, Just, and Crigler 1992) and the ef-
ficiency with which they learn from television (Chaffee
and Frank 1996; Kleinnijenhuis 1991). Even if learning
from this medium is largely passive or unintentional (e.g.,
Zukin and Snyder 1984), individuals may obtain enough
information to function as monitorial citizens (Schudson
1998).
This study represents an initial step toward a bet-
ter understanding of how media coverage affects citizen
CITIZENS, KNOWLEDGE, AND THE INFORMATION ENVIRONMENT 279
knowledge. However, as our own analysis suggests, we
have yet to account for all the variation in the education-
knowledge relationship. It stands to reason, then, that
other features of the information environment (e.g., how
the news is packaged, not just its sheer amount) might
affect the size and presence of knowledge gaps. The ques-
tion of whether the information environment affects the
TABLE
A1 Political Knowledge Questions and Answers
Question Answer Survey Period
Can states restrict abortion in the first trimester? They can after
Casey decision April 30–May 3, 1992
Clinton’s policy on gays in the military Don’t ask, don’t tell July 29–August 1, 1993
Clinton administration health care plan Workers guaranteed coverage December 2–5, 1993
How many killed in Rawanda massacre? Approximately 250,000 killed May 12–15, 1994
U.S. intervention in Haiti American forces killed Haitians October 6–10, 1994
California Proposition 215 on marijuana Allowed use in medical situations December 13–17, 1996
FDA action on allergy drug Seldane Steps to remove Seldane from shelves February 22–24, 1997
Balance budget agreement and Medicare Proposal to increase Medicare premiums June 18–22, 1997
Congressional proposals on Medicare Require upper income seniors to pay more August 7–10, 1997
Size of budget deficit relative to five years prior Decreased August 7–10, 1997
Why was Phen-Fen taken off the market? It caused heart valve problems October 17–21, 1997
Bombing of abortion clinic in Alabama Someone was killed February 13–17, 1998
Main reason for reforms of Social Security Projected funding problems in 30 yrs. April 17–27, 1998
Insurance coverage for Viagra versus birth control Companies more likely to cover Viagra June 12–18, 1998
Congressional action on patients’ rights legislation Congress has yet to take any action August 6–20, 1998
How does Preven work? Prevents a pregnancy from occurring October 10–18, 1998
Tobacco settlement Right to sue not part of the settlement December 8–13,1998
Clinton proposals on Social Security Government investment in stocks February 19–25, 1999
Report on financial condition of Social Security Run out of money later than expected April 10–22, 1999
Pharmaceutical companies and price fixing Pled guilty to vitamin price fixing June 11–16, 1999
Has patients’ rights been voted on by the Senate? It was passed in the Senate August 6–10, 1999
Nat’l Academy of Sciences on hospital errors New gov’t agency to protect patients December 3–13, 1999
Clinton State of the Union Address 2000 Proposed lowering Medicare to age 55 February 4–8, 2000
President Clinton and gun control Called for background checks at shows March 31–April 3, 2000
Democratic proposals for Medicare drug coverage Proposed to pay for prescription drugs May 26–June 4, 2000
Supreme Court action on partial–birth abortion States do not have right to outlaw August 2–6, 2000
Employer premiums for health insurance Increased faster than in previous years Sept. 29–Oct.2, 2000
FDA warning about PPA in medications Cold and cough medicines Nov. 29–Dec.3, 2000
Cabinet nomination of Tommy Thompson Nominated for Secretary of Dept. of HHS January 25–28, 2001
Solvency of Medicare and Social Security Government reports more longevity March 28–April 1, 2001
Senate action on the McCain-Feingold bill Senate passed the bill April 18–22, 2001
Patients’ rights legislation Patients can sue health plans May 31–June 3, 2001
Why controversy on funding stem cell research? Human embryos are destroyed August 2–5, 2001
Why injunction against Bush plan for drug cards? A lawsuit filed by drugstore chains Sept. 28–Oct. 1, 2001
Action on prescription drug discount cards Private company creates card program Jan. 31–Feb. 3, 2002
Action to provide elderly relief on prescription drugs Pharmacies establish drug card program March 28–31, 2002
International AIDS conference statements Prevention programs are effective July 18–21, 2002
How is West Nile Virus spread? Carried by mosquitoes Oct. 10–13, 2002
Risk factors associated with cervical cancer HPV is associated with cervical cancer December 6–10, 2002
President Bush’s proposal for fighting AIDS Increase U.S. funding for AIDS in Africa February 6–10, 2003
Senate action on partial-birth abortion ban Voted to pass the bill April 3–6, 2003
Note: Complete question wording, including response options, can be obtained from the Roper Center Archive. All surveys are separate cross-sections
even though dates may overlap.
relationship between knowledge and other demographic
characteristics (e.g., race, gender) also remains open.
Thus,whiledecadesof researchattheindividual-level may
have led to pessimistic conclusions regarding the distri-
bution of knowledge, greater attention to the information
environment might cast those conclusions in a different
light.
280 JENNIFER JERIT, JASON BARABAS, AND TOBY BOLSEN
TABLE
A2 Probit Estimates for Study 1
1998 Tobacco Settlement with States 1997 Congressional Proposals on Medicare
Right Joe Camel Payments Means Patient Cut Raise Age Wealthy
Parameter to Sue Ad Ban to States Test Benefits Choice Provider Pay to 67 Pay More
Education −0.001 0.043 0.097
∗∗
0.006 −0.021 0.121
∗∗
0.069+ 0.086
∗
(0.027) (0.028) (0.029) (0.044) (0.043) (0.042) (0.041) (0.042)
Income −0.056+ 0.012 0.079
∗
−0.028 0.090+ 0.041 −0.028 0.061
(0.034) (0.033) (0.034) (0.051) (0.050) (0.051) (0.050) (0.054)
Age −0.002 0.005+ 0.004 −0.001 0.001 −0.001 0.006 0.010
∗∗
(0.003) (0.003) (0.003) (0.004) (0.004) (0.004) (0.004) (0.004)
Female −0.076 −0.085 −0.312
∗∗
−0.140 −0.184 −0.158 0.037 −0.145
(0.085) (0.086) (0.088) (0.126) (0.122) (0.125) (0.123) (0.128)
Black −0.050 −0.093 −0.002 0.094 −0.098 −0.017 −0.247 0.044
(0.145) (0.142) (0.148) (0.198) (0.203) (0.207) (0.200) (0.216)
Follows issue 0.133
∗∗
0.301
∗∗
0.360
∗∗
0.168
∗∗
0.095 0.248
∗∗
0.144
∗∗
0.247
∗∗
(0.045) (0.043) (0.045) (0.061) (0.058) (0.061) (0.059) (0.061)
Constant −0.711
∗∗
−0.520
∗
−1.144
∗∗
−0.583+−0.493 −1.294
∗∗
−0.665
∗
−1.273
∗∗
(0.232) (0.227) (0.238) (0.332) (0.310) (0.309) (0.316) (0.347)
N 1,201 1,201 1,201 494 494 494 494 494
Note: Table entries are multivariate probit maximum likelihood estimates with robust standard errors in parentheses. Rho coefficients
have been suppressed for presentation purposes. The data have been weighted to reflect the U.S.
Appendix
The Political Knowledge Series
When constructing the political knowledge series, we
looked for surveys conducted by a single organization
which contained questions about political knowledge and
news attention. A search of all available dates in the
Roper Center for Public Opinion Research iPoll database
turned up 41 surveys conducted by Princeton Survey Re-
search Associates that had at least one close-ended politi-
cal knowledge question as well as a measure of how closely
the respondent was following that issue. Most of the 41
surveys we chose had more than one knowledge question,
in which case we randomly selected a question.
32
Ta bl e A1
lists the question topic and correct answer for each of the
surveys we use in the analysis.
Detailed information on the surveys, including ques-
tion wording, order, and introductions, etc., is available
at the Roper Center. The Kaiser Family Foundation and
Harvard School of Public Health sponsored many of the
surveys in our sample. For more information on survey
methodology and response rates, see Brodie et al. (2003)
or .
32
Study 2 has two randomly selected questions from Study 1 (right
to sue, wealthy pay more).
Study 1 Probit Coefficients
Table A2 presentsthecoefficients for the models described
in Study 1 (Figure 1). Question wording is available at the
Roper Center.
References
Althaus, Scott L. 2003. Collective Preferences in Democratic Pol-
itics: Opinion Surveys and the Will of the People. Cambridge:
Cambridge University Press.
Alvarez,R. Michael.1997.Information and Elections.AnnArbor:
Univ.ofMichiganPress.
Bennett, Lance. 2003. News: The Politics of Illusion,5
th
ed. White
Plains: Longman.
Bennett, Stephen E. 1988. “‘Know-Nothings’ Revisited: The
Meaning of Political Ignorance Today.” Social Science Quar-
terly 69(June):476–90.
Brians, Craig L., and Martin P. Wattenberg. 1996. “Campaign Is-
sue Knowledge and Salience: Comparing Reception from TV
Commercials, TV News, and Newspapers.” American Journal
of Political Science 40(February):172–93.
Brodie,MollyAnn, Elizabeth C. Hamel, DrewE.Altman, Robert
J. Blendon, and John M. Benson. 2003. “Health News and
the American Public, 1996–2002.” Journal of Health Politics,
Policy and Law 28(October):927–50.
Chaffee, Steven, and Stacey Frank. 1996. “How Americans
Get Political Information: Print versus Broadcast News.”
CITIZENS, KNOWLEDGE, AND THE INFORMATION ENVIRONMENT 281
Annals of the American Academy of Political and Social Sci-
ences 546(July):48–58.
Cicchetti, Domenic, and Sara S. Sparrow. 1981. “Developing
Criteria for Establishing Interrater Reliability of Specific
Items: Applications to Assessment of Adaptive Behavior.”
American Journal of Mental Deficiency 86(2):127–37.
Converse, Philip E. 1990. “Popular Representation and the Dis-
tribution of Information.” In Information and Democratic
Processes, ed. John A. Ferejohn and James H. Kuklinski. Ur-
bana: University of Illinois Press, pp. 369–88.
Dalton, Russell Paul, A. Beck, and Robert Huckfeldt. 1998.
“Partisan Cues and the Media: Information Flows in the
1992 Presidential Election.” American Political Science Re-
view 92(March):111–26.
Delli Carpini, Michael X., and Scott Keeter. 1991. “Stability and
Change in the U.S. Public’s Knowledge of Politics.” Public
Opinion Quarterly 55(Winter):583–612.
Delli Carpini, Michael X., and Scott Keeter. 1996. What Amer-
icans Know About Politics and Why It Matters. New Haven:
Yale University Press.
Delli Carpini, Michael X., Scott Keeter, and J. David Kennamer.
1994. “Effects of the News Media Environment on Citizen
Knowledge of State Politics and Government.” Journalism
Quarterly 71(2):443–56.
Druckman, James N. 2005. “Media Matter: How Newspapers
and Television News Cover Campaigns and Influence Vot-
ers.” Political Communication 22(October-December):463–
81.
Eveland, William P., and Dietram A. Scheufele. 2000. “Connect-
ing News Media Use with Gaps in Knowledge and Participa-
tion.” Political Communication 17(July):215–37.
Freedman, Paul, Michael Franz, and Kenneth Goldstein. 2004.
“Campaign Advertising and Democratic Citizenship.” Amer-
ican Journal of Political Science 48(October):723–41.
Gaziano, Cecilie. 1983. “The Knowledge Gap: An Analyt-
ical Review of Media Effects.” Communication Research
10(October):447–86.
Gaziano, Cecilie. 1997. “Forecast 2000: Widening Knowledge
Gaps.” Journal of Mass Communication Quarterly 74(2):237–
64.
Gilens, Martin. 2001. “Political Ignorance and Collective
Policy Preferences.” American Political Science Review
95(June):379–96.
Goldstein, Harvey. 2003. Multilevel Statistical Models,3
rd
ed.
London: Arnold.
Gordon, Stacy B., and Gary M. Segura. 1997. “Cross-National
Variation in the Political Sophistication of Individuals: Ca-
pability or Choice?” Journal of Politics 59(February):126–
47.
Graber, Doris A. 2004. “Mediated Politics and Citizenship in
the Twenty-First Century.” Annual Review of Psychology
55(January):545–71.
Graber, Doris A. 2002. Mass Media and American Politics,6
th
ed. Washington: Congressional Quarterly Press.
Graber, Doris A. 1994. “Why Voters Fail Information Tests:
Can the Hurdles Be Overcome?” Political Communication
11(October–December):331–46.
Greene, William H. 2003. Econometric Analysis,5
th
ed. Upper
SaddleRiver,NJ:PrenticeHall.
Hambleton, Ronald K., and Hariharan Swaminathan. 1985.
Item Response Theory: Principles and Applications.Boston:
Kluwer-Nijhoff Publishing.
Hetherington, Marc J. 1996. “The Media’s Role in Forming Vot-
ers’ National Economic Evaluations in 1992.” American Jour-
nal of Political Science 40(May):372–95.
Holbrook, Thomas M. 2002. “Presidential Campaigns and
the Knowledge Gap.” Political Communication 19(October):
437–54.
Huckfeldt, Robert. 2001. “The Social Communication of
Political Expertise.” American Journal of Political Science
45(April):425–38.
Hutchings, Vincent. 2001. “Political Context, Issue Salience,
and Selective Attentiveness: Constituent Knowledge of the
Clarence Thomas Confirmation Vote.” Journal of Politics
63(August):846–68.
Hutchings, Vincent L. 2003. Public Opinion and Democratic Ac-
countability. Princeton: Princeton University Press.
Iyengar, Shanto. 1990. “Shortcuts to Political Knowledge: The
Role of Selective Attention and Accessibility.” In Information
and Democratic Processes, eds. John A. Ferejohn and James H.
Kuklinski. Urbana: University of Illinois Press, pp. 160–85.
Just, Marion R., AnnN. Crigler, Dean E.Alger, Timothy E.Cook,
Montague Kern, and Darrell M. West. 1996. Crosstalk: Citi-
zens, Candidates and the Media in a Presidential Campaign.
Chicago: University of Chicago Press.
King, Gary, James Honaker, Anne Joseph, and Kenneth Scheve.
2001. “Analyzing Incomplete Political Science Data.” Amer-
ican Political Science Review 95(March):49–69.
Kleinnijenhuis, Jan. 1991. “Newspaper Complexity and the
Knowledge Gap.” European Journal of Communication
6(December):499–522.
Krassa, Michael A. 1990. “Political Information, Social Environ-
ments, and Deviants.” Political Behavior 12(December):315–
30.
Krosnick, Jon A., and Laura A. Brannon. 1993. “The Impact of
the Gulf War on the Ingredients of Presidential Evaluations:
Multidimensional Effects of Political Involvement.” Ameri-
can Political Science Review 87(December):963–75.
Kuklinski, James H., Paul J. Quirk, Jennifer Jerit, and Robert F.
Rich. 2001. “The Political Environment and Citizen Compe-
tence.” American Journal of Political Science 45(April):410–
24.
Kuklinski, James H., Paul J. Quirk, Jennifer Jerit, David
Schwieder, and Robert F. Rich. 2000. “Misinformation
and the Currency of Citizenship.” Journal of Politics
62(August):791–816.
Kwak, Nojin. 1999. “Revisiting the Knowledge Gap Hypothe-
sis: Education, Motivation, and Media Use.” Communication
Research 26(August):385–413.
Leighley, Jan E. 2004. Mass Media and Politics: A Social Science
Perspective. New York: Houghton Mifflin Company.
Lodge, Milton, Marco R. Steenbergen, and Shawn Brau. 1995.
“The Responsive Voter: Campaign Information and the Dy-
namics of Candidate Evaluation.” American Political Science
Review 89(June):309–26.
Lord, Frederic M., and Melvin R. Novick. 1968. Statistical
Theories of Mental Test Scores. Reading, MA: Addison-
Wes le y.
282 JENNIFER JERIT, JASON BARABAS, AND TOBY BOLSEN
Lupia, Arthur, and Mathew D. McCubbins. 1998. The Demo-
cratic Dilemma. Cambridge: Cambridge University Press.
Luskin, Robert C. 1990. “Explaining Political Sophistication.”
Political Behavior 12(December):331–61.
Luskin, Robert C., and John Bullock. 2005. “Don’t Know Means
Don’t Know.” Paper presented at the Annual Meeting of the
Midwest Political Science Association.
McLeod, Jack M., Carl R. Bybee, and Jean A. Durall. 1979.
“Equivalence of Informed Political Participation: The 1976
Debates as Source of Information.” Communication Research
6(October):463–87.
Miyo, Yuko. 1983. “The Knowledge-Gap Hypothesis and Me-
dia Dependency.” In Communication Yearbook, Part 7,ed.
Robert N. Bostrom. London: Sage, pp. 626–50.
Mondak, Jeffery J. 2001. “Developing Valid Knowledge Scales.”
American Journal of Political Science 45(January):224–
38.
Mutz, Diana C., and Jeffrey J. Mondak. 2006. “The Workplace
as a Context of Cross-Cutting Political Discourse.” Journal
of Politics 68(February):140–55.
Neuman, W. Russell. 1986. The Paradox of Mass Politics: Knowl-
edge and Opinion in the American Electorate. Cambridge:
Harvard University Press.
Neuman, W. Russell, Marion R. Just, and Ann N. Crigler. 1992.
Common Knowledge: News and the Construction of Political
Meaning. Chicago: University of Chicago Press.
Nicholson, Stephen P. 2003. “The Political Environment and
Ballot Proposition Awareness.” American Journal of Political
Science 41(July):403–10.
Pinheiro, Jose C., and Douglas M. Bates. 2000. Mixed-Effects
Models in S and S-PLUS.NewYork:Springer.
Postman, Neil. 1985. Amusing Ourselves to Death: Public Dis-
course in the Age of Show Business. New York: Penguin.
Price, Vincent, and Edward J. Czilli. 1996. “Modeling Patterns
of News Recognition and Recall.” Journal of Communication
46(Spring):55–78.
Price, Vincent, and John Zaller. 1993. “Who Gets the
News? Alternative Measures of News Reception and
Their Implications for Research.” Public Opinion Quarterly
57(Summer):133–64.
Prior, Markus. 2005. “News vs. Entertainment: How Increas-
ing Media Choice Widens Gaps in Political Knowledge and
Turnout.” American Journal of Political Science 49(July):577–
92.
Rahn, Wendy, Aldrich John, and Borgida Eugene. 1994. “Indi-
vidual and Contextual Variations in Political Candidate Ap-
praisal.” American Political Science Review 88(March):193–
99.
Rasbash, Jon, William Browne, Harvey Goldstein, Min Yang,
Ian Plewis, Michael Healy, Geoff Woodhouse, David Draper,
Ian Langford, and Toby Lewis. 2000. “A User’s Guide to ML-
wiN.” London: Multilevel Models Project at the Institute of
Education, University of London.
Raudenbush, Stephen W., and Anthony S. Bryk. 2002. Hierar-
chical Linear Models: Applications and Data Analysis Methods,
2
nd
ed.NewburyPark:Sage.
Rhine, Staci L., Stephen Earl Bennett, and Richard S. Flickinger.
2001. “Gaps in Americans’ Knowledge about the Bosnian
Civil War.” American Politics Research 29(November):592–
607.
Robinson, John P., and Mark R. Levy. 1986. The Main Source:
Learning from Television News. Beverly Hills: Sage.
Schudson, Michael. 1998. The Good Citizen: A History of Amer-
ican Public Life.NewYork:FreePress.
Smith, Mark A. 2002. “Ballot Initiatives and the Democratic
Citizen.” Journal of Politics 64(August):892–903.
Steenbergen, Marco R., and Bradford S. Jones. 2002. “Model-
ing Multilevel Data Structures.” American Journal of Political
Science 46(January):218–37.
Tichenor, Philip J., George A. Donohue, and Calice N. Olien.
1970. “Mass Media Flow and Differential Growth in Knowl-
edge.” Public Opinion Quarterly 34(Summer):159–70.
Zaller, John. 1992. The Nature and Origins of Mass Opinion.
Cambridge: Cambridge University Press.
Zaller, John. 2003. “A New Standard of News Quality: Burglar
Alarms for the Monitorial Citizen.” Political Communication
20(April–June):109–30.
Zukin, Cliff, and Robin Snyder. 1984. “Passive Learning: When
the Media Environment Is the Message.” Public Opinion
Quarterly 48(Autumn):629–38.