Local E-Government in Norway Current Status and Emerging Issues doc
Bạn đang xem bản rút gọn của tài liệu. Xem và tải ngay bản đầy đủ của tài liệu tại đây (276.53 KB, 44 trang )
© Scandinavian Journal of Information Systems, 2005, 17(2):41–84
Local E-Government in
Norway
Current Status and Emerging Issues
Leif Skiftenes Flak
Agder University College, Norway
Dag H. Olsen
Agder University College, Norway
Peter Wolcott
University of Nebraska at Omaha, USA
Abstract. Recent studies indicate that e-government initiatives have not held
their promise of improving government services. The majority of efforts to
benchmark e-government have had central government as the unit of analy-
sis. This study employs the MeGAP-3 (The Municipal E-Government Assess-
men Project) assessment tool to assess the status of municipal e-government
in the Agder region in southern Norway, an area with high Internet penetration
and mature information and communication technology (ICT) use. MeGAP-3
proved effective in providing a relative positioning of these Norwegian munici-
palities, but we argue that country specific assessment indicators are needed
to complement the tool and enable cross-country comparisons by relative
scores. Surprisingly, the results show that the sophistication of local govern-
ment web sites was fairly low. A series of qualitative interviews were con-
42 • L. S. Flak, D. H. Olsen & P. Wolcott
ducted to explore the factors that shape the development of municipal e-
government. The evidence suggests that the dominant stakeholder in devel-
opment is the bureaucratic administration rather than citizens or politicians.
This group has a strong focus on internal efficiency and cost reduction. The
majority of respondents report cost reduction as the major driver behind e-
government development. However we also identified a more citizen-centric
approach that stresses the need for improving access and service quality for
citizens. The study outlines a number of areas where further research will be
needed to fully understand the development of e-government in Norway.
Key words: local e-government, e-government benchmarking, local govern-
ment web site assessment.
1 Introduction
For several years, governments throughout the world have been seeking to
provide electronic access to government services. Key reasons for this public
sector reform have been to increase the efficiency of government operations,
strengthen democracy, enhance transparency, and provide better and more ver-
satile services to citizens and businesses (Coe et al. 2001; Ho 2002; La Porte
et al. 2002; Watson and Mundy 2001). An e-government benchmark of United
Nations members underscores with exuberance the potential of e-government
for nations of the world.
But perhaps what e-government is ultimately all about is opportunity. Opportu-
nity to transform a public sector organization’s commitment so it can function
as truly citizen-centric. Opportunity to provide cost effective services to the
private sector contributing to the development of business and promoting long-
term economic growth. Opportunity to enhance governance through improved
access to accurate information and transparent, responsive and democratic
institutions. The types of services that can be delivered over the internet are
still being conceived, developed and improved by both the public and the pri-
vate sectors. Over the next few years expect to see a [sic] increased experimen-
tation, innovation, and organizational learning in an effort to perfect e-
government. (Ronaghan 2001, p. 6).
At the same time, a growing number of studies indicate that many of these
hopes have not been realized, at least not to the extent expected (Hoegler and
Schuster 2002; Moon and Bretschneider 2002; Reddick 2004). These studies
concluded that e-government has not revolutionized the way government
L. S. Flak, D. H. Olsen & P. Wolcott • 43
functions and that governments have not realized the anticipated benefits of
cost-savings, improved service delivery, and so forth.
Clearly, the e-government experience varies dramatically from one govern-
ment to another, both between and within countries, with numerous individual
examples of success (Jorgensen and Cable 2002) and of failure (Hoegler and
Schuster 2002). Several studies compare countries (Dalziel 2004; Hunter and
Jupp 2002; Cap Gemini Ernst & Young 2003; Ronaghan 2001; United Nations
2003); but on the whole, how well are governments progressing up the ladder
toward e-government maturity and effectiveness? A number of stage models
postulate an evolution from a simple web presence and information dissemi-
nation function through support for transactions, for e-democracy, and other
so-called advanced characteristics (Baum and Di Maio 2000; Layne and Lee
2001; Cap Gemini Ernst & Young 2003; Reddick 2004; Ronaghan 2001;
Watson and Mundy 2001). But to what extent are governments moving
beyond the simple information dissemination stages to offering support for
transactions or transforming the nature of the relationship between citizens
and government, through e-democracy (Anttiroiko 2001; Nugent 2001)?
One place to look for answers is in countries that are leaders in information
and communications technologies (ICT) and e-government implementation.
International surveys place the Scandinavian countries among the more
mature in Internet penetration, user experience with IT/IS, and sophistication
of e-government services (Dalziel 2004; EIU 2004; Ferrell 2003; Hunter and
Jupp 2002; Cap Gemini Ernst & Young 2003; Ronaghan 2001; United Nations
2003).
This study assesses e-government services at the level of local government
in southern Norway. In Norway, the municipality is the government level that
has the most direct contact with the citizens and businesses and is responsible
for providing an array of basic services. In recent years the municipalities
throughout Norway have made considerable efforts to establish and refine
their on-line presence. In 2003, 96% of the municipalities had their own web
site (Statistisk sentralbyrå 2004). Still, the functionality and quality of content
vary greatly.
The framework applied in this study is the MeGAP-3 methodology (Kaylor
et al. 2001; Public Sphere Information Group 2002). The MeGAP-3 assess-
ment tool was developed to assess the status of municipal e-government
implementations in the United States. It supports a more detailed analysis of
the depth and breadth of municipal services than any other assessment frame-
work found in the literature. The tool, described below, consists of 68 per-
formance measures identifying the presence and sophistication of a range of
on-line services. In the United States, MeGAP-3 has been used to study e-gov-
44 • L. S. Flak, D. H. Olsen & P. Wolcott
ernment services of the largest U.S. cities (>100,000 population), and regions
surrounding Boston (Massachusetts), St. Louis (Missouri), Minneapolis/St.
Paul (Minnesota), and others. We applied MeGAP-3 to thirty municipalities in
two neighbouring counties in southern and south-eastern Norway. Known col-
lectively as “Agder,” the counties of East- and West-Agder (Aust-Agder and
Vest-Agder) consist of municipalities that represent a broad range of size,
wealth, and industry. This paper reports the first attempt to apply an assess-
ment tool designed for U.S. municipal web sites in a Scandinavian setting in
order to explore its applicability outside of its original context. Although there
are several important challenges to a direct transfer of frameworks and tools
across political and cultural settings, a common assessment tool can increase
the ability to benchmark diverse government web sites and transfer knowledge
internationally.
The results show large variations in the range and sophistication of the
municipal web content. Overall, the sophistication of the web sites was not as
high as initially expected. A series of qualitative interviews were conducted to
elaborate on the reasons for the diverse quality of the different municipal web
sites. In particular, we were interested in understanding the driving motiva-
tions behind web site development and their role in determining a municipal-
ity’s MeGAP-3 score, which is a function of the depth and breadth of services
provided. From the interviews, we were able to identify two distinct
approaches to the e-government efforts. The first approach was driven by the
administration’s desire to cut costs and deliver services more efficiently. The
second approach was motivated by a desire to provide added value to the cus-
tomers of the municipalities. Of the two approaches, the first proved to be the
more common in the municipalities in which we conducted interviews. It is
difficult to predict the result of following either of the approaches; however,
the outcomes of these different strategies warrant additional research.
1.1 Measuring E-Government
There is no shortage of interest in assessing e-government efforts. Studies
commissioned by the United Nations, the European Union, individual coun-
tries, private consulting companies, and individual researchers have mush-
roomed in recent years (Center for Administrative Innovation 2004; Radford
and Holmes 1999; Hunter and Jupp 2002; norge.no 2004; Cap Gemini Ernst &
Young 2003; Ronaghan 2001; West 2003a; b). In each case, policy-makers,
government officials, researchers, and others seek to learn lessons from other
governments’ e-government policies, measure e-government progress relative
to other governments, identify and learn from best practices, discover global
L. S. Flak, D. H. Olsen & P. Wolcott • 45
trends and measure underlying e-government concepts to identify points of
leverage (Janssen et al. 2004). Often e-government is assessed through the use
of an index or benchmark which yields some sort of score that can be used to
rank governments against each other, or with themselves over time. The temp-
tation to misuse or over-generalize such indexes is great. Statements like
“country X ranks #3 while country Y ranks #7” or “country Z moved up from
#12 in 2002 to #7 in 2004” are superficially satisfying, but by themselves lack
meaning and usefulness. Indexes may suffer from problems with geographic
coverage, methodology, bias, or a lack of transparency (ITU Development
Report 2003). Properly understanding indexes and their limitations requires an
understanding of precisely what it is they do, or do not, measure. Comparing
indexes similarly requires care that apples are compared with apples.
Different assessments measure different aspects of e-government. Some
studies examine the demand for e-government (Barnes and Vidgen 2004;
Gartner Research 2001; Graafland-Essers and Ettedgui 2003), while others
examine the supply and nature of e-government services (Cap Gemini Ernst &
Young 2003). Janssen et al. classified eighteen e-government benchmarking
studies into four groups depending on their focus: supply-oriented, demand-
oriented, information society orientation and meta-benchmarking (Janssen et
al. 2004).
At the same time, studies can differ in their level and unit of analysis. A
recent United Nations report (United Nations 2003) examines only the top
level government when countries’ level of e-government are assessed. An
Accenture study also assesses national web sites (Hunter and Jupp 2002). The
EU has a systematic evaluation and follow-up of the e-government develop-
ment in member countries. EU has commissioned a series of E-Government
evaluation reports by Cap Gemini Ernst & Young, and their studies are based
on 12 government-to-citizen and 8 government-to-business indicators (Cap
Gemini Ernst & Young 2003). These studies are not limited to specific levels
of government, but examine services, whichever level of government provides
them. Several European countries maintain their own internal rankings of, for
example, government portals (e.g., the internal Norwegian ranking (norge.no
2004)). Similar efforts are being made in the United States and Canada. West
analysed state and national web sites (West 2000). Several studies have bench-
marked municipal web sites (Brueckner 2002; Stowers 1999; West 2000;
2003b; Public Sphere Information Group 2002). Some studies examine web
sites exclusively (Kaylor et al. 2001), while others examine both front-end and
back-end systems alike (Vintar et al. 2003). Still others build indexes from a
wide range of indicators, not all of which relate specifically to e-government
(ITU Development Report 2003).
46 • L. S. Flak, D. H. Olsen & P. Wolcott
Studies also differ in which characteristics of digital provision of services
are of interest. Some studies limit themselves to so-called meta characteristics
of web sites, focusing on issues of access, navigability, ease-of-use, and other
aspects of design (Barnes and Vidgen 2004; Potter 2002; Smith 2001). Other
studies focus on content and exclude design considerations. The European
Commission has defined 23 indicators to monitor the progress and success of
the E-Europe program (eEurope 2001). Other studies employ a mix of indica-
tors. A survey of Norwegian public web sites evaluates quality and content in
three dimensions: accessibility for all, user interface and useful content of
information and services (norge.no 2004). The instrument focuses primarily
on design quality; content is evaluated only at aggregate levels.
While researchers may in the future develop a unified theory that domi-
nates the theoretical landscape of e-government, we contend that at present it
is appropriate that there exist a multitude of studies examining a variety of lev-
els and units of analysis, geographic regions, definitions of e-government, web
site characteristics, and so forth in numerous combinations and permutations.
One should not expect that one study can do the work of another, or that a lack
of comparability between two studies implies a lack of compatibility.
Another legitimate question is the extent to which studies that focus on
assessing web sites in the private sector context (e.g., TAM (Technology
Acceptance Model), (Davis 1989), WebQual (Barnes and Vidgen 2001; 2003),
WEBQUAL
TM
(Loiacono et al. 2002) and EWAM (Extended Web Assessment
Method,) (Schubert 2002) may yield insights in the public sector context. A
key distinction associated with the private/public contrast is the purpose of the
organizations. Whereas private sector organizations mainly exist to generate
profit, public organizations have a moral or legal responsibility to provide a
set of basic services to all their constituents. Hence, a public agency cannot
choose its customers, but rather has a duty to ensure full access to all services
by everyone (Adams et al. 2003). A consequence of such sectoral distinctions
has been that insights from the private sector cannot automatically be applied
to the public sector. Difficulties in translating prescriptions developed for the
private sector to a public sector context have been reported both from the
information systems and the strategic planning literature. According to Kaylor
et al. the corporate model for benchmarking web-enabled delivery of services
is engaged in the same struggle as cities (Kaylor et al. 2001). For the most
part, performance standards refer to organizational and content-related matters
or to ex post facto measures of performance, such as counting web site visitors
(hit counts). Similarly, research on the effectiveness of e-government efforts to
date often has content analysis or measures of usage. Bretschneider studied
differences between management information systems and public manage-
L. S. Flak, D. H. Olsen & P. Wolcott • 47
ment information systems and found that public and private organizations
operate in different environments, which influence the management of com-
puters and hence information (Bretschneider 1990). Kaplan and Norton
attempted to implement their balanced scorecard in public sector organiza-
tions, but found that the sectoral differences inhibited the scorecard from pro-
viding the same value in public organizations as in private (Kaplan and Norton
2001). As a consequence they developed a revised version of the scorecard,
particularly suited to fit public sector and NGOs.
A number of web site assessment indicators developed for the private sec-
tor may be useful for assessing local government web sites. Typically, indica-
tors assessing usability and general design principles are thought to be equally
valid in both sectors. On the other hand, both the number of available services
and the nature of the services provided differ significantly between govern-
ment web sites and business web sites. Whereas businesses typically provide a
small number of services targeted at defined customer groups, government
agencies are expected to provide a range of services targeted at all citizens.
Also, while businesses typically aim at profit maximization, government
agencies are budget optimizing, aiming at providing the best possible service
within the possibilities of existing budgets. Hence, neglecting to assess the
actual amount of on-line services can lead to incomplete assessments generat-
ing only parts of the data necessary for benchmarking and comparing local
government web sites.
The current study makes a unique contribution to the rich diversity of e-
government studies by examining the supply of e-government services
through municipal web sites in the Agder region of Norway. As described
below, the study examines in detail the breadth and depth of services provided
on these municipalities’ web sites. While other studies have focused on Nor-
wegian municipalities (norge.no 2004) or examined in depth the supply of e-
government services within municipalities (Public Sphere Information Group
2005; Public Sphere Information Group 2002), none has done both.
1.2 The Norwegian System of Local Government
Since the ratification of the Norwegian constitution in 1814, Norway has been
governed as a social democracy with a parliamentary system of government.
Government functions are distributed across three layers: the central govern-
ment, the regional government and the local government. To ensure equity and
democracy in a geographically stretched and sparsely populated country, each
of the layers is further divided into several units to address the multitude of
48 • L. S. Flak, D. H. Olsen & P. Wolcott
government responsibilities. The local government has the greatest direct con-
tact with citizens.
Today Norway is divided into 434 local government units, the municipali-
ties, organized within 19 regions. The municipalities differ in population from
less than one thousand to several hundred thousand. As in the county, the
municipality is governed by a body of elected politicians (the municipal coun-
cil) and an administration of bureaucrats. The mayor is the top representative
and leads the meetings of the council. The main tasks of the council are to
allocate funds to municipal initiatives and to approve budgets, plans, loans,
and the buying and selling of property. The council appoints committees for
municipal purposes or to handle parts of the municipal operation. These com-
mittees are granted decision authority according to Norwegian law.
The bureaucratic administration is headed by the Chief Administration
Officer (Rådmann). Below him or her are a number of municipal offices, e.g.
Health care, School, Social Security and Technical (fire department, waste
management). These offices have responsibility for the day-to-day running of
the municipality.
The municipality is funded by local taxes and state funding. However, the
size of state funding is decreasing, forcing the municipalities to become more
efficient in their operations. At the same time, the state is presenting govern-
ment reform programs aiming at improving service quality and the availability
of service to citizens and businesses.
To meet the demand for improvement and concurrently cope with limited
resources, the municipalities have undertaken several initiatives to reorganize
their operations. A key factor in this reform process has been e-government:
the use of ICT (particularly the Internet) to improve information dissemination
and service provision and provide a more open and available local govern-
ment. Still, the deployment of e-government bears considerable initial costs.
These costs may be justified in large municipalities, but are more difficult to
gain acceptance for in the smaller communities. As a consequence, a number
of municipalities collaborate to share initial development costs.
1.3 Research Questions
In light of the above discussion, we focus our investigation on three principal
research questions:
1. What is the state of e-government at the municipal level in the Agder
counties? To what extent have Agder municipalities implemented the
L. S. Flak, D. H. Olsen & P. Wolcott • 49
more sophisticated e-government functions and services: e-commerce
and e-democracy?
2. How well suited is the MeGAP-3 assessment tool to assessing
municipal web sites in the Norwegian context?
3. What factors shape the development of municipal e-government
solutions? If differences exist, what explains them?
While international comparisons often examine top-level government web
sites, research question one focuses on local government web sites in a Nor-
wegian region. This will provide insights on the sophistication of local gov-
ernment web sites, where the majority of interaction between government and
civil society occurs. Insights from local e-government can also provide correc-
tions to national benchmarking initiatives.
We have shown that current e-government assessment frameworks either
focus on prerequisites for e-government (United Nations 2003), design quality
(norge.no 2004) or a small selection of comparable services (Cap Gemini
Ernst & Young 2003). The MeGAP-3 framework puts emphasis on on-line
service provision. Research question two allows for a discussion of the useful-
ness of applying an assessment framework like MeGAP-3 in a context other
than that for which it was designed.
A few studies describe factors that influence the shaping of municipal e-
government development (Henriksen 2004; Ho 2002; Kim 2001; Lowe 2003;
Moon 2002; Prattipati 2003; United Nations 2003). These studies differ
greatly in the sets of factors identified and provide no coherent overall picture.
Consequently, we took a qualitative, exploratory approach with research ques-
tion three to probe the issue of how differences between local governments
within a region can be explained.
2 Methodology
This section presents the e-government assessment methodology and our
application of it. We further present the complementary qualitative methods
used.
2.1 MeGAP-3 Methodology
To evaluate municipal web sites in Adder, we applied the MeGAP-3 assess-
ment tool to each. The Municipal E-Government Assessment Project
(MeGAP) began as an effort to provide guidance to cities and communities as
50 • L. S. Flak, D. H. Olsen & P. Wolcott
planners thought strategically about e-government implementation (Kaylor et
al. 2001). These efforts, undertaken by Charles Kaylor at the University of
Michigan and later at the Public Sphere Information Group (PSI Group),
sought to identify the leading edge of municipal e-government implementa-
tions by assessing the functions and services that municipalities were provid-
ing in a web-enabled form. By design, the assessment looks at the manner in
which a function or service is provided on the web but does not evaluate the
generic quality of the web site (e.g. navigability, quality, style) or extent of use
by end users.
The third version of the MeGAP (MeGAP-3), used in this study, assesses
68 distinct web performance dimensions grouped into four categories (see
Appendix):
1. Information dissemination (e.g., city codes, official minutes, traffic
information, municipal government directory)
2. Interactive functions (e.g., bidder applications, downloadable forms,
building permit process, business license)
3. E-Commerce functions (e.g., utilities payment, property tax look-up
and payment, code enforcement)
4. E-Democracy (e.g., e-meetings, e-forums, user customization,
volunteer opportunities)
For a given municipality, each of the 68 performance dimensions is scored on
a 1-4 scale, which indicates the degree of interactivity or completeness of the
web implementation of the dimension. This scoring corresponds roughly to
the stage model concepts used in many other assessments (Baum and Di Maio
2000; Hunter and Jupp 2002; Layne and Lee 2001; Cap Gemini Ernst &
Young 2003; Ronaghan 2001), though it applies at the function level rather
than at the government level. The four non-zero scores are:
1. Information about a given function or service exists on the web site.
This score indicates that the web site contains a reference to a function
or service, or that the function or service exists in a very limited and
incomplete form. For example, a web site might identify an economic
development office and indicate its mission, but provide minimal
concrete information about economic development plans or
opportunities for participation in the planning process.
2. A link to a relevant contact (e.g., phone, e-mail) or substantially
complete information exists on the web site. In this case, the web site
would provide contact information for the economic development
office, extensive information about plans and processes, or both.
L. S. Flak, D. H. Olsen & P. Wolcott • 51
3. Downloadable forms or other support for submitting information to the
municipality exist. The key thought behind a score of ‘3’ is that the
web site offers the user a means of submitting information to the
municipality that is more than just e-mail. The most common means of
gaining a score of ‘3’ is to offer electronic versions of paper forms that
can be downloaded, filled out, and submitted electronically or
physically to the municipality. Electronic forms used simply to collect
information also fall into this category. For example, a web site might
offer downloadable forms for applying for economic development
funding. This score is comparable to the ‘active/passive’ level in
(Hunter and Jupp 2002) in which the user is able to interact with the
web site, but the government role is passive.
4. Transaction or other interaction can take place completely on-line. The
highest form of interactivity involves a complete transaction in which
user input causes some change or response on the part of the
municipality’s information system. Continuing our example, a web site
might return to the user a dynamically generated application identifier
that the user could subsequently use to look up on-line the status of his
application. Users might also be able to query for economic
development information using a variety of criteria.
In addition to the 68 performance dimensions, MeGAP-3 includes nine evalu-
ative criteria (e.g. presence of advertising, support for multiple languages,
stated privacy policy), which are evaluated on a 0-1 scale.
The scores for the 68 performance dimensions and nine evaluative criteria
are added to obtain a single e-score. The e-score provides one way of quanti-
fying the extent to which a municipality has web-enabled its interface to its
citizens. E-scores offer a means of comparing the progress of multiple munic-
ipalities at the same point in time, or of the same municipality at multiple
points in time. A detailed comparison of the performance dimensions that con-
stitute the e-scores can offer individual municipalities insight into how they
compare with their peers in particular functional areas and suggest opportuni-
ties for improving or expanding services and functions through electronic
means (Kaylor et al. 2004; Public Sphere Information Group 2005).
The MeGAP-3 performance dimensions were developed by studying
municipal functions in web sites in the United States, The framework was
developed more out of a pragmatic desire to identify the leading edge of e-
government implementation than out of theoretical considerations. While
many assessment frameworks use a relatively sparse set of indicators (e.g., the
EU assessment with 12 government-to-citizen (G2C) indicators) in the inter-
ests of simplicity and comparability across regions, we felt that the more
52 • L. S. Flak, D. H. Olsen & P. Wolcott
extensive list of functions of MeGAP-3 could provide deeper insight into the
nature of municipal e-government than could other assessment frameworks. In
spite of the lack of a firm theoretical foundation in MeGAP-3, we therefore
decided to base our study on this framework, recognizing that our study is but
a first step towards a more comprehensive and theoretically grounded investi-
gation of municipal e-government in Norway and elsewhere.
2.2 Application of MeGAP-3
We decided to use the MeGAP-3 assessment exactly as it was developed by
the PSI Group. First, we wanted to determine the extent to which an instru-
ment—developed to analyse American municipalities–could be used success-
fully in a non-American context. We did not make the assumption that
MeGAP-3 was perfectly suited to the Norwegian context. Rather, we felt that
using the instrument as-is would provide insight into how the instrument
might have to be adapted to a non-American context in later research. Second,
if the instrument proved useful, it could provide a better basis for comparing
American and Norwegian municipalities than would two non-identical instru-
ments.
Between December 2003 and April 2004 we applied MeGAP-3 to the 15
municipalities in Vest-Agder and the 15 in Aust-Agder. To increase the com-
parability of Agder e-scores with those done by the PSI Group, we independ-
ently evaluated a number of American municipalities. This set, chosen by the
PSI Group, included American municipalities representing a broad range of e-
scores. The PSI Group compared these e-scores with its own and found them
to be consistent.
2.3 Qualitative Methods
While e-scores provide a basis for comparing municipalities, they provide no
insight into why municipalities develop web sites in the way that they do. To
understand the process of web site development and the factors that affect the
implementation of this or that function or service on a municipal web site we
conducted a set of semi-structured interviews with the IT managers of individ-
ual municipalities. Six municipalities were selected, such that they had a large
variation in e-scores with approximately the same population. Three of these
municipalities had recently merged their IT service functions, while the strate-
gic decisions about e-government were still taken locally. Both the IT-manager
of the largest of the three municipalities and the manager of the merged IT
service were interviewed. The interviewees were also asked to comment on
L. S. Flak, D. H. Olsen & P. Wolcott • 53
the results from the MeGAP-3 assessment based on their own intuitive under-
standing of which municipalities were ahead of which in online service deliv-
ery, thus providing a reality check on the assessment.
3 Results
This section presents the result of the e-government assessments and the inter-
views. First, we present a comparison of e-scores, then the frequencies of
functions among municipalities and an overview of interactivity functions that
have been implemented. Finally, we present findings from interviews with key
information technology managers.
3.1 E-Score Comparisons
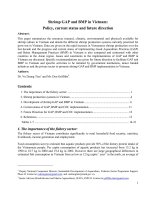
Figure 1 shows a comparison of e-scores of the 15 Vest-Agder and 15 Aust-
Agder municipalities. The figure uses a logarithmic scale along the X-axis to
reflect population, which ranges from 848 (Bykle in Aust-Agder) to 74,590
(Kristisansand in Vest-Agder) (Statistical Yearbook 2003). The average e-
score for Vest-Agder municipalities is 32.1; for Aust-Agder, 37.5. A T-test
indicates that we cannot claim a statistical difference between the mean e-
scores of the two counties (t(28)=.59, p=.56). Municipalities received an e-
score of 0 if they had no web site at all (two municipalities) or had a single
web page indicating that the web site was currently under construction or
closed for renovation (two municipalities).
Figure 1 reveals a number of important points. While e-scores of Agder
municipalities are linearly correlated with population at a.05 confidence level
(F(1,28) = 7.23 p=.012), population explains only a small amount of e-score
variance (R
2
=.21). It is not necessarily the case that the most populous munic-
ipalities, and presumably those with the largest IT expenditures or the greatest
need to offer services and functions to large and diverse populations, have the
most extensive e-government solutions, as measured by this instrument.
Municipalities with fewer than 1000 inhabitants, such as Bykle and Åseral,
have e-scores comparable to municipalities an order of magnitude more popu-
lous. At the same time, municipalities with similar population-such as Tvedes-
trand, Kvinesdal, and Farsund-have very different e-scores. Clearly, the
principal explanation for differences in e-scores does not lie in population fig-
ures. We should note that on an international scale, the population sizes of
Agder municipalities are all clustered towards the small end of the scale. The
54 • L. S. Flak, D. H. Olsen & P. Wolcott
most populous municipality in our study, Kristiansand, has only 75,000 inhab-
itants. Studies of population and e-scores that include larger municipalities
may yield different results.
The four MeGAP performance dimension categories (information dissemi-
nation, interactive functions, e-commerce, and e-democracy) reflect a progres-
sion of citizen engagement with the government. Table 1 shows that in
comparison with the proportion of e-score points allocated to each category in
MeGAP-3, the Agder municipalities obtain disproportionately many points in
the interactive functions category, and disproportionately few in the e-com-
merce and e-democracy categories. The Agder municipalities, on average,
emphasize less sophisticated levels of citizen engagement through e-govern-
ment services. Since we are using MeGAP-3 as a first step towards a more
comprehensive framework, we refrain from drawing firmer conclusions. In
particular, we have not taken into account the relative importance of the func-
tions to the citizens. However, the low relative average scores indicate that
much of the potential of e-government has not been tapped.
0
10
20
30
40
50
60
70
80
90
100 1000 10000 100000
Population
eScore
Aust-Agder Vest-Agder
Arendal
Grimstad
Lillesand
Risør
Tvedestrand
Froland
Birkenes
Evje og Hornnes
Gjerstad
Vegårshei
Åmli
Valle
Bygland
Iveland
Bykle
Kristiansand
Mandal
Vennesla
Lyngdal
Åseral
Søgne
Flekkefjord
Hægebostad
Kvinesdal
Audnedal
Lindesnes
Songdalen
Farsund
Marnardal
Sirdal
Figure 1. E-Scores of Agder Municipalities (April 2004)
L. S. Flak, D. H. Olsen & P. Wolcott • 55
The data also show some limitations of the e-score as a means of compar-
ing municipalities. Table 2 compares the municipalities having the ten highest
e-scores. The e-score measures both depth and breadth of services, but com-
bines these measures in a way that makes it impossible to distinguish between
those municipalities that have chosen to emphasize breadth vs. those that
emphasize depth. The top two municipalities, Tvedestrand and Kristiansand,
illustrate these two approaches. While both municipalities have comparable e-
scores, Kristiansand has a third more functions scoring 3 or 4 than Tvedes-
trand. On the other hand, Tvedestrand has a third more functions scoring 1 or
2 than Kristiansand. Kristiansand has chosen to emphasize depth of function-
ality; Tvedestrand, breadth. Consequently, the function scores for Tvedestrand
lie closer to the mean, yielding a lower coefficient of variance (114%) than for
Kristiansand (127%).
Figure 1 yields insights of more local interest. Nearly all municipalities
have made non-trivial efforts to offer web-based information, services, and
functions to their inhabitants. Only six municipalities did not have some form
of functional web site. Of these, three were undertaking major web site devel-
opment or renovation efforts at the time of evaluation, and we will soon see
major increases in their e-scores. That 90% of the municipalities have, or will
shortly have, a substantial web presence is consistent with Norway’s high
ranking in many IT-readiness assessments (ITU Development Report 2003).
The two Agder regions, Aust-Agder and Vest-Agder, enjoy a friendly
rivalry. Together, they constitute most of Southern Norway (called Soerlandet)
and share a great deal of culture, history, and common interests. Currently,
Info. dissemi
nation
Interactive
functions
E-
Commerce
E-
Democracy
Evaluativ
e-criteria
Total
Average
(East-
Agder)
12.9 (29%) 24.1 (55%) 3.1 (7%) 3.8 (9%) 1.8 (4%) 43.9
Average
(West-
Agder)
13.5 (32%) 20.8 (49%) 3.9 (9%) 4.0 (9%) 1.8 (4%) 42.2
Average
(Total)
13.2 (31%) 22.5 (52%) 3.5 (8%) 3.9 (9%) 1.8 (4%) 43.1
MeGAP-3
(max score
possible)
84 (30%) 112 (40%) 32 (11%) 44 (16%) 9 (3%) 281.0
Table 1: Portion of e-score Contributed by Each Function Category
56 • L. S. Flak, D. H. Olsen & P. Wolcott
there are ongoing initiatives to merge the two regions into one and a merger is
possible in the not too distant future. At the same time, each region contains
both coastal and mountain municipalities, large and small, rich and poor. A
small difference exists in average e-scores of the two regions, with Aust-
Agder enjoying a small (37.4 vs. 32.1) edge over Vest-Agder. However, Fig-
ure 1 shows that the two regions are, on the whole, very comparable. Each has
municipalities across the e-score spectrum in each size category.
But what do the e-scores tell us about the overall level of sophistication of
municipal e-government solutions? How advanced are these web sites? Which
functions are widespread? Which are rare? To what extent have the municipal-
ities embraced solutions that fall into the e-commerce or e-democracy catego-
ries? We can begin to answer these questions by examining the frequency with
which individual functions are supported on municipalities’ web sites and the
categories within which these functions fall.
3.2 Function Frequency Among Municipalities
Tables 3-6 list the MeGAP-3 functions and the number of municipalities sup-
porting that function. The percentage figures reflect a percentage of the maxi-
mum value for the columns (15 for each of the two counties and 30 for the
Municipality e-score
Number of functions
with a score of
Mean St. Dev
Coefficient of
Varia nce
012 34
Tvedestrand
80
35 2 19 8 4 1.18 1.34 114%
Kristiansand
76
38 5 9 11 5 1.12 1.42 127%
Vennesla
58
44 4 10 6 4 0.85 1.30 152%
Arendal
56
44 3 14 3 4 0.82 1.25 151%
Risoer
56
42 7 11 5 3 0.82 1.21 147%
Lillesand
54
43 9 7 5 4 0.79 1.24 156%
Lyngdal
54
47 3 5 11 2 0.79 1.29 162%
Mandal
53
48 4 3 9 4 0.78 1.34 171%
Iveland
52
45 4 12 4 3 0.76 1.20 157%
Aaseral
51
46 3 10 8 1 0.75 1.18 157%
Table 2: Breakdown of Top-10 Agder e-scores
L. S. Flak, D. H. Olsen & P. Wolcott • 57
total). Table 3 lists the most widespread MeGAP-3 functions, those that are
supported by at least half of the municipalities’ web sites.
Of the 12 functions listed in table 3, six fall in the interactive functions cat-
egory, five fall in the information dissemination category, one falls in the e-
commerce category, and none falls in the e-democracy category. In other
words, the most common functions concentrate on informing the populace and
enabling inhabitants at least to begin some interaction with the municipality.
Not surprisingly, the three most common functions reflect the three princi-
pal areas of municipality responsibility: services provided to inhabitants (all
active web sites include at least a description of the range of services provided
to the community), public schools, and public healthcare. The high frequency
of functions related to building permits similarly reflects a major area of
municipality responsibility and a common area of interaction between inhabit-
ants and authorities.
Table 4 lists functions found on the web sites of 15-50% of municipalities.
These moderately common MeGAP-3 functions are, like the most common,
dominated by information dissemination and interactive functions. Of the 19
functions listed, only two are from the e-commerce category and only one is
Function Function Category
Aust-Agder
county
Vest -Agder
county
Total
county
N%N%N%
Community services Interactive functions 13 87% 12 80% 25 83%
Education Info.dissemination 13 87% 12 80% 25 83%
Public health Interactive functions 12 80% 11 73% 23 77%
Job applications Interactive functions 12 80% 9 60% 21 70%
Demographic information Info. dissemination 10 67% 10 67% 20 67%
Down load able forms Interactive functions 11 73% 9 60% 20 67%
Minutes of meetings Info. dissemination 11 73% 8 53% 19 63%
Building permit process Interactive functions 11 73% 7 47% 18 60%
Building permit fees E-Commerce 11 73% 6 40% 17 57%
Search engine Interactive functions 10 67% 7 47% 17 57%
Searchable directory Info. dissemination 11 73% 5 33% 16 53%
Strategic plan Info. dissemination 9 60% 6 40% 15 50%
Table 3: Most common MeGAP-3 functions in Agder
58 • L. S. Flak, D. H. Olsen & P. Wolcott
from the e-democracy category. Conversation forums, found on 20% of Agder
municipal web sites, are the most common example of an e-democracy func-
tion, as defined by MeGAP-3.
Table 4 offers other potentially noteworthy items. The document manage-
ment systems function, found on nearly half (13) of Agder municipal web
sites, is, in most cases, the web manifestation of case document management
software. While municipalities differ in the degree to which they have imple-
Function Function Category
Aust-Agder
county
Vest-Agder
county
Total
county
N % N%N%
Solid waste Info. dissemination 8 53% 6 40% 14 47%
Document management
system
Interactive functions 7 47% 6 40% 13 43%
On-line GIS Interactive functions 8 53% 4 27% 12 40%
Facility reservation Interactive functions 6 40% 4 27% 10 33%
Recycling Info. dissemination 5 33% 5 33% 10 33%
Schedules (hours) Info. dissemination 3 20% 7 47% 10 33%
Info for businesses Interactive functions 6 40% 3 20% 9 30%
Parking permit Interactive functions 4 27% 5 33% 9 30%
Property taxes lookup/
payment
E-Commerce 5 33% 4 27% 9 30%
Business license Interactive functions 4 27% 4 27% 8 27%
Economic development Interactive functions 5 33% 3 20% 8 27%
Transportation Info. dissemination 5 33% 3 20% 8 27%
Housing Interactive functions 5 33% 2 13% 7 23%
Zoning lookup Interactive functions 4 27% 3 20% 7 23%
Conversation forums E-Democracy 4 27% 2 13% 6 20%
Plat maps Info. dissemination 1 7% 5 33% 6 20%
Street vendor license Interactive functions 4 27% 2 13% 6 20%
Action requests
(Complaints)
Interactive functions 3 20% 2 13% 5 17%
Table 4: Moderately Common MeGAP-3 Functions in Agder
L. S. Flak, D. H. Olsen & P. Wolcott • 59
mented dynamic links between their web sites and their back-end systems, all
are required by law to use computer-based systems for managing the formal
case documents used to track issues, discussion, and decisions made by the
authorities. Supporting inhabitants’ ability to monitor and track case docu-
ments relevant to their own lives (e.g., a community decision on a new high-
way or their appeal for an exemption from a zoning regulation) can be a very
powerful feature of municipal web sites. Our expectation is that the number of
municipalities supporting this function in highly interactive and dynamic ways
will grow quickly in the coming years.
Nearly half (12) of the web sites support some kind of on-line geographic
information system (GIS) functionality. Even some of the smallest municipal-
ities such as Iveland (population 1131), employ GIS on their web site. Clearly,
small municipalities are unlikely to have the wherewithal to implement their
own GIS systems. Instead, many municipalities have joined together with
other municipalities in their area to implement a GIS solution jointly. Employ-
ing commercial GIS software and using state cartographic data as a founda-
tion, they have implemented a single web site, linked to from individual
municipality sites, in which geographic data from the region is displayed. Via
menu options, users are able to view individual municipality data. GIS sys-
tems are one example of inter-municipality cooperation in IT, a strong trend in
the Agder region.
Also noteworthy in table 4 is the fact that less than one-third (9) of munici-
palities have explicit support for, or development of, commercial business.
Why so few municipalities use their web sites as a mechanism for encouraging
economic activity is a complicated question that requires further investigation.
Table 5 lists functions found on few (1-15%) of Agder municipal web sites.
The bulk of e-commerce (4) and e-democracy (3) functions implemented at all
fall in this table. Again, information dissemination and interactive functions
predominate.
The low frequency of many of these functions can be explained in a
number of ways. Some functions are of little practical value for Agder munic-
ipalities that are small, e.g. live traffic/web cams and virtual city tour. Other
functions are not as clearly municipality responsibility in Norway as they are
in the United States, e.g. voter registration and utilities payment. Most pay-
ments in Norway take place through account-to-account funds transfers rather
than via credit-cards or checks. The account-to-account transfers are executed
via on-line banking systems or at bank branch offices. As a result, there is lit-
tle need for municipalities to support their own on-line payment infrastructure.
For other functions, e.g. budget reports, bidder applications, or city charter,
60 • L. S. Flak, D. H. Olsen & P. Wolcott
there is no obvious reason for the low frequency other than that these func-
tions are not perceived as important for a municipality web site.
Function Function Category
Aust-Agder
county
Vest -A gd er
county
Total
county
N%N%N%
Budget report Info.dissemination 3 20% 1 7% 4 13%
Comprehensive planning
process
Interactive functions 3 20% 1 7% 4 13%
Emergency management Info. dissemination 4 27% 0 0% 4 13%
Live traffic/web cams Info. dissemination 1 7% 3 20% 4 13%
Directions to offices/
facilities
Info.dissemination 0 0% 3 20% 3 10%
Utilities Payment E-Commerce 1 7% 2 13% 3 10%
Bidder applications Interactive functions 1 7% 1 7% 2 7%
City charter Info. dissemination 1 7% 1 7% 2 7%
City code Info. dissemination 1 7% 1 7% 2 7%
Fines E-Commerce 0 0% 2 13% 2 7%
Information requests E-Commerce 0 0% 2 13% 2 7%
Recreation/class
registration
Interactive functions 1 7% 1 7% 2 7%
User customization E-Democracy 2 13% 0 0% 2 7%
Volunteer opportunities E-Democracy 1 7% 1 7% 2 7%
AS-Built images Info. dissemination 1 7% 0 0% 1 3%
Bids on-line Interactive functions 0 0% 1 7% 1 3%
Info for employees Info. dissemination 1 7% 0 0% 1 3%
Pet Interactive functions 0 0% 1 7% 1 3%
Scheduled e-meetings E-Democracy 0 0% 1 7% 1 3%
Utility start/stop E-Commerce 0 0% 1 7% 1 3%
Virtual city tour Info. dissemination 1 7% 0 0% 1 3%
Voter registration Interactive functions 0 0% 1 7% 1 3%
Table 5: Uncommon MeGAP-3 Functions in Agder
L. S. Flak, D. H. Olsen & P. Wolcott • 61
A considerable number of MeGAP-3 functions have been implemented by
no Agder municipality at all. These are listed in table 6.
In contrast to tables 3-5, e-democracy functions dominate in table 6. The
implications of this fact will be taken up in the discussion section.
3.3 Interactivity of Function Implementations
For each municipality, the MeGAP-3 functions are scored on a scale of 1-4
reflecting varying degrees of interactivity supported by the web site. While
Tables 3-6 tell us how many municipalities have some implementation of a
particular function (perhaps just a brief mention on the web site), they do not
indicate the sophistication or depth of interactivity of this implementation.
Which functions have been implemented in a relatively sophisticated, interac-
tive form and how widespread are such implementations?
Table 7 lists the functions for which at least one municipality was scored at
level 4. For each such function, the number of municipalities scoring 4 is
shown. A score of 4 indicates that the function’s implementation supports
strong, or two-way, interactivity, in which the system responds in a dynamic
Function Function Category
Bike permit/info Interactive functions
Code enforcement E-Commerce
Food inspection & safety Interactive functions
Listservs E-Democracy
Neighborhood specific Info E-Democracy
On-line surveys/polls E-Democracy
Participation opportunities E-Democracy
Real-time traffic info Info. dissemination
Road closure/detour Info. dissemination
Streaming audio of meetings E-Democracy
Streaming video of city Council Meetings
E-Democracy
Taxi license Interactive functions
Temporary use permit Interactive functions
Visualization/consultation technologies E-Democracy
Vital records Interactive functions
Table 6: MeGAP-3 Functions Not Found in Agder
62 • L. S. Flak, D. H. Olsen & P. Wolcott
way to user input, such as by executing a transaction or dynamically generat-
ing output in light of the users input.
Table 7 shows that only nine of the 68 MeGAP-3 functions have been
implemented in Agder at a level 4. Of these, only two have been implemented
by more than 17% of the municipalities; and neither of these two, search
engines or online GIS, reflects sophisticated, home-grown functionality. Such
functionality is provided by scripts or software packages purchased from third
parties. Only 10% of the municipalities have implemented strong, interactive
support for e-democracy functions, with conversation forums being the princi-
pal example. Only one municipality, Lillesand, had at the time of investigation
implemented a user-customizable web site on which users could log in and see
items of direct interest to them, such as their own applications, or documents
related to cases relevant to them.
In short, while over half (17) of the Agder municipalities have at least one
example of support for strong, two-way interactivity on their web site, such
functionality is not routine or commonplace.
Not surprisingly, many more municipalities have implemented support for
weaker, one-way interactivity. By far the most common way to achieve a score
of 3 for a function is by supplying forms on the web site that can be down-
loaded by the user and submitted later by post or e-mail.
Table 8 lists the 22 functions for which at least one municipality was
scored at level 3, reflecting one-way interaction. The most common MeGAP-3
function listed here, downloadable forms, is supported by 19 municipalities
indicating that fully a third of Agder municipalities do not support even this
easy-to-implement function. The next most frequent functions—education,
Function Category Function Number of Municipalities
N%
Interactive functions Search engine 16 53%
Interactive functions Online GIS 8 27%
Interactive functions Zoning lookup 5 17%
Info. dissemination Searchable directory 5 17%
E-Democracy Conversation forums 3 10%
Interactive functions Action requests (complaints) 2 7%
Info. dissemination Plat maps 2 7%
E-Commerce Property taxes lookup/payment 1 3%
E-Democracy User customization 1 3%
Table 7: Number of municipalities rated at level 4 on individual functions
L. S. Flak, D. H. Olsen & P. Wolcott • 63
community services, and building permits—are all areas of strong municipal
responsibility and activity.
Only two e-commerce functions and no e-democracy functions are supported
at level 3. Overwhelmingly, Agder municipalities emphasize the dissemina-
tion of information and support for basic, document-based interaction (appli-
Function Category Function Number of Municipalities
N%
Interactive functions Downloadable forms 19 63%
Info. dissemination Education 16 53%
Interactive functions Community services 11 37%
Interactive functions Building permit process 10 33%
Interactive functions Job applications 8 27%
Interactive functions Public health 6 20%
Info. dissemination Minutes of meetings 5 17%
Interactive functions Business license 4 13%
Info. dissemination Strategic plan 4 13%
Interactive functions Action requests (complaints) 3 20%
Interactive functions Document management system 3 20%
Interactive functions Facility reservation 3 20%
Interactive functions Parking permit 3 20%
Interactive functions Street vendor license 2 13%
Info. dissemination Solid waste 2 13%
Info. dissemination Transportation 2 13%
Interactive functions Housing 1 7%
Interactive functions
Recreation/class
registration
17%
Info. dissemination City Code 1 7%
Info. dissemination Live traffic/web cams 1 7%
E-Commerce Property taxes lookup/payment 1 7%
E-Commerce Utility start/stop 1 7%
Table 8: Number of municipalities rated at level 3 on individual functions
64 • L. S. Flak, D. H. Olsen & P. Wolcott
cations and reporting in particular) over more complex e-commerce and e-
democracy functions.
3.4 Motivation and Driving Factors of E-
Government Development
To understand the development of Agder e-government solutions and explore
reasons for differences between municipalities, we interviewed IT managers
from six municipalities, of which three (M3-M5) shared a common IT-staff.
The portion of the municipalities’ e-score contributed by each of the four main
function categories is shown in table 9. Because the evaluative criteria scores
have been left out of the table, the category scores shown here do not sum to
exactly the e-score shown in figure 1, in part to avoid identifying the munici-
palities specifically. A key observation in this table is that the municipality
with the highest e-score (M6) is not the municipality with the highest score in
the more sophisticated e-commerce (M1) or e-democracy (M2) categories. M6
earned its high e-score through extensive provision of information dissemina-
tion and interactive function categories, not through unusually high levels of
e-commerce or e-democracy functions.
Key motivations and driving factors identified during these interviews are
presented in Table 10. Within this group, we were particularly interested in
Municipality Info. Dissemination Interactive Functions E-Commerce E-Democracy
M1 26 34 10 6
M2 15 27 4 8
M3 10 19 4 0
M4 15 41 0 0
M5 11 10 2 0
M6 25 47 6 2
Average
(Aust-
Agder)
12.9 24.1 3.1 3.8
Average
(Vest-
Agder)
13.5 20.8 3.9 4
Table 9: Portion of e-score Contributed by Each Function Category
L. S. Flak, D. H. Olsen & P. Wolcott • 65
any factors distinguishing M6, which had the highest e-score, from the others,
which had varying, but lower, e-scores. M3-M5 was covered by a single
respondant, the manager of a standalone company providing IT-service to 3
municipalities. These municipalities had recently merged their IT-functions
resulting in this new company.
We found evidence supporting two distinct motivations for developing e-
government among the interviewed municipalities. In the municipality (M6)
with the highest e-score among the selected municipalities, the interviewee
specified citizen utility as the dominant motivation. For the other five munici-
palities (M1-M5), the interviewees specified efficiency and cost concerns as
the dominant motivation. Very little focus had been on citizen utility. One of
the CIOs (Chief Information Officer) put it this way: I knew what I wanted:
replicate data internally to the Net and remove double registration.
Another difference between municipality M6 and the others was that M6
had implemented a commercially available web portal system while the others
either built the web sites themselves or hired a web development firm to do so.
The CIO had for several years had good communication with a sales agent
from the systems provider. This had developed the CIO’s awareness about the
range of possible functions, which led to the implementation of many citizen-
centric functions. This system was, however, not well integrated with back-
office applications. The other five municipalities, M1-M5, prioritized the inte-
gration between back-office systems and the e-government front-end systems
in their development strategies. This was done primarily for a select few func-
tions that would yield the highest efficiency rewards. These five municipali-
ties had implemented important systems integration that does not show up
directly in the e-score, but this will unquestionably be a foundation for the
implementation of further functionality. In this respect these municipalities
may have more sophisticated e-government systems than the e-scores show.
According to respondent M6, there are approximately 50 sector applications
running in an average municipality compared to 3-4 in a private company.
This implies a challenge in the integration of the sector applications and the e-
government front end.
Another factor that appears to play a significant role is joint IT efforts
among municipalities. There is widespread informal cooperation on IT strat-
egy between municipalities in the two Agder counties. The largest two munic-
ipalities launched their e-government projects independently, while the
remaining municipalities in the two counties were involved in some kind of
cooperation on e-government. For example one inter-municipal cooperation
project, DDD (Det Digitale Distriktsagder—The Digital Agder District),
involves 18 rural municipalities and the two counties. DDD has been sup-