ATOMIC ABSORPTION SPECTROSCOPY doc
Bạn đang xem bản rút gọn của tài liệu. Xem và tải ngay bản đầy đủ của tài liệu tại đây (11.87 MB, 270 trang )
ATOMIC ABSORPTION
SPECTROSCOPY
Edited by Muhammad Akhyar Farrukh
Atomic Absorption Spectroscopy
Edited by Muhammad Akhyar Farrukh
Published by InTech
Janeza Trdine 9, 51000 Rijeka, Croatia
Copyright © 2011 InTech
All chapters are Open Access distributed under the Creative Commons Attribution 3.0
license, which allows users to download, copy and build upon published articles even for
commercial purposes, as long as the author and publisher are properly credited, which
ensures maximum dissemination and a wider impact of our publications. After this work
has been published by InTech, authors have the right to republish it, in whole or part, in
any publication of which they are the author, and to make other personal use of the
work. Any republication, referencing or personal use of the work must explicitly identify
the original source.
As for readers, this license allows users to download, copy and build upon published
chapters even for commercial purposes, as long as the author and publisher are properly
credited, which ensures maximum dissemination and a wider impact of our publications.
Notice
Statements and opinions expressed in the chapters are these of the individual contributors
and not necessarily those of the editors or publisher. No responsibility is accepted for the
accuracy of information contained in the published chapters. The publisher assumes no
responsibility for any damage or injury to persons or property arising out of the use of any
materials, instructions, methods or ideas contained in the book.
Publishing Process Manager Anja Filipovic
Technical Editor Teodora Smiljanic
Cover Designer InTech Design Team
Image Copyright kjpargeter, 2011. DepositPhotos
First published January, 2012
Printed in Croatia
A free online edition of this book is available at www.intechopen.com
Additional hard copies can be obtained from
Atomic Absorption Spectroscopy, Edited by Muhammad Akhyar Farrukh
p. cm.
ISBN 978-953-307-817-5
free online editions of InTech
Books and Journals can be found at
www.intechopen.com
Contents
Preface IX
Chapter 1 Atomic Absorption Spectrometry (AAS) 1
R. García and A. P. Báez
Chapter 2 State-of-the-Art and Trends
in Atomic Absorption Spectrometry 13
Hélcio José Izário Filho, Rodrigo Fernando dos Santos Salazar,
Maria da Rosa Capri, Ângelo Capri Neto, Marco Aurélio Kondracki
de Alcântara and André Luís de Castro Peixoto
Chapter 3 Elemental Profiling: Its Role and Regulations 37
Ajai Prakash Gupta and Suphla Gupta
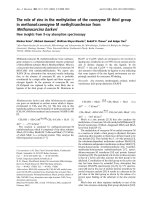
Chapter 4 Microextraction Techniques as a Sample
Preparation Step for Metal Analysis 61
Pourya Biparva and Amir Abbas Matin
Chapter 5 Application of Atomic Absorption for
Determination of Metal Nanoparticles
in Organic-Inorganic Nanocomposites 89
Roozbeh Javad Kalbasi and Neda Mosaddegh
Chapter 6 Flame Spectrometry in Analysis
of Refractory Oxide Single Crystals 105
T.V. Sheina and K.N. Belikov
Chapter 7 Interference Effects of Excess Ca, Ba and
Sr on Mg Absorbance During Flame Atomic
Absorption Spectrometry: Characterization in
Terms of a Simplified Collisional Rate Model 131
Mark F. Zaranyika, Albert T. Chirenje and Courtie Mahamadi
Chapter 8 Nutritional Metals in Foods by AAS 143
Mary Millikan
VI Contents
Chapter 9 Comparative Assessment of the Mineral Content
of a Latin American Raw Sausage Made by
Traditional or Non-Traditional Processes 167
Roberto González-Tenorio, Ana Fernández-Diez,
Irma Caro and Javier Mateo
Chapter 10 Analysis of High Solid Content in
Biological Samples by Flame Atomic
Absorption Spectrometry 183
Lué-Merú Marcó Parra
Chapter 11 Mineral Content and Physicochemical Properties in
Female Rats Bone During Growing Stage 201
Margarita Hernández-Urbiola, Astrid L. Giraldo-Betancur,
Daniel Jimenez-Mendoza, Esther Pérez-Torrero, Isela Rojas–Molina,
María de los Angeles Aguilera-Barreiro, Carolina Muñoz-Torres
and Mario E. Rodríguez-García
Chapter 12 Activation of Bentonite and Talc by Acetic Acid as
a Carbonation Feedstock for Mineral Storage of CO
2
221
Petr Ptáček, Magdaléna Nosková, František Šoukal,
Tomáš Opravil, Jaromír Havlica and Jiří Brandštetr
Preface
Spectroscopy is the study of absorption and emission of electromagnetic radiation due
to the interaction between matter and energy, which depends on the wavelength of the
respective radiation.
Analytical Chemistry is the branch of chemistry that deals with the study of
qualitative, as well as quantitative analysis, of samples. Different spectroscopic
techniques like UV-Visible, Atomic Absorption, Flame Emission, Molecular
Fluorescence, Phosphorescence, Chemiluminescence, Infrared, Nuclear Magnetic
Resonance, Raman, X-Ray, Mass, Electron, Mössbauer are being used for this purpose.
Atomic Absorption Spectroscopy (AAS) is one of the spectroscopic and analytical
techniques, used for the qualitative and quantitative determination of elements
employing the absorption of electromagnetic energy of a particular wavelength,
usually ultraviolet or visible region, by free atoms in the gaseous state. The technique
is being used for the determination of metals in different samples like food, drugs,
nanomaterials, biomaterials, environmental, forensics and industrial wastes.
There is a dire need to provide scholars all over the world with the recent
advancements going on in research using analytical techniques. This book is an effort
of the authors in the field of AAS, covering topics from basic to advanced levels.
The chapters in this book have been organized to keep the sequence in reading. In the
first two chapters, introduction, history and basic principle of AAS have been
described with detail instrumentation of all parts and sample preparation. Chapter 3
deals with elemental profiling, functions, dietary source, biochemistry and potential
toxicity of metals along with comparative techniques used for the analysis. As sample
preparation techniques are the most beneficial for proper analysis, chapter 4 discusses
the microextraction techniques which are characteristics for an ideal sample
preparation. Keeping in view the importance of nanomaterials and refractory
materials, chapter 5 and 6 highlight the ways to characterize these materials by using
AAS. The interference effects between elements can be characterized using a
simplified rate model and through thermodynamic equilibrium approach as explained
in chapter 7. The importance of metals in food and biological samples and their
characterization with AAS have been given in chapters 8-11. Carbon capture and
X Preface
mineral storage, leaching experiments and estimation of metal contents by
comparative techniques have been explained in chapter 12.
The book will provide a good resource for teaching and research purposes.
Muhammad Akhyar Farrukh
Department of Chemistry
G.C. University Lahore
Pakistan
1
Atomic Absorption Spectrometry (AAS)
R. García and A. P. Báez
Centro de Ciencias de la Atmósfera, Universidad Nacional Autónoma de México,
Ciudad Universitaria, Mexico City
Mexico
1. Introduction
Atomic Absorption Spectrometry (AAS) is a technique for measuring quantities of chemical
elements present in environmental samples by measuring the absorbed radiation by the
chemical element of interest. This is done by reading the spectra produced when the sample
is excited by radiation. The atoms absorb ultraviolet or visible light and make transitions to
higher energy levels. Atomic absorption methods measure the amount of energy in the form
of photons of light that are absorbed by the sample. A detector measures the wavelengths of
light transmitted by the sample, and compares them to the wavelengths which originally
passed through the sample. A signal processor then integrates the changes in wavelength
absorbed, which appear in the readout as peaks of energy absorption at discrete
wavelengths. The energy required for an electron to leave an atom is known as ionization
energy and is specific to each chemical element. When an electron moves from one energy
level to another within the atom, a photon is emitted with energy E. Atoms of an element
emit a characteristic spectral line. Every atom has its own distinct pattern of wavelengths at
which it will absorb energy, due to the unique configuration of electrons in its outer shell.
This enables the qualitative analysis of a sample. The concentration is calculated based on
the Beer-Lambert law. Absorbance is directly proportional to the concentration of the
analyte absorbed for the existing set of conditions. The concentration is usually determined
from a calibration curve, obtained using standards of known concentration. However,
applying the Beer-Lambert law directly in AAS is difficult due to: variations in atomization
efficiency from the sample matrix, non-uniformity of concentration and path length of
analyte atoms (in graphite furnace AA).
The chemical methods used are based on matter interactions, i.e. chemical reactions. For a
long period of time these methods were essentially empirical, involving, in most cases, great
experimental skills. In analytical chemistry, AAS is a technique used mostly for determining
the concentration of a particular metal element within a sample. AAS can be used to analyze
the concentration of over 62 different metals in a solution.
Although AAS dates to the nineteenth century, the modern form of this technique was
largely developed during the 1950s by Alan Walsh and a team of Australian chemists
working at the CSIRO (Commonwealth Science and Industry Research Organization)
Division of Chemical Physics in Melbourne, Australia. Typically, the technique makes use of
a flame to atomize the sample, but other atomizers, such as a graphite furnace, are also used.
Three steps are involved in turning a liquid sample into an atomic gas:
Atomic Absorption Spectroscopy
2
1. Desolvation – the liquid solvent is evaporated, and the dry sample remains;
2. Vaporization – the solid sample vaporizes to a gas; and
3. Volatilization – the compounds that compose the sample are broken into free atoms.
To measure how much of a given element is present in a sample, one must first establish a
basis for comparison using known quantities of that element to produce a calibration curve.
To generate this curve, a specific wavelength is selected, and the detector is set to measure
only the energy transmitted at that wavelength. As the concentration of the target atom in
the sample increases, the absorption will also increase proportionally. A series of samples
containing known concentrations of the compound of interest are analyzed, and the
corresponding absorbance, which is the inverse percentage of light transmitted, is recorded.
The measured absorption at each concentration is then plotted, so that a straight line can
then be drawn between the resulting points. From this line, the concentration of the
substance under investigation is extrapolated from the substance’s absorbance. The use of
special light sources and the selection of specific wavelengths allow for the quantitative
determination of individual components in a multielement mixture.
2. Basic principle
The selectivity in AAS is very important, since each element has a different set of energy
levels and gives rise to very narrow absorption lines. Hence, the selection of the
monochromator is vital to obtain a linear calibration curve (Beers' Law), the bandwidth of
the absorbing species must be broader than that of the light source; which is difficult to
achieve with ordinary monochromators. The monochromator is a very important part of an
AA spectrometer because it is used to separate the thousands of lines generated by all of the
elements in a sample.
Without a good monochromator, detection limits are severely compromised. A
monochromator is used to select the specific wavelength of light that is absorbed by the
sample and to exclude other wavelengths. The selection of the specific wavelength of light
allows for the determination of the specific element of interest when it is in the presence of
other elements. The light selected by the monochromator is directed onto a detector,
typically a photomultiplier tube, whose function is to convert the light signal into an
electrical signal proportional to the light intensity. The challenge of requiring the bandwidth
of the absorbing species to be broader than that of the light source is solved with radiation
sources with very narrow lines.
The study of trace metals in wet and dry precipitation has increased in recent decades
because trace metals have adverse environmental and human health effects. Some metals,
such as Pb, Cd and Hg, accumulate in the biosphere and can be toxic to living systems.
Anthropogenic activities have substantially increased trace metal concentrations in the
atmosphere. In addition, acid precipitation promotes the dissolution of many trace metals,
which enhances their bioavailability. In recent decades, heavy metal concentrations have
increased not only in the atmosphere but also in pluvial precipitation. Metals, such as Pb,
Cd, As, and Hg, are known to accumulate in the biosphere and to be dangerous for living
organisms, even at very low levels. Many human activities play a major role in global and
regional trace element budgets. Additionally, when present above certain concentration
levels, trace metals are potentially toxic to marine and terrestrial life. Thus, biogeochemical
perturbations are a matter of crucial interest in science.
The atmospheric input of metals exhibits strong temporal and spatial variability due to short
atmospheric residence times and meteorological factors. As in oceanic chemistry, the impact of
Atomic Absorption Spectrometry (AAS)
3
trace metals in atmospheric deposition cannot be determined from a simple consideration of
global mass balance; rather, accurate data on net air or sea fluxes for specific regions are needed.
Particles in urban areas represent one of the most significant atmospheric pollution problems,
and are responsible for decreased visibility and other effects on public health, particularly
when their aerodynamic diameters are smaller than 10 µm, because these small particles can
penetrate deep into the human respiratory tract. There have been many studies measuring
concentrations of toxic metals such as Ag, As, Cd, Cr, Cu, Hg, Ni, Pb in rainwater and their
deposition into surface waters and on soils. Natural sources of aerosols include terrestrial dust,
marine aerosols, volcanic emissions and forest fires. Anthropogenic particles, on the other
hand, are created by industrial processes, fossil fuel combustion, automobile mufflers, worn
engine parts, and corrosion of metallic parts. The presence of metals in atmospheric particles
are directly associated with health risks of these metals. Anthropogenic sources have
substantially increased trace metal concentrations in atmospheric deposition.
The instrument used for atomic absorption spectrometry can have either of two atomizers.
One attachment is a flame burner, which uses acetylene and air fuels. The second
attachment consists of a graphite furnace that is used for trace metal analysis. Figure 1
depicts a diagram of an atomic absorption spectrometer.
Fig. 1. The spectral, or wavelength, range captures the dispersion of the grating across the
linear array.
Flame and furnace spectroscopy has been used for years for the analysis of metals. Today
these procedures are used more than ever in materials and environmental applications. This
is due to the need for lower detection limits and for trace analysis in a wide range of
samples. Because of the scientific advances of Inductively Coupled Plasma Optical Emission
Atomic Absorption Spectroscopy
4
Spectroscopy (ICP-OES), Inductively Coupled Plasma Mass Spectrometry (ICP-MS), have
left Atomic Absorption (AA) behind. This technique, however, is excellent and has a larger
specificity that ICP does not have. Figure 2 shows a diagram of an atomic absorption
spectrometer with a graphite furnace.
Fig. 2. Flame relatively insensitive - incomplete volatilization, short time in beam (Figure 1)
In this section, the authors will attempt to demonstrate that AAS is a reliable chemical
technique to analyze almost any type of material. The chapter describes the basic principles
of atomic absorption spectroscopy in the analysis of trace metals, such as Ag, As, Cd, Cr, Cu,
Atomic Absorption Spectrometry (AAS)
5
and Hg, in environmental samples. For example, the study of trace metals in wet and dry
precipitation has increased in recent decades because trace metals have adverse
environmental and human health effects. Anthropogenic activities have substantially
increased trace metal concentrations in the atmosphere. In recent decades, heavy metal
concentrations have increased not only in the atmosphere but also in pluvial precipitation.
Many human activities play a major role in global and regional trace element budgets.
Additionally, when present above certain concentration levels, trace metals are potentially
toxic to marine and terrestrial life. Thus, biogeochemical perturbations are a matter of
crucial interest in science.
The atmospheric input of metals exhibits strong temporal and spatial variability due to short
atmospheric residence times and meteorological factors. As in oceanic chemistry, the impact
of trace metals in atmospheric deposition cannot be determined from a simple consideration
of global mass balance; rather, accurate data on net air or sea fluxes for specific regions are
needed.
Particles in urban areas represent one of the most significant atmospheric pollution
problems, and are responsible for decreased visibility and other effects on public health,
particularly when their aerodynamic diameters are smaller than 10 µm, because these small
particles can penetrate deep into the human respiratory tract. There have been many studies
measuring concentrations of toxic metals such as Ag, As, Cd, Cr, Cu, Hg, Ni, Pb in rainwater
and their deposition into surface waters and on soils. Natural sources of aerosols include
terrestrial dust, marine aerosols, volcanic emissions and forest fires. Anthropogenic
particles, on the other hand, are created by industrial processes, fossil fuel combustion,
automobile mufflers, worn engine parts, and corrosion of metallic parts. The presence of
metals in atmospheric particles and the associated health risks of these metals.
Anthropogenic sources have substantially increased trace metal concentrations in
atmospheric deposition. In addition, acid precipitation favors the dissolution of many trace
metals, which enhances their bioavailability. Trace metals from the atmosphere are
deposited by rain, snow and dry fallout
.
The predominant processes of deposition by rain
are rainout and washout (scavenging). Generally, in over 80 % of wet precipitation, heavy
metals are dissolved in rainwater and can thus reach and be taken up by the vegetation
blanket and soils. Light of a specific wavelength, selected appropriately for the element
being analyzed, is given off when the metal is ionized in the flame; the absorption of this
light by the element of interest is proportional to the concentration of that element.
Quantification is achieved by preparing standards of the element.
AAS intrinsically more sensitive than Atomic Emission Spectrometry (AES)
Similar atomization techniques to AES
Addition of radiation source
High temperature for atomization necessary
Flame and electrothermal atomization
Very high temperature for excitation not necessary; generally no plasma/arc/spark in
AAS
3. Flame (AAS)
Flame atomic absorption methods are referred to as direct aspiration determinations. They
are normally completed as single element analyses and are relatively free of interelement
Atomic Absorption Spectroscopy
6
spectral interferences. For some elements, the temperature or type of flame used is critical. If
flame and analytical conditions are not properly used, chemical and ionization interferences
can occur. Different flames can be achieved using different mixtures of gases, depending on
the desired temperature and burning velocity. Some elements can only be converted to
atoms at high temperatures. Even at high temperatures, if excess oxygen is present, some
metals form oxides that do not redissociate into atoms. To inhibit their formation, conditions
of the flame may be modified to achieve a reducing, nonoxidizing flame. Some aspects are
discussed below:
Simplest atomization of gas/solution/solid
Laminar flow burner - stable "sheet" of flame
Flame atomization best for reproducibility (precision) (<1%)
Relatively insensitive – incomplete volatilization, short time in beam
Usually the measurement of metals can be done by an appropriate selection of one of the
methods given below. During the analysis of the data, the interference and background
should be considered. Three pattern-matching methods are most often employed:
using calibration curves generated by a series of patterns, the method of standard
additions and the internal standard method. The use of calibration curves from a series of
patterns is possibly the most widely used method. It involves measuring the sample of
interest in a series of samples of known concentration and all prepared under the same
conditions.
1. Calibration Curve Method: Prepare standard solutions of at least three different
concentrations, measure the absorbance of these standard solutions, and prepare a
calibration curve from the values obtained. Then measure the absorbance of the test
solution adjusted in concentration to a measurable range, and determine the
concentration of the element from the calibration curve.
2. Standard Addition Method: To equal volumes of more than two different test solutions
are used, then the standard solution is added so that the solutions contain stepwise
increasing amounts of the element, and add the solvent to make a definite volume.
Measure the absorbance for each solution, and plot the concentration of the added
standard element on the abscissa and the absorbance on the ordinate. Extend the
calibration curve obtained by linking the plotted points, and determine the
concentration of the element from the distance between the origin and the intersection
of the calibration curve on the abscissa. This method is applicable only in the case that
the calibration curve drawn as directed in (1) above passes through the origin.
3. Internal Standard Method: Prepare several solutions containing a constant amount of the
internal standard element. Using these solutions, measure the absorbance of the standard
element and the absorbance of the internal standard element at the analytical wavelength
of each element under the same measuring conditions, and obtain the ratios of each
absorbance of the standard object element to the absorbance of the internal standard
element. Prepare a calibration curve by plotting the concentrations of the standard
element on the abscissa and the ratios of absorbance on the ordinate. Then prepare the test
solutions, adding the same amount of the internal standard element as in the standard
solution. Proceed under the same conditions as for preparing the calibration curve, obtain
the ratio of the absorbance of the element to that of the internal standard element, and
determine the concentration of the element from the calibration curve.
Atomic Absorption Spectrometry (AAS)
7
The calibration curve is always represented with the response of the instrument on the
vertical (y) and concentrations on the horizontal axis (x). The value of C can limit the
accuracy of the measurements for various concentrations; however there are statistical
methods which can be used. The calibration method is generally used where there is a linear
relationship between the analytical signal (y) and concentration (x), taking precautions to
ensure that linearity in the experimental response is maintained over a wide range of
concentrations. In these cases the way to proceed is to obtain the regression line of y on x (ie,
the best-fit straight line through the points of the calibration graph, which can be obtained,
for example, by the method of least squares) and used to estimate the concentration of
unknown samples by interpolation, as well as to estimate the detection limit of the analytical
procedure.
Atomic absorption spectrometers allow operators to adjust sample temperatures. Some
spectrometers are self-calibrating, position lights automatically, or compensate for stray
light emissions and various types of spectral interference that bias analytical results.
Intrinsically safe (IS) instruments do not release sufficient electrical or thermal energy to
ignite hazardous atmospheric mixtures. In flame AAS, the measured absorbance depends
on the absorptivity of the element in question, the concentration of that element in the
flame (and therefore on its solution concentration), and the optical path length through
the flame. The light from the flame region is collected on the left-side of this particular
instrument. Under certain circumstances, it is desireable to reduce the optical path length.
To this end, the burner head can also be rotated about its vertical axis. Different burner
heads (having different slot sizes) are used for acetylene/air and acetylene/nitrous oxide
flames, since the latter is a much hotter flame. Flow controls also allow both the total gas
flow-rate and fuel-to-oxidant ratio to be varied. Gas flow affects the aspiration rate and
aerosol drop-size distribution, while the fuel-oxidant ratio can influence chemical
processes in the flame that would otherwise reduce the sensitivity of the measurement.
Following you can describe some features of this technique:
Primary combustion zone - initial decomposition, molecular fragments, cool
Interzonal region – hottest, most atomic fragments, used for emission/fluorescence
Secondary combustion zone – cooler, conversion of atoms to stable molecules, oxides
element rapidly oxidizes – largest atom near burner
element oxidizes poorly – largest atom away from burner
most sensitive part of flame for AAS varies with analyte (Figure 3)
The measurement procedure is as follows. A small quantity of the extracted sample is
injected into a flame where the ions are reduced to elements and vaporized. The elements
present in the sample absorb light at specific wavelengths in the visible or the ultraviolet
spectrum. A light beam with a single specific wavelength for the element being measured is
directed through the flame to be detected by a monochrometer.
The light absorbed by the flame containing the extract is compared with the absorption from
known standards to quantify the elemental concentrations. One of the disadvantages of this
method is that only one element can be quantified at a time. AAS requires an individual
analysis for each element, and sometimes a large filter or several filters are needed to obtain
concentrations for a large variety of elements. Samples having high concentrations of
elements beyond the linear range of the instrument should be diluted prior to the analysis.
Báez et al., 2007 and García et al., 2009 characterized atmospheric aerosols, metals and ions
Atomic Absorption Spectroscopy
8
that play an important role in the content of chemical species and of many elements in
atmospheric ecosystem interfaces. Sodium, K
+
, Ca
2+
and Mg
2+
were analyzed with a double
beam atomic absorption spectrophotometer. Deuterium and hollow cathode lamps (Photron
Super lamp) were used for background correction and analysis.
Calibration standards were prepared under a laminar flux hood, using certified standards
for each ion (High-Purity Standards traceable from the National Institute of Standards and
Technology, NIST).
Fig. 3. Spectrometers element rapidly oxidizes - largest atom near burner
A calibration curve was used to determine the unknown concentration of an element in a
solution. The instrument was calibrated using several solutions of known concentrations.
The absorbance of each known solution was measured and then a calibration curve of
concentration vs. absorbance was plotted.
The sample solution was fed into the instrument, and the absorbance of the element in this
solution was measured. The unknown concentration of the element was then calculated
from the calibration curve. The concentration of the analyte element was considered to be
Atomic Absorption Spectrometry (AAS)
9
proportional to the ground state atom population in the flame; any factor that affected the
ground state atom population was classified as interference.
Factors that might affected the ability of the instrument to read this parameter were also
classified as interference.
The different types of interference that were encountered in atomic absorption spectroscopy
were:
- Absorption of source radiation: an element other than the one of interest may absorb
the wavelength being used.
- Ionization interference: the formation of ions rather than atoms causes lower absorption
of radiation. This problem is overcome by adding ionization suppressors.
- Self absorption: atoms of the same kind as those that are absorbing radiation will absorb
more at the center of the line than at the edges, thus resulting in a change of shape and
intensity of the line.
- Background absorption of source radiation: This is caused by the presence of a particle
from incomplete atomization. This problem is overcome by increasing the flame
temperature.
- Rate of aspiration, nebulization, or transport of the sample (e.g. viscosity, surface
tension, vapor pressure , and density) .
4. Atomic Absorption Spectroscopy with graphite furnace (GFAA)
The GFAA and flame AAS measurement principle is the same. The difference between
these two techniques is the way the sample is introduced into the instrument. In GFAA
analysis, an electrothermal graphite furnace is used instead. The sample is heated
stepwise (up to 3000ºC) to dry. The advantage of the graphite furnace is that the detection
limit is about two orders of magnitude better than that of AAS. The analysis of different
species of a given element is important because different oxidation states of the same
element may present different toxicities and, consequently, different risks. Therefore,
sequential extraction procedures for the separation and further analysis of a species have
been developed for several metals. Sammut et al. (2010) developed a sequential extraction
procedure for separating inorganic species of selenium found in the particulate matter of
emissions in working areas. Essentially, the method is based on sequential dissolutions of
the sampled matrix. Se(IV) and Se(0) can be independently analyzed by GFAA, whereas
only total selenium can be detected when analyzed by AAS. This research group also
proposed the analysis of beryllium species using GFAA and ICP-AES because metallic
beryllium and beryllium oxide in workplaces are associated with different toxicities.
These examples highlight the necessity of improving analytical techniques for measuring
not only the total concentration but also the different species of a metal dispersed in
contaminated air.
The graphite furnace has several advantages over a flame furnance. First it accepts solutions,
slurries, or solid samples. Second, it is a much more efficient atomizer than a flame furnance
and it can directly accept very small absolute quantities of sample. It also provides a
reducing environment for easily oxidized elements. Samples are placed directly into the
graphite furnace and the furnace is electrically heated in several steps to dry the sample, ash
organic matter, and vaporize the analyte atoms. It accommodates smaller samples but it is a
difficult operation, since the high energy that is provided to atomize the sample particles
Atomic Absorption Spectroscopy
10
into ground state atoms might also excite the atomized particles into a higher energy level,
thus lowering the precision.
GFAA has been the most common instrument used for Pb analysis, and in countries where
this element is a criterion for pollution standards, AAS is generally the technique used in the
reference methods to quantify it. Garcia et al., 2008 determined Pb in total suspended
particles in southwest Mexico City, using a nitric acid digestion–based AAS method. An
AAS method was used in conjunction with voltammetry for Pb and Cd analysis to evaluate
a rapid digestion technique using a microwave oven, comparing this with traditional
methods after establishing the optimal efficiency of digestion in terms of power setting, time
and the use of different acids (Senaratne and Shooter, 2004).
For low level determination of volatile elements such as As, Ge, Hg, Sb, and Se, hydride
generation coupled with AAS provides lower detection limits (milligram–microgram range).
The three-step sample preparation for graphite furnaces is as follows:
1. Dry - evaporation of solvents (10–100 s)
2. Ash - removal of volatile hydroxides, sulfates, carbonates (10–100 s)
3. Fire/Atomize - atomization of remaining analyte (1 s)
4.1 Specific sample considerations
GFAA has been used primarily for the analysis of low concentrations of metals in water
samples. GFAA can also be used to determine the concentrations of metals in soil, but
sample preparation for metals in soil is somewhat extensive and may require the use of a
mobile laboratory. The more sophisticated GFAA instruments have a number of lamps and,
therefore, are capable of simultaneous and automatic analyses of more than one element.
Plants: Solid samples must be in liquid form to be aspirated by the instrument.
Therefore, solid material must be liquefied by means of some form of extraction or
digestion protocol. Procedures have been devised that make the total amount of an
element in the sample available for assay or that use some particular properties to
extract the portion of the element that exists in some chemical forms but not in others.
For example, the plant dry ash/double acid extraction method determines the total
element content of the sample.
Soil: For ecological purposes, there is more interest in measuring extractable or labile
soil constituents than in determining total element content. Certain partitions of the
total soil content of a given element are operationally defined by an extraction
procedure, and arguments are usually offered that suggest that such partitions
correspond to different levels of biological availability or activity. The HCl/H2SO4
double acid extraction method, also referred to as North Carolina and Mehlich-1, is
widely used to determine bioavailable Ca, K, Mg, Mn, P, and Zn in sandy acid soils
characteristic of the eastern and southeastern United States.
Water: Aquatic samples, of course, need no liquefaction step, but researchers must still
decide which analyte partition (dissolved, suspended, total) is of interest. Various
treatments for each sample partition are detailed in the U.S. EPA's discussion of the
content partitioning of water samples.
The advantages of using atomic absorption spectroscopy are, in our opinion:
- Greater sensitivity and detection limits than other methods
- Direct analysis of some types of liquid samples
Atomic Absorption Spectrometry (AAS)
11
- Low spectral interference
- Very small sample size
Finally, it is worth mentioning that in the last two decades, quantification and
characterization of different matrices and materials by atomic absorption spectroscopy has
been significant. The development of continuous measurement techniques for certain
chemical species is important for governments, mainly in areas where the epidemiological
studies are still being processed.
Element Mean Min Max
25
th
Percentile
75
th
Percentile
Geometric
Mean
Harmonic
Mean
Std.
Dev.
Al 1536.4 97.65 8939.1 570.04 2027.9 1047.8 691.56 1543.6
Cd 2.64 0.09 8.05 1.06 3.99 1.85 0.99 1.75
Cr 23.79 14.08 44.02 18.24 27.20 22.93 22.11 6.62
Fe 1098.6 27.88 4963.8 263.19 1593.8 623.6 315.00 1102.2
Mn 19.23 2.66 45.18 12.11 25.46 14.32 14.32 9.41
Ni 23.03 8.78 52.93 18.03 26.49 20.77 20.77 7.57
Pb 50.78 8.36 128.07 29.48 68.01 35.94 35.94 28.16
V 16.22 2.15 44.52 8.40 23.41 9.93 9.93 10.02
N=100 (number of samples)
Table 1. Descriptive Statistics: Mean, Minimum (Min), Maximum (Max), 25th and 75th
percentiles, Geometric Mean, Harmonic Mean and Standard deviation (Std. Dev.),
concentrations of metals in PST collected 2003–2004
5. References
A. Báez, R. Belmont, R.M. García, H. Padilla, M.C.Torres. (2007). “Chemical composition of
rainwater collected at a southwest site of Mexico City, Mexico”. Rev. Atmospheric
Research. 86: 61-75.
Atomic Absorption Spectroscopy
12
Sammut, M. L., Noack, Y., Rose, J., Hazemann, J. L., Proux, O., Depoux, M., et al. (2010).
Speciation of Cd and Pb in dust emitted from sinter plant. Chemosphere, 78, 445.
Senaratne I. and Shooter D. (2004). Elemental compositi of brown haze in Auckland, New
Zealand. Atmospheri 3059.
R. García, M. C. Torres and A. Báez. (2008). “Determination of trace elements in total
suspended particles at the Southwest of Mexico City from 2003 to 2004”. Rev.
Chemistry and Ecology. 24(2), pág. 157-167.
R. García, R. Belmont, H. Padilla, M. C. Torres and A. Báez. (2009). “Trace metals and
inorganic ions measurements in rain from Mexico City and a nearby rural area”.
Rev. Chemistry and Ecology. 25(2), pp. 71-86.
2
State-of-the-Art and Trends
in Atomic Absorption Spectrometry
Hélcio José Izário Filho
1
, Rodrigo Fernando dos Santos Salazar
2
,
Maria da Rosa Capri
1
, Ângelo Capri Neto
1
,
Marco Aurélio Kondracki de Alcântara
1
and André Luís de Castro Peixoto
1
1
Universidade de São Paulo,
2
Universidade Federal de São Carlos
Brazil
1. Introduction
Atomic Absorption Spectrometry, or AAS, is an analytical technique commonly used for the
quantitative and qualitative determination of elements in samples such as aqueous
solutions, waters, sea-waters, metals and alloys, glass, drugs, food, environmental samples,
industrial wastes, biological samples among others.
This technique is based on measuring the amount of electromagnetic energy of a particular
wavelength (ultraviolet or visible region), which is absorbed as it passes through a cloud of
atoms of a particular chemical element (the analyte) coming from samples and standards.
An appropriate mathematical treatment allows relating the amount of absorbed energy to
the number of absorbed atoms by providing a measurement of the element concentration in
the sample. This technique is established, relatively quickly, economically affordable and
allows to determine more than 60 chemical elements from a huge type of samples. It is used
by most of research laboratories and industry quality control around the world.
The aim of this text is to present concisely this powerful technique providing basic
information about fundamental concepts, instrumentation and application. Relevant and
effective techniques will be shown including flame atomization, hydride generation, cold
vapor and electrothermic atomization or graphite furnace. Fundamental and theoretical
details will not be presented on mechanical components, electronic, software and data
processing. They are deeply discussed in specific literature.
2. A brief history
Isaac Newton made important discoveries about solar radiation in the 17
th
Century. He used
a glass prism to break up white light into its constituent spectral colors. He studied the
separation of white light in details and, from that discovery, he created the reflecting
telescope, the Newtonian telescope. He, then, published his corpuscular theory of light by
contraposition of Huygens’ undulatory theory.
Two-hundred years after, Wollaston observed dark lines in the solar spectrum known as
Fraunhofer lines, after being extensively studied by this German physicist. In 1832, Brewsler