SELECTED TOPICS ON OPTICAL FIBER TECHNOLOGY_2 potx
Bạn đang xem bản rút gọn của tài liệu. Xem và tải ngay bản đầy đủ của tài liệu tại đây (11.57 MB, 246 trang )
Part 3
New Optical Fibers
15
“Crystalline” Plastic Optical Fiber
with Excellent Heat-Resistant Property
Atsuhiro Fujimori
Saitama University
Japan
1. Introduction
General “polymer crystals” essentially both crystalline and amorphous regions. It is well
known that crystalline polymers construct hierarchical structures ranging from lamellae on
the nanometer scale to spherulite on the mesoscopic scale.
1–3
The polymer crystals in these
crystalline polymers are generally formed by the folding of the main chain. In many cases,
since these folded parts and interspherulite chains form the amorphous region, crystalline
polymers are essentially intermingled states of the crystalline and the amorphous regions.
Therefore, crystalline polymers are not a suitable candidate for use in plastic optical fibers
(POFs) and film-type optical waveguides (FOWs) because of the occurrence of light
refraction at the crystalline/amorphous interface. Consequently, amorphous POFs lack heat
resistance and dimensional stability.
However, if the construction of extremely homogeneous crystalline POFs is realized,
“crystalline” POFs with excellent heat resistance and dimensional stability can be
developed. The heat-resistant POFs will efficiently demonstrate their optical ability in a
circuit exposed to a high temperature of more than 125 °C; so far there have been no
products of heat-resistant POFs that can sustain temperatures higher than 125 °C. If the
heat-resistant POFs are realized, light wiring in automobiles will also be achieved; the heat-
resistant POFs will not only connect the AV equipment but also connect the control system
around the engine. As a result, the overall body of an automobile will become lighter. This
future technology is based mainly on “crystalline fluorinated polymers” having a high
crystallinity. Generally, polytetrafluoroethylene (PTFE; –(CF
2
-CF
2
)
n
–) and its copolymers
easily form rigid helices in order to yield extended-chain crystals. It seems difficult for PTFE
to form a lamellae structure because of its rigid molecular chain.
4–8
In addition, since
tetrafluoroethylene copolymers obtained by the incorporation of several comonomers
exhibit extremely fast crystallization rates,
9
their spherulites generally cannot be observed
until they are sufficiently large. Therefore, PTFE exhibits a high degree of crystallinity of
over 90%.
10–12
Poly[tetrafluoroethylene-co-(perfluoroalkylvinylether)] (abbrev. EFA (alkyl = ethyl) or PFA
(alkyl = propyl))
13
has a unique role in the plastics industry due to its inertness, heat
resistance, and low coefficient of friction in a wide temperature range. Generally,
fluorinated compounds and fluoropolymers have excellent chemical resistance, oil
resistance, and oil- and water-shedding resistance.
14–17
They have been used as rubbers at
high temperatures and in several lubricating fluorine manufactured products.
Selected Topics on Optical Fiber Technology
426
However, in the field of fundamental science, structural studies on fluorinated polymers
have progressed slowly since the time these polymers were first reported by Bunn and
Howells in 1954.
18
We could find very few reports on the systematic structural studies on
PTFE or tetrafluoroethylene-based fluorinated copolymer because this compound is difficult
to synthesize due to the emission of poisonous gases.
4, 6
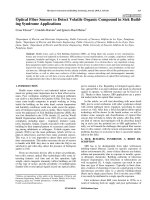
Fig. 1. Changes in transparency of several processed materials of “crystalline” fluorinated
copolymers: (a) bulk EFA, (b) pressed processing sheet, (c) crystalline fiber with drawn ratio
= 3, (d) crystalline fiber with drawn ratio = 5.
Fig. 2. Photograh of crystalline, transparent, and flexible film made by fluorinated
copolymer, and their SAXS and WAXD patterns.
“Crystalline” Plastic Optical Fiberwith Excellent Heat-Resistant Property
427
Further, although EFA is a crystalline polymer, processed EFA samples that have a high
crystallinity are as transparent as amorphous flexible polymers such as
polymethymethacrylate (PMMA)
19
and poly(ethylene terephthalate) (PET), as shown Fig. 1
and Fig. 2. This experimental fact is not well known. Probably, since the transparency of
organic materials depends on the existence of differences in electron density between the
crystalline and the amorphous regions, it is considered that a high crystallinity of EFA
relates closely to the occurrence of transparency. Additionally, processed EFA tubes break
into pieces just like glass tubes when an excessive bending force is applied upon them. It is
obvious that the enhancement of these unique properties of the processed EFA POFs and
FOWs is a result of the changes in the crystal structure and crystalline morphology of EFA
fibers that take place during the drawing process. Further, fluorinated polymers do not
absorb infrared light because of their stretching vibration and a lack of C-H bonds.
20, 21
Hence, a “crystalline” POF and FOW made by fluorinated polymers transports not only
visible light but also infrared light.
In this chapter, the changes in the fine structure and lamella arrangement of the fibers
formed by tetrafluoroethylene copolymers upon drawing are investigated by using wide-
angle X-ray diffraction (WAXD) and small-angle X-ray scattering (SAXS) methods. We have
found very few reports on the studies on the structural changes in fluorinated polymers
upon drawing, whereas there are many reports of studies on hydrogenated polymers.
Therefore, this study may also be valuable as fundamental research in the field of polymer
physics. In addition, we have discussed the relationships between the origins in order to
elucidate the occurrence of transparency and structural changes in molecular arrangements.
2. Experimental
2.1 Materials
2.1.1 Fluorinated copolymer
The fluorinated copolymers used in this study were provided by DuPont-Mitsui
Fluorochemicals Co. Ltd. EFA is a random copolymer obtained from the copolymerization
of tetrafluoroethylene –(CF
2
-CF
2
)
n
– and perfluoroethylvinylether –(CF
2
-CF(OCF
2
CF
3
))
n
–.
The amount of comonomers of these materials was about 3 wt%. The molecular weight of
the EFA processed to a crystalline fiber form was about 600,000. This molecular weight was
examined by a computer simulation on the basis of the viscoelasticity of the fiber in a molten
state because it is difficult to dissolve these polymers in an organic solvent.
2.1.2 Drawing of EFA POFs and FOWs
EFA POFs and FOWs were drawn uniaxially by using a hand-drawing apparatus in an air
oven at 280 C. The surface of the POFs and FOWs specimen was marked at intervals of 2
mm in order to measure the draw ratios. The drawing speed was fixed at 20 mm/min, and
the fiber was annealed at 280 C for 3 min before drawing. Using this method, we obtained
fibers with excellent transparency (Figs. 1(c) and 1(d)).
2.2 Experimental methods
2.2.1 Small-angle X-ray scattering (SAXS)
The crystalline morphology of the drawn EFA copolymers was characterized with a SAXS
instrument (M18XHF, MAC Science Co.) consisting of an 18-kW rotating-anode X-ray
generator with a Cu target (wavelength, = 0.154 nm) operated at 50 kV and 300 mA.
22
This
Selected Topics on Optical Fiber Technology
428
instrument comprised a pyrographite monochromator, pinhole collimation system ( 0.3,
0.3, and 1.1 mm), vacuum chamber for the scattered beam path, and a two-dimensional
imaging plate detector (DIP-220). The sample-to-detector distance was adjusted to 710 mm.
The exposure time for each sample was 30 min. For the SAXS measurements, each sample
(thickness: approximately 0.5 mm) was placed in a sample holder so that its position
remained unchanged. The theoretical detection limit of the SAXS measurement in this study
almost corresponded to the value of q = 0.128 nm
–1
estimated by using the camera distance
(from sample to the imaging plate) in the apparatus. However, the actual detection limit
examined by counting the pixel numbers of enlarged SAXS patterns on the monitor of an
analytical computer was q = 0.170 nm
–1
(dashed line in the profile of Fig. 3). Hence, the
observable maximum value of the long period between the centers of gravities of the
lamellae in this study was 36.9 Å.
2.2.2 Wide-angle X-ray diffraction (WAXD)
In order to obtain the WAXD data for the drawn fibers, an R-axis diffractometer (Rigaku
Co.) was operated at 45 kV and 200 mA to generate CuK radiation ( = 0.1542 nm). WAXD
photographs of the samples were taken at room temperature by using a graphite
monochromator and a 0.3-mm pinhole collimator. Diffraction data were recorded on a
cylindrical imaging plate detector equipped with an interface to a computer system. The
camera length was 127.4 mm, and the exposure time was 600 s.
2.2.3 Estimation of thermal properties and transparency
Thermal analyses were carried out by using a Seiko Instruments model DSC200 differential
scanning calorimeter (DSC). The DSC measurements were performed at a standard scanning
rate of 10.0 °C min
-1
. A sample mass of about 5.00 mg was used for all the DSC
measurements. As usual, the scanning of DSC measurements and the heating and cooling
cycle were repeated twice in order to examine the difference between the peak position and
transition enthalpy in the first and second heating. UV-vis spectra of EFA films were
measured using a UV-vis spectrophotometer (V-650, JASCO).
3. Results and discussion
3.1 Changes in lamellae arrangement of transparent “crystalline” EFA POFs and
FOWs
Figure 3 shows the SAXS pattern and normalized one-dimensional SAXS profiles, where q is
the scattering vector (q = 4sin/; = Bragg angle), of the undrawn transparent crystalline
EFA POWs. A ring-shaped SAXS pattern was observed, which indicated the formation of an
isotropic random lamella texture. In the case of PTFE, the SAXS pattern was obscure, and
the corresponding profile exhibited extremely low intensity because this polymer almost
formed an extended chain and not a lamellae structure.
23
On the contrary, it was found that
the tetrafluoroethylene copolymer formed lamellae structures since the undrawn EFA used
in this study exhibited isotopic SAXS patterns. The long period of the undrawn sample was
estimated to be 27.0 nm. A high-crystallinity EFA sample formed relatively thicker lamellae
than the general hydrogenated crystalline polymers.
On the basis of the results of the SAXS measurements of the undrawn EFA fiber, we
suggested the following lamella model for tetrafluoroethylene copolymers. According to A.
Keller’s suggestion,
1
it was assumed that general crystalline polymers form a regular sharp
“Crystalline” Plastic Optical Fiberwith Excellent Heat-Resistant Property
429
hold. However, the tetrafluoroethylene copolymers used in this study did not form an
arrangement of these adjacent reentries because of the existence of a rigid molecular chain
and a lack of flexibility. It seemed that the folded parts formed in the ether bond-rich region
within the fluorinated main chain. However, so many perfluoroalkylvinylether units could
not have contributed to the formation of the folded parts because the ratio of the absolute
amounts of the comonomers was extremely low. Hence, we proposed a “switch-board type”
lamellae model of these tetrafluoroethylene copolymers, shown in Fig. 4, according to P. J.
Flory’s suggestion.
23, 24
In this case, it was supposed that there existed a relatively large
amorphous region because of the existence of the large long-period structure estimated by
SAXS. From the qualitative estimation of the lamella thickness based on the crystallization
degree obtained from the DSC measurements, the thickness of the crystalline regions of the
EFA lamella form was estimated to vary within a range from 8 to 15 nm (as calculated by
using the fusion enthalpy of as-polymerized PTFE, H
endo
(58.4 J g
-1
), as the standard fusion
enthalpy of EFA, H
endo, 0
).
23
The existence of the thick amorphous layer (over 10 nm) also
supports the validity of our proposed switch-board type lamella model.
Figure 5 shows the SAXS patterns and corresponding lamella arrangement models for DR1
(draw ratio = 1.0, undrawn), DR3, and DR5 transparent crystalline POFs of EFA. A ring-
shaped SAXS pattern was observed for the undrawn DR1 sample (Fig. 5 (a)), while two- or
four-point patterns were observed for the DR3 (Fig. 5 (b)) or DR5 (Fig. 5 (c)) fiber samples.
The former indicated a random lamellar texture (Fig. 5 (a')), and the latter indicated some
lamella structures oriented with respect to the draw direction.
Fig. 3. SAXS pattern and profile of undrawn EFA ‘crystalline’ POF.
Selected Topics on Optical Fiber Technology
430
Fig. 4. Schematic illustrations of “switchboard-type” lamella models of fluorinated
copolymers like an EFA (a) along the c-axis, and (b) in an a-b plane.
Fig. 5. Changes in SAXS patterns and corresponding lamella arrangement models of EFA
transparent ‘crystalline’ POF with drawing; (a), (a’) undrawn, (b), (b’) 3 times, and (c), (c’) 5
times drawing.
“Crystalline” Plastic Optical Fiberwith Excellent Heat-Resistant Property
431
The appearance of the two-point SAXS patterns implied the formation of an arrangement of
lamellae parallel to the draw direction (Fig. 5 (b')). As the fiber was drawn further, the
interlamella and/or intralamella slips probably occurred, forming the small kink bands in
the lamellae. The slip angle of the interlamellae was 45° as calculated by using the position
of the strongest spot in the SAXS picture. In accordance with the changes in lamellae, the
grain boundaries or amorphous parts between two neighboring lamellae were also
distributed regularly towards the draw direction, and they thus resulted in a periodic
change in density in the direction normal to them, which accounted for the four-point
diffraction pattern. That is, with an increase in the elongation of the EFA sample, a
particular kind of layer structure, an alternately tilted lamella arrangement known as the
herringbone, was formed inside the fibers (Fig. 5 (c')). Similar results were obtained in the
case of drawn polyethylene (PE) fibers previously.
25
The long periods or interplanar
spacings were calculated to be 33.9 and 35.3 nm for DR3 and DR5, respectively. These values
were larger than the interplanar spacing of the undrawn sample (27.0 nm). This feature of
the long periods corresponded well with that of PE, polypropylene (PP), and polyester.
25–30
From the viewpoint of enhancing transparency by using the drawing process, EFA fibers
exhibited the elongation of the amorphous region with an increase in density in this region
and indicated a resultant increase in the long period upon drawing.
Figure 6 shows the change in SAXS patterns upon drawing. SAXS patterns remained
essentially unchanged even upon carrying out the drawing process for five times.
However, from the results of the examination of light conductivity in db/km units for
EFA fibers using infrared light (at λ = 850 nm), most superior abilities were confirmed in
the DR5 fibers, and their transmission ability was observed to decrease gradually upon
drawing for over six times. Moreover, the drawn EFA fiber broke when the elongation
equaled almost nine times the original value. Just before breaking, the color of the drawn
EFA fiber became white because of the appearance of many microvoids and/or defects
and the light dispersion caused by these voids and/or defects. In order to estimate the
changes in lamella thickness and differences in electron density upon drawing, plots of
the draw ratio vs. long periods and normalized intensity of SAXS profiles are shown in
Fig. 7. The values of the long period saturated at about DR3, and the normalized intensity
was almost constant from DR4 to DR8. That is, the increase in the lamella thickness
containing an amorphous region stopped at DR3 (about 35 nm). After that, although the
density of the amorphous region increased gradually upon drawing, a partial appearance
of the voids might have occurred simultaneously. As a result, the difference in the overall
density between the crystalline and the amorphous regions in the EFA fiber remained
unchanged for a draw ratio of more than 4.
3.2 WAXD study on crystal structure of tetrafluoroethylene-based polymers
A typical example of the WAXD patterns for the drawn EFA fibers (DR8) is shown in Fig.
8(a). Almost all spots existed on the equator line. Therefore, we have mainly discussed the
WAXD profiles integrated along the equatorial direction in this section. Figure 8(b) shows a
comparison of the WAXD profiles of the unoriented PTFE and the EFA samples. The lack of
an amorphous curve around 2θ = 15° was a peculiarity of the PTFE extended-chain crystal.
A halo curve of the EFA appeared due to the existence of an amorphous region in the
interlamella parts. However, the crystalline peak positions in both profiles were almost the
same since the structure and main-chain arrangement in the crystalline region of EFA
Selected Topics on Optical Fiber Technology
432
Fig. 6. Changes in SAXS patterns of EFA “crystalline” POFs with drawing at a ratio of (a)
1.0, (b) 1.5, (c) 2.0, (d) 3.0, (e) 4.0, (f) 5.0, (g) 6.0, (h) 7.0, and (i) 8.0.
“Crystalline” Plastic Optical Fiberwith Excellent Heat-Resistant Property
433
Fig. 7. Plots of draw ratio vs (a) long periods and (b) normalized intensity estimated by
SAXS measurements of EFA “crystalline” POFs.
comprised repeating tetrafluoroethylene parts. That is, there was no difference between the
structure of the crystalline region of PTFE and that of EFA.
Furthermore, most inner WAXD spots of an EFA fiber (Fig. 8(a); the shadow next to the
beam stopper) existed clearly when 2θ = 9°. These WAXD results included a very important
result with regard to the fluorinated polymer crystal. The peak at around 2θ = 18.0° in the
WAXD profiles of tetrafluoroethylene and its copolymers was assigned to the (100)
reflection in the quasi-hexagonal system according to the literature documented about 50
years ago.
18, 31–33
Moreover, we could not find any reports related to the inner peak around
2θ = 9°. However, in the present WAXD profiles, small peaks at around 2θ = 9° were
confirmed and reproduced well by the high-power measurement using an X-ray
diffractometer with an imaging plate as the detector. Further, in the WAXD profile of the
oriented rod-shaped material processed by isostatic pressing of PTFE, this peak was clearly
enhanced (Fig. 8(c)). In addition, Fig. 9 shows the changes in this peak in the WAXD profiles
of the transparent crystalline EFA fiber upon drawing and the well-reproduced appearance
of this peak in any type of fluorinated copolymers. From the result of Fig. 9(a), it was found
that the intensity of this peak around 2θ = 9.0° increased gradually with an increase in the
draw ratio. Figure 9(b) shows the WAXD profiles of several fluorinated copolymers such as
PTFE, poly[tetrafluoroethylene-co-(hexafluoropropylene)] (FEP), PFA, PFA containing PTFE
Selected Topics on Optical Fiber Technology
434
Fig. 8. (a) WAXD patterns of “crystalline” POFs of EFA at draw ratio = 8. (b) Comparison of
WAXD profiles of EFA to PTFE. (c) WAXD profile of PTFE orientated rod formed by
isostatic extrusion.
particles as nucleators, low molecular weight EFA (250,000), middle molecular weight EFA
(300,000), and high molecular weight EFA (600,000) containing PTFE particles. All WAXD
profiles of fluoropolymers used in this study contained this small peak at almost the same
position. That is, this small peak around 2θ = 9.0° reflected that the genuine crystal structure
of fluorinated polymers was always confirmed in the WAXD profiles of
tetrafluoroetthylene-based polymers. Furthermore, the intensity of this peak increased upon
the formation of an orientated structure due to uniaxial drawing. However, no previous
reports that confirm the presence of these small peaks exist, except for the paper we
published recent year.
22
It appears that the existence of this diffraction peak has been
overlooked for about 50 years. In our previous report, we speculated that the peak at about
2θ = 9° might correspond to the genuine (100) reflection.
23
In the present report, we clearly
assert an interpretation of this peak and the crystal structure and partially modify our
previous interpretation. In our previous work,
23
we suggested that the previously reported
lattice constant needed to be modified and the lengths of the a- and b-axes be doubled. In
addition, the reflection at around 2θ = 18.0° would be attributed to the (200) peak. If this did
“Crystalline” Plastic Optical Fiberwith Excellent Heat-Resistant Property
435
Fig. 9. WAXD patterns of (a) drawn EFA POFs, and (b) several fluorinated polymers in bulk:
(A) PTFE, (B) FEP, (C) PFA, (D) PFA containing PTFE particle as nucleator, (E) low
molecular weight EFA, (F) high molecular weight EFA, (G) EFA containing PTFE particle as
nucleator.
not occur, the reflective indexes of the small peaks at about 2θ = 9° could not be determined.
Figures 10(a) and 10(b) show the reciprocal lattice of PTFE and other perfluorinated
copolymers observed along the c-axis under the suggestion that the parts forming the crystal
region had the same structure for tetrafluoroethylene and tetrafluoroethylene copolymers.
The proposed lattice constant of PTFE
23
corresponded to a = b = 11.08 Å, c = 16.8 Å, α = 90°,
β = 90°, and γ = 119.3° (Fig. 8(b), quasi-hexagonal system) and improved upon the reports
by Bunn, et al., Starkweather Jr., et al., Clark, et al.,
18, 31–33
and other investigation groups
(Fig. 10(a), a = b = 5.54 Å, c = 16.8 Å, α = 90°, β = 90°, and γ = 119.3° (quasi-hexagonal
system)). However, the reciprocal lattice of Fig. 9(b) described a base-centered hexagonal
lattice, whereas a base-centered lattice cannot exist in a group of hexagonal lattices. In
addition, the reason for the appearance of a (100) reflection (peak at 2θ = 9°) weaker than a
Selected Topics on Optical Fiber Technology
436
(200) one (peak at 2θ = 18°) was not clear. Therefore, we reproposed the necessity of
modifying the lattice constant of tetrafluoroethylene and its copolymers in the present work.
We reconsidered the packing mode of fluorinated chains from a hexagonal to an
orthorhombic system, as shown in Figs. 10(c) and 10(d). In the reciprocal lattice in Fig. 10(c),
all WAXD reflection peaks confirmed in this study existed at a point of intersection in
reciprocal lattice and all reflective indexes were decided. In this case, the peaks at 2θ = 9°
and 18° corresponded to the (100) and (110) reflection peaks, respectively. The lattice
constants of this packing system were estimated to be a = 9.58 Å, b = 5.54 Å, and c = 1.69 Å
(α = β = γ = 90°). The hexagonal lattice essentially had the structural analogy of an
orthorhombic one. In addition, the appearance of peaks at 2θ = 9° and 18° was based on a
different plane. Hence, the relation between intensities was not contradictory to an indexing
rule. The three-dimensional packing model of the fluorocarbon chain in the crystalline
region is shown in Fig. 10(d). The validity of our proposed orthorhombic system of the
crystalline fluorinated polymer was also supported by the estimation in a reciprocal lattice
along the meridional direction. Figure 11 shows the possibility for applying an
orthorhombic lattice to an index WAXD reflection spot along the meridional direction of the
drawn EFA fiber at DR5. As mentioned above, we considered the EFA chains as an
orthorhombic packing in the crystal region, and the highest diffraction peak in the profile
was interpreted as a (110) reflection in this lattice in the following discussion.
Fig. 10. Reciprocal lattices of crystalline region for several fluorinated polymers (PTFE, EFA,
and so on) represented by WAXD data: (a) previously reported quasi-hexagonal lattice, (b) a
quasi-hexagonal lattice twice elongated a- and b-axis, (c) our proposed orthorhombic lattice,
and (d) packing model of fluorinated chains in orthorhombic lattice.
“Crystalline” Plastic Optical Fiberwith Excellent Heat-Resistant Property
437
Fig. 11. WAXD patterns and reciprocal lattice in the λb*-λc* plane of crystalline region for
EFA transparent fiber at DR5.
3.3 Fine structure estimation of transparent crystalline EFA POFs and FOWs upon
drawing at subnanometer scales by WAXD
Figure 12 shows the WAXD patterns of the transparent EFA fiber at several drawing ratios.
We can clearly see the gradual enhancement of the WAXD spots along the equator line upon
drawing. From the viewpoint of one-dimensional profiles scanned along the equatorial
direction, the peak intensity of (110), (120), (220), and (420) reflections in the orthorhombic
lattice increased gradually with an increase in draw ratio (Fig. 13(a)). The intensities of (110)
peaks normalized by sample size and thickness almost saturated at DR5, as observed from
the plot of Fig. 13(b) whereas the sizes of crystallite in the fiber estimated by Schereer’s
formula
34
are almost constant value all over the draw ratio. That is, it was considered that
the increase in the crystallinity of the EFA fiber at the subnanometer scale actually reached a
constant value.
In order to evaluate the degree of orientation for the c-axis of the EFA crystallites along the
draw direction, we calculated the orientation function (f) proposed by Hermans and co-
workers
35
using the azimuthal WAXD profiles. The function f was defined as
2
1
(3 cos 1)
2
f
., 0 < f
< 1,
where φ is the angle between the c-axis and the draw direction, and cos
2
φ is obtained
from the (110) and (120) azimuthal profiles by using Wilchinsky’s procedure
36
(Fig. 14(a)).
Figure 14(b) shows the change in the orientation function of the EFA crystallites (fφ) as a
function of the draw ratio, where f
φ
increased with the draw ratio up to DR = 2.5, after
which it reached a saturation value of around 0.8. These findings suggested that the
orientation of an EFA crystallite in the fiber was complete at a draw ratio of 2.5. This value
was almost the same as the draw ratio of the saturation value of a long period estimated by
SAXS. That is, the orientation of the crystallite and the elongation of lamella reached
Selected Topics on Optical Fiber Technology
438
Fig. 12. WAXD patterns of EFA plastic optical fiber at several drawing ratio at room
temparture: (a) undrawn, (b) DR ) 1.5, (c) DR ) 2.0, (d) DR ) 3.0, (e) DR ) 4.0, (f) DR ) 5.0, (g)
DR ) 6.0, (h) DR ) 7.0, (i) DR ) 8.0.
“Crystalline” Plastic Optical Fiberwith Excellent Heat-Resistant Property
439
Fig. 13. (a) WAXD profiles of EFA plastic optical fiber with drawing at room temparture: (A)
undrawn, (B) DR1.5, (C) DR2.0, (D) DR3.0, (E) DR4.0, (F) DR5.0, (G) DR6.0, (H) DR7.0, (I)
DR8.0. (b) Changes in normalized WAXD intensity and crystallite sizes with drawing
estimated by Scherrer’s formula.
constant values almost simultaneously. Then, the quasi-crystallization process by drawing
progressed up to DR5, which was the saturation value of the normalized intensity estimated
on the basis of the WAXD patterns. Judging from the draw ratio of the saturation of the
SAXS intensity, the increase in the electron density of the amorphous region and the partial
Selected Topics on Optical Fiber Technology
440
appearance of voids might be a simultaneous occurrence upon further drawing. The sample
of the crystalline EFA fiber at DR5 was the most transparent and exhibited the highest
conductivity of infrared light among all the drawn fibers used in this study. In conclusion,
the functionality of light transmittance was closely related to the solid-state structure of the
crystalline EFA fiber.
Fig. 14. (a) Schematic representation of Wilchinsky method to estimate orientation
coefficient of crystallite. (b) Plot of drawn ratio vs orientation coefficient of crystallite in EFA
POF.
“Crystalline” Plastic Optical Fiberwith Excellent Heat-Resistant Property
441
Figure 15(a) shows results of DSC measurements of EFA “crystalline” fibers at several
drawn ratios in order to estimate crystallization degree and lamella thickness. Areas of
melting peaks on thermograms related to fusion enthalpy are gradually increased with
drawn ratios. Crystallization degree as calculated by using the fusion enthalpy of as-
polymerized PTFE, ΔH
endo
(58.4 J g
-
1), as the standard fusion enthalpy of EFA, ΔH
endo,0
,
25
are
plotted to drawn ratios of EFA fibers (Figure 15(b)). The linearity of changes in crystallinity
of drawn fiber wellcorresponds to dependency of WAXD (110) intensity on drawing (Figure
12(b)). Further, from the qualitative estimation of the lamella thickness based on the
crystallization degree, the thickness of the crystalline regions of the EFA lamella form was
estimated to vary within a range from 6 to 16 nm (Figure 15(c)). In the case of DR5 fiber with
most superior transmission ability of infrared light, almost 50% crystallinity and 11 nm
lamella thickness are estimated. Therefore, it seems that the enhancement of transmission
ability is not caused by increases of crystallinity, but reducing of differences in density
between crystal and amorphous region. Probably, a high light transmission rate is not
brought about by formation of extreme homogeneous crystalline fiber, but by formation of
like a “fringed micelle-type” lamella arrangement which has an indistinct lamella-interface
based on the enhancement of density for amorphous parts by drawing. In the case over six
times drawing, since transition from amorphous part to crystalline part occurrs in EFA fiber,
the density reduction of amorphous region and increases of differences in density between
crystal and amorphous parts have developed. As a result, it seems that the transmission
ability of infrared light decreases over six times drawing to EFA fibers.
Fig. 15. (a) DSC thermograms of drawn EFA POFs at several ratios (scanning rate, 10 °C
min
-1
). (b) Plot of drawn ratio vs crystallinity of drawn EFA fibers at several ratios. (c) Plot of
lamellar thickness vs crystallinity of drawn EFA fibers at several ratios.
Selected Topics on Optical Fiber Technology
442
Figure 16 shows the schematic illustrations of the hierarchical structures ranging from the
lamellae on the nanometer scale to the crystal structure on the subnanometer scale of a
transparent EFA fiber.
37
We suggested that the crystal structure of the crystalline fluorinated
polymers such as PTFE, EFA, PFA, and so on, form the orthorhombic system. The crystalline
fiber of EFA had a herringbone arrangement in lamella when it was drawn over five times.
Upon further drawing, the density in the amorphous region increased gradually. However,
the overall differences in electron density between the crystalline and the amorphous
regions were almost invariable. Probably, the progression of further transparency and the
ability of light conductivity were brought about by a reduction in the difference in density.
As an ideal type of extremely transparent crystalline fiber, the formation of a fringed
micelle-type lamella arrangement may be desirable because of the low differences in
densities inside the fibers.
Fig. 16. Schematic illustrations of hierarchical structures from lamellae on the nanometer
scale to crystal structure on the subnanometer scale of EFA POF.
Finally, in order to estimate three-dimensional structural formation, SAXS and WAXD
measurements from the several incident direction of piled up crystalline EFA FOWs were
carried out by using annealed DR=3 sample. Figure 17 shows SAXS and WAXD patterns of
EFA FOWs at through, side, and edge direction. At the side-direction, obscure four-point
SAXS pattern with void scattering and WAXD fiber pattern were confirmed. In the case of
edge-direction, SAXS patterns show only void scattering, and WAXD indicate isotropic
Debye ring. From the results of these measurements, schematic illustration of three-
dimensional lamella arrangement was shown in Fig. 18. In this case, according to our
“Crystalline” Plastic Optical Fiberwith Excellent Heat-Resistant Property
443
previous work,
23, 38, 39
“switch-board” type lamella was adopted as structural units. From the
view of through and side direction, two-dimensional stacked lamella arrangement forms the
“herring-bone” arrangement. However, randomly isotropic structure is observed from edge
direction. That is to say, lamella in the drawn EFA films formed uniaxially cylindrical
symmetric arrangement. In the case of using this type EFA film as FOWs, it supposes that
anisotropy of light conductivity direction occur. Along the through and side direction,
visible and infrared light will be efficiently conducted, while edge direction will impede the
transmission of lights. Figure 19 shows quantitative data of the transparency of the undrawn
EFA film and drawn films by using UV-isible spectrometer. Because a ‘‘crystalline’’ FOWs
made by fluorinated polymers efficiently transports infrared light, the λ= 850 nm of
wavelength is adopted in this estimation. The film thickness is normalized by 500 μm. The
transparency of infrared light in this film linearly increases with drawing ratio in both cases
of films with drawing at 200 °C and fixed annealing at 280 °C after drawing. However,
transparency of films treated by fixed annealing method is always inferior to that of films
drawn at 200 °C only. This result is based on the difference of electron density between
crystal and amorphous region. Probably, fixed annealing contributes acceleration of
transition from a part of amorphous region to the crystal region. Crystallization of
amorphous parts brings about formation of lower density amorphous region. As a result,
difference of density between crystal and amorphous region become large and transparency
of films decreases.
Fig. 17. SAXS and WAXD patterns of drawn EFA FOWs (fixed annealing at 280 °C after
drawing at 200 °C) with through, side, and edge direction.
Selected Topics on Optical Fiber Technology
444
Fig. 18. Illustration of stacked lamellar in drawn EFA FOWs (fixed annealing at 280 °C after
drawing at 200 °C).
Drawing
direction
c-axis
b-
axis
a-axis
herring-bone arrangement
herring-bone arrangement
3D
2D
2D
2D
Side
Through
Edge
“Crystalline” Plastic Optical Fiberwith Excellent Heat-Resistant Property
445
Fig. 19. Plots of drawing ratio versus transparency of infrared right (λ = 850 nm) : ■,
undrawn ; •, drawn at 200 °C; ▲, fixed annealing at 280 °C after drawing at 200 °C.
4. Conclusion
The changes in fine structure upon drawing transparent crystalline EFA fibers and films
were investigated by WAXD and SAXS measurements. EFA was crystallized as a lamella
crystal in the POFs and FOWs although the polytetrafluoroethylene homopolymer itself
usually forms extended-chain crystals. EFA exhibited thicker lamellae (thickness: at least 27
nm) as observed by the SAXS measurement. In this type of crystalline fluorinated
copolymers, we considered the formation of a switchboard-type lamellae model according
to Flory’s suggestion. With an increase in the drawing of the fibers and films, four-point
SAXS diagrams developed in the photograph of EFA transparent fibers, which implied that
a particular type of layer structure, the alternately tilted lamella arrangement known as the
herringbone, was formed. Furthermore, it was found that the previously proposed packing
mode of general fluorinated polymers was required to be reconsidered from quasi-
hexagonal to orthorhombic in a reciprocal lattice in order to assign all the reflective indexes
obtained by using high-resolution WAXD measurements. Furthermore, the orientation of
the crystallite and the elongation of lamella of EFA were completed simultaneously in the
drawn fibers. The quasi-crystallization process progressed upon further drawing up to five
times. After that, an increase in the density of the amorphous region and a partial
appearance of voids probably occurred simultaneously. The crystalline EFA fiber at DR5
exhibited excellent transparency and infrared light conductivity. The light transmission
property was related closely to the lamella arrangement, crystal structure, and difference in
the crystalline/amorphous density of crystalline EFA optical fibers and optical waveguide.
5. References
[1] Keller, A., Phil. Mag., 1957, 2, 1171.
[2] Till, P. H., J. Polym. Sci., 1957, 24, 301.
[3] Fischer, E. W., Z. Naturforsch, 1957, 12(a), 753.
[4] Burdon, J.; Tatlow J. C.; “Advances in Fluorine Chemistry,” Vol.1 (eds. M. Stacey, J. C.
Tatlow, A. G. Sharp, Academic Press, New York, 1960), pp.129–165.
Selected Topics on Optical Fiber Technology
446
[5] Patrick, C. R.; Stacey, M.; Tatlow, J. C.; Sharpe, A. G., “Advances in Fluorine Chemistry,”
Vol. 2, Butterworths Publications Ltd., London, 1961, pp.1–34.
[6] “Fluoropolymers 2” in Topics in Applied Chemistry, eds. by Hougham, G., et al. (Kluwer
Acad. / Plenum Pub., New York, 1999).
[7] Symons, N. K. J., J. Polym. Sci., A, 1963, 1, 2843.
[8] Rahl, R. J.; Evanco, M. A.; Frendericks, R. J.; Reimschuessel, A. C., J. Polym. Sci. A-2, 1972,
1, 1337.
[9] Ozawa, T., Bull. Chem. Soc. Jpn., 1984, 57, 952.
[10] Marega, C.; Marigo, A.; Causin, V.; Kapeliouchko, V.; Nicoló, E. D.; Sanguineti, A.,
Macromolecules, 2004, 37, 5630.
[11] Marega, C.; Marigo, A.; Garbuglio, C.; Fichera, A.; Martorana, A.; Zannetti, R.,
Macromol. Chem., 1989, 190, 1425.
[12] Marega, C.; Marigo, A.; Cingano, G.; Zannetti, R.; Paganetto, G., Polymer, 1996, 37(25),
5549.
[13] Lee, J. C.; Namura, S.; Kondo, S.: Abe, A., Polymer, 2001, 42, 8631.
[14] Overney, R. M.; Meyer, E.; Frommer, J.; Brodbeck, D.; Luthi, R.; Howald, L.;
Güntherodt, H. J.; Fujihira, M.; Takano, H.; Gotoh, Y., Nature, 1992, 359 133.
[15] Overney, R. M.; Meyer, E.; Frommer, J.; Güntherodt, H. J., Langmuir, 1994, 10, 1281.
[16] Fujimori, A.; Shibasaki, Y.; Araki, T.; Nakahara, H.,Maclomol. Chem. Phys., 2004, 205, 843.
[17] Fujimori, A.; Araki, T.; Nakahara, H., Chem. Lett., 2000, 898.
[18] Burn, C. W.; Howells, E. R., Nature, 1954, 18, 549.
[19] Koike, Y., Polymer, 1991, 32, 1737.
[20] Koike, Y.; Naritomi, M.; Japan Patent 3719733, US Patent5783636, EU Patent 0710855,
KR Patent, 375581, CN Patent ZL 951903152, TW Patent 090942, 1994.
[21] Ishigure, T.; Kano, M.; Koike, Y., J. Lightw. Technol., 2000, 18, 178.
[22] Nam, P. H.; Ninomiya, N.; Fujimori, A.; Masuko, T.; Polym. Eng. Sci., 2006, 46(6), 703.
[23] Fujimori, A.; Hasegawa, M.; Masuko, T., Polym. Int., 2007, 56, 1281
[24] Flory, P. J., J. Am. Chem. Soc., 1962, 84, 2857.
[25] Tanaka, K.; Seto, T.; Hara, T.; Tajima, Y., Rep. Prog. Polym. Phys. Jpn.
, 1964, 7, 63.
[26] Kaji, K.; Mochizuki, T.; Akiyama, A.; Hosemann, R., J. Mater. Sci., 1978, 13, 972.
[27] Samuels, R. J., J. Macromol. Sci., 1970, 701, 241.
[28] Butler, M. F.; Donald, A.N., J. Appl. Polym. Sci., 1998, 67, 321.
[29] Stribeck, N.; Sapoundjieva, D.; Denchev., Z.; Apostolov, A. A.; Zachmann, H. G.;
Stamm, M.; Fakirov. S.; Macromolecules, 1997, 30, 1339.
[30] Hernández, J. J.; Gracía-Gutiérrez, M. C.; Nogals, A.; Rueda, D. R.; Sanz. A.; Sics, I;
Hsiao, B. S.; Roslaniec, Z.; Broza, G.; Ezquerra, T. A., Polymer, 2007, 48, 3286.
[31] Sperati, C. A., Starkweather, H. W. Jr., Adv. Polym. Sci., 1961, 2, 465.
[32] Burn, C. W., Cobbold, A. J., Palmer, R. P., J. Polym. Sci., 1958, 19, 365.
[33] (a) Clark, E. S. Muus, L. T., Z. Krist., 1962, 117, 119, (b) Clark, E. S., Muus, L. T., Z. Krist.,
1962, 117, 108.
[34] Klug, H. P.; Alexander, L E., X-ray Diffraction Procedures, John Wiley and Sons, New
York, 1974.
[35] (a) Hermans P. H.; Platzek, P., Kolloid Z., 1939, 88, 68, (b) Hermans, J. J.; Hermans, P. H.;
Vermaas, D.; Weidinger, A., Rec. Trav. Chim, Pays-Bas, 1946, 65, 427.
[36] Wilchinsky, Z. W., J. Appl. Phys., 1959, 30, 792.
[37] Hayasaka, Y.; Fujimori, A., Trans. Mater. Res. Soc. Jpn., 2008, 33, 83-86.
[38] Fujimori, A.; Hayasaka, Y,, Macromolecules, 2008, 41, 7606.
[39] Fujimori, A.; Numakura, K.; Hayasaka, Y, Polym. Eng. Sci., 2010, 50, 1295.
16
Design and Characterization of Single-Mode
Microstructured Fibers with Improved
Bend Performance
Vladimir Demidov, Konstantin Dukel’skii and Victor Shevandin
S.I. Vavilov Federal Optical Institute, St. Petersburg
Russia
1. Introduction
Over the last few years, clear progress has been made in research and development of
single-mode optical fibers with a large core (when core diameter exceeds 10 µm). Such
advances were stimulated essentially by growing requirements for means of high power
laser radiation transmission. The urgent problem of laser beam delivery lies in the necessity
of the primary Gaussian power distribution of light inherent to many laser sources to be
maintained without both temporal and spatial distortions. So optical fibers that support
only a single transverse mode prove to be the most appropriate technique for efficient light
transfer in production areas of complex or compact architecture. But there are still a number
of limitations to cope with. For instance, as the power density of generated laser beams
increases, the fiber core has to be expanded adequately in order to minimize the impact of
undesirable nonlinear effects such as Raman scattering, Brillouin scattering and self-phase
modulation. Moreover, fiber material will exhibit irreversible breakdown if the power level
equals or exceeds the critical damage threshold.
Conventional single-mode fibers with step-index or graded-index refractive index profile
can be acceptably adapted for the realization of large cores. However, the core dimensions
enlargement permanently results in the reduction of the refractive index difference between
the core and the cladding (∆n). This, in turn, affects adversely the numerical aperture of the
fiber (NA), which then has to be reduced twice from its standard values of larger than 0.1 to
achieve core diameters of approximately 15 µm at a wavelength around 1 µm (Tunnermann
et al., 2005). Such NA lowering weakens considerably the fiber waveguiding so the optical
fiber becomes very sensitive to various perturbations, especially to bending effects. Further
decrease of NA will require keeping the uniformity of the core refractive index in the
vicinity of 10
-4
– 10
-5
. It is technologically unattainable when using chemical vapor-phase
deposition methods for the fiber preform fabrication.
An alternative flexible approach to solve this challenge is based on exploiting unique wave
guiding properties of microstructured optical fibers (MOFs), also known as photonic crystal
fibers or holey fibers. MOF design can relatively easily provide extended cores and hence
large effective mode areas that nowadays reach values of even thousands of µm
2
. This
phenomenon perfectly coordinates with the ability to manage accurately the effective ∆n
value at a level of as low as 0.0001 or less. Furthermore, MOFs, as opposed to single-mode