CELLULAR AUTOMATA SIMPLICITY BEHIND COMPLEXITY pps
Bạn đang xem bản rút gọn của tài liệu. Xem và tải ngay bản đầy đủ của tài liệu tại đây (35.97 MB, 580 trang )
CELLULAR AUTOMATA ͳ
SIMPLICITY BEHIND
COMPLEXITY
Edited by Alejandro Salcido
Cellular Automata - Simplicity Behind Complexity
Edited by Alejandro Salcido
Published by InTech
Janeza Trdine 9, 51000 Rijeka, Croatia
Copyright © 2011 InTech
All chapters are Open Access articles distributed under the Creative Commons
Non Commercial Share Alike Attribution 3.0 license, which permits to copy,
distribute, transmit, and adapt the work in any medium, so long as the original
work is properly cited. After this work has been published by InTech, authors
have the right to republish it, in whole or part, in any publication of which they
are the author, and to make other personal use of the work. Any republication,
referencing or personal use of the work must explicitly identify the original source.
Statements and opinions expressed in the chapters are these of the individual contributors
and not necessarily those of the editors or publisher. No responsibility is accepted
for the accuracy of information contained in the published articles. The publisher
assumes no responsibility for any damage or injury to persons or property arising out
of the use of any materials, instructions, methods or ideas contained in the book.
Publishing Process Manager Iva Lipovic
Technical Editor Teodora Smiljanic
Cover Designer Martina Sirotic
Image Copyright Shebeko, 2010. Used under license from Shutterstock.com
First published March, 2011
Printed in India
A free online edition of this book is available at www.intechopen.com
Additional hard copies can be obtained from
Cellular Automata - Simplicity Behind Complexity, Edited by Alejandro Salcido
p. cm.
ISBN 978-953-307-230-2
free online editions of InTech
Books and Journals can be found at
www.intechopen.com
Part 1
Chapter 1
Chapter 2
Chapter 3
Chapter 4
Chapter 5
Chapter 6
Chapter 7
Preface IX
Land Use and Population Dynamics 1
An Interactive Method to Dynamically
Create Transition Rules in a Land-use
Cellular Automata Model 3
Hasbani, J G., N. Wijesekara and D.J. Marceau
Cellular-Automata-Based Simulation
of the Settlement Development in Vienna 23
Reinhard Koenig and Daniela Mueller
Spatial Dynamic Modelling
of Deforestation in the Amazon 47
Arimatéa C. Ximenes, Cláudia M. Almeida,
Silvana Amaral, Maria Isabel S. Escada
and Ana Paula D. Aguiar
Spatial Optimization and Resource Allocation
in a Cellular Automata Framework 67
Epaminondas Sidiropoulos and Dimitrios Fotakis
CA City: Simulating Urban Growth
through the Application of Cellular Automata 87
Alison Heppenstall, Linda See,
Khalid Al-Ahmadi and Bokhwan Kim
Studies on Population Dynamics
Using Cellular Automata 105
Rosana Motta Jafelice and Patrícia Nunes da Silva
CA in Urban Systems and Ecology:
From Individual Behaviour to Transport
Equations and Population Dynamics 131
José Luis Puliafito
Contents
Contents
VI
Dynamics of Traffic and Network Systems 157
Equilibrium Properties of the Cellular Automata
Models for Traffic Flow in a Single Lane 159
Alejandro Salcido
Cellular Automata for Traffic Modelling and Simulations
in a Situation of Evacuation from Disaster Areas 193
Kohei Arai, Tri Harsono and Achmad Basuki
Cellular Automata for Bus Dynamics 219
Ding-wei Huang and Wei-neng Huang
Application of Cellular Automaton Model
to Advanced Information Feedback
in Intelligent Transportation Systems 237
Chuanfei Dong and Binghong Wang
Network Systems Modelled
by Complex Cellular Automata Paradigm 259
Pawel Topa
Cellular Automata Modeling
of Biomolecular Networks 275
Danail Bonchev
Simulation of Qualitative Peculiarities of Capillary
System Regulation with Cellular Automata Models 301
G. Knyshov, Ie. Nastenko, V. Maksymenko and O. Kravchuk
Dynamics of Social and Economic Systems 321
Social Simulation Based on Cellular Automata:
Modeling Language Shifts 323
Francesc S. Beltran, Salvador Herrando, Violant Estreder,
Doris Ferreres, Marc-Antoni Adell and Marcos Ruiz-Soler
Cellular Automata Modelling
of the Diffusion of Innovations 337
Gergely Kocsis and Ferenc Kun
Cellular Automata based Artificial Financial Market 359
Jingyuan Ding
Some Results on Evolving Cellular Automata Applied
to the Production Scheduling Problem 377
Tadeusz Witkowski, Arkadiusz Antczak,
Paweł Antczak and Soliman Elzway
Part 2
Chapter 8
Chapter 9
Chapter 10
Chapter 11
Chapter 12
Chapter 13
Chapter 14
Part 3
Chapter 15
Chapter 16
Chapter 17
Chapter 18
Contents
VII
Statistical Physics and Complexity 399
Nonequilibrium Phase Transition of Elementary Cellular
Automata with a Single Conserved Quantity 401
Shinji Takesue
Cellular Automata – a Tool for Disorder,
Noise and Dissipation Investigations 419
W. Leoński and A. Kowalewska-Kudłaszyk
Cellular Automata Simulation
of Two-Layer Ising and Potts Models 439
Mehrdad Ghaemi
Propositional Proof Complexity and Cellular Automata 457
Stefano Cavagnetto
Biophysical Modeling using Cellular Automata 485
Bernhard Pfeifer
Visual Spike Processing based on Cellular Automaton 529
M. Rivas-Pérez, A. Linares-Barranco and G. Jiménez, A. Civit
Design and Implementation of CAOS: An Implicitly
Parallel Language for the High-Performance
Simulation of Cellular Automata 545
Clemens Grelck and Frank Penczek
Part 4
Chapter 19
Chapter 20
Chapter 21
Chapter 22
Chapter 23
Chapter 24
Chapter 25
Pref ac e
In the early 1950s, at the suggestion of Stanislaw Ulam, John Von Neumann introduced
the cellular automata as simple mathematical models to investigate self-organisation
and self-reproduction. Cellular automata make up a very important class of completely
discrete dynamical systems. The physical environment of cellular automata is consti-
tuted of a fi nite-dimensional la ice, with each site having a fi nite number of discrete
states. The evolution in time of a cellular automaton goes on in discrete steps, and its
dynamics is specifi ed by some local transition rule, fi xed and defi nite. In spite of their
conceptual simplicity, which allows for an easiness of implementation for computer
simulation, and a detailed and complete mathematical analysis in principle, the cel-
lular automata systems are able to exhibit a wide variety of amazingly complex be-
havior. This feature of simplicity behind complexity of cellular automata has a racted
the researchers’ a ention from a wide range of divergent fi elds of study of science,
which extends from the exact disciplines of mathematical physics up to the social ones,
and beyond. In fact, nowadays, cellular automata are a core subject in the sciences
of complexity. Thus, numerous complex systems containing many discrete elements
with local interactions, and their complex collective behaviour which emerge from the
interaction of a multitude of simple individuals, have been and are being conveniently
modelled as cellular automata. For example, the dynamical Ising model, gas and fl uid
dynamics, traffi c fl ow, various biological issues, growth of crystals, nonlinear chemical
systems, land use and population phenomena and many others. Moreover, cellular
automata are not the only models in natural sciences such as biology, chemistry and
physics, but they are also, thanks to their complete space-time and state discreteness,
appropriate models of parallel computation. Thus, cellular automata permit descrip-
tions of natural processes in computational terms (computational biology, computa-
tional physics), but also of computation in biological and physical terms (artifi cial life,
physics of computation).
In this book the versatility of cellular automata for modelling a wide diversity of com-
plex systems is underlined through the study of a number of outstanding problems
with the cellular automata innovative techniques. This book comprises twenty fi ve
contributions organized in four main sections: Land Use and Populations Dynamics; Dy-
namics of Traffi c and Network Systems; Dynamics of Social and Economic Systems; and Statis-
tical Physics and Complexity. Brief descriptions of the book chapters are presented in the
following paragraphs.
Land Use and Populations Dynamics. Chapter 1 describes a semi-automated, inter-
active method that was designed and implemented to dynamically create transition
X
Preface
rules and calibrate a land-use CA model. The proposed method combines the benefi ts
of conditional and mathematical rules and is adaptable in terms of number of land-
use classes, and spatial and temporal scale of the input data. Chapter 2 presents and
describes a cellular automata model for simulating the population distribution of the
city of Vienna from 1888 to 2001. It has also developed a sensible and robust concept
for the explanation of the driving forces of urban development processes, and it was
shown that the development of the population density can be essentially regulated
by infrastructure investments. In Chapter 3, the deforestation processes in a region
called São Félix do Xingu, located in east-central Amazon, are simulated with a cellular
automata model called Dinamica EGO. It consists of an environment that embodies
neighbourhood-based transition algorithms and spatial feedback approaches in a sto-
chastic multi-step simulation framework. The modelling experiment demonstrated the
suitability of the adopted model to simulate processes of forest conversion, unravelling
the relationships between site a ributes and deforestation in the area under analysis.
Chapter 4 demonstrates that the heuristic search methods for the solution of spatial
optimization problems have to be designed in accordance with the spatial character of
the fi eld under study, which can be fi ingly modelled by means of cellular automata.
Two basic approaches are presented in this chapter to pursue a balance between local
and global characteristics. Chapter 5 demonstrates the potential of cellular automata
as a tool for urban planning and development using two models and case studies, one
from Saudi Arabia and the other from the Republic of Korea. The strengths and weak-
nesses of the models are discussed, including areas for further development. Chapter 6
presents three cellular automata that simulate the behavior of the population dynamics
of three biological systems. The first one deals with artificially-living fish divided into
two groups: sharks (predators) and fish that are part of their food chain (preys). The
second model introduces a simulation of the HIV evolution in the blood stream of posi-
tive individuals with no antiretroviral therapy. The last model extends the previous
one and considers the HIV dynamics in individuals subject to medical treatment and
the monitoring of the medication potency and treatment adhesion. Finally, Chapter 7
explores some of the fundaments of cellular automata models and the reasons why
these are being so widely applied nowadays, particularly to urban systems and ecol-
ogy, all of which seem to be connected directly to the fact that the transport equations
are common as much to the socioeconomic phenomena as to physics.
Dynamics of Traffi c and Network Systems. Chapter 8 presents an overview of the ba-
sic cellular automata models for traffi c fl ow. A maximum entropy approach for analyz-
ing the equilibrium properties of the cellular automata models for multi-speed traffi c
fl ow in a single lane highway is also proposed and discussed. It is shown, in particular,
that the traffi c cellular automata models of Nagel-Schreckenberg and Fukui-Ishibashi
evolve rapidly towards steady states very close to equilibrium. In Chapter 9, a modifi ed
model of the car-following Nagel-Schreckenberg model is proposed by incorporating
the agent and diligent driver into it. The modifi ed evaluation of the proposed param-
eter, the fundamental diagram, spatio-temporal pa erns, eff ect of lane-changing and
car-following with respect to the evacuation time, combination parameter of diligent
and agent driver in the case of evacuation time and the eff ectiveness are investigated.
Chapter 10 presents a simple cellular automaton model to study the typical bus dynam-
ics in a modern city. At a first stage, the nontrivial fluctuations are prescribed by the
stochastic moving of bus interacted with the stochastic arrival of passengers, and at a
second stage, the bus schedule interrupted by the traffi c lights is examined. The city
XI
Preface
buses time headway distribution is analyzed and compared against real time headway
measurements. Chapter 11 studies the traffic flow dynamics with real-time informa-
tion. The influence of feedback strategies is introduced, based on a two-route scenario
in which dynamic information can be generated and displayed on the board to guide
road users to make a choice. The model incorporates the eff ects of adaptability into the
traffi c cellular automata. Simulations demonstrate that adopting these optimal infor-
mation feedback strategies provide a high efficiency in controlling spatial distribution
of traffic pa erns. Chapter 12 presents the application of the cellular automata para-
digm for modelling network systems. The combination of cellular automata and graph
structure was successfully applied for simulating phenomena that belong to general
class of network systems located in consuming or producing environment. Two ex-
amples were investigated, anastomosing river systems and vascular systems created
in processes of tumor induced angiogenesis, showing how broad meaning cellular au-
tomata now has. Chapter 13 shows that cellular automata modelling technique could
partially fi ll the gap in describing the dynamics of biomolecular networks. While not
able to provide exact quantitative results, it is shown that the cellular automata models
capture essential dynamic pa erns, which can be used to control the dynamics of net-
works and pathways. Cellular automata models of human diseases can help in the fi ght
against cancer and HIV by simulating diff erent strategies. Another fi eld of application
presented is the performance rate of network motifs with diff erent topology, which
might have evolutionary and biomedical importance. In Chapter 14, a model of micro-
circulation microcirculatory network in the form of a cellular automaton is proposed
based on information about the anatomy and principles of functioning of the system.
Its basic static and dynamic properties were investigated and a comparison with data
from clinical investigations was carried out.
Dynamics of Social and Economic Systems. In Chapter 15, the properties of a cellular
automaton that incorporates some assumptions from the Gaelic-Arvanitika model of
language shi s and the fi ndings on the dynamics of social impacts in the fi eld of social
psychology are introduced. A cellular automaton is defi ned and a set of simulations
were carried out with it. Empirical data from recent sociolinguistic studies in Catalonia
(a region in Southern Europe) were incorporated to run the automaton under diff erent
scenarios. It is also discussed how the social simulation based on cellular automata
theory approach proves to be a useful tool for understanding language shi s. Chapter
16 provides an overview of cellular automata modelling approaches to socio-economic
systems with emphasis on the spreading of innovations. The philosophy of bo om-up
approaches of agent based models is outlined, and the typical set of cellular automata
rules which have been proven successful during the past years in the fi eld are de-
scribed. As a specifi c example, there is a detailed presentation of cellular automata for
the spreading of those types of technological innovations whose usage requires the
so-called compatibility. It is the case, for instance, of the telecommunication technolo-
gies such as mobile phones, where a broad spectrum of devices is off ered by the mar-
ket with widely diff erent technological levels. In Chapter 17, combining the feature of
multi-agent system and complex network, a formal defi nition of cellular automata on
networks is proposed and used to introduce a new artifi cial fi nancial market modeling
framework: Emergency-AFM. It includes classifi cation and expression of information,
uniform interfaces for investors’ prediction and decision process, uniform interface
for pricing mechanism, and analysis tools for time series. Chapter 18 introduces an
approach for solving evolutionary fl exible job-shop scheduling problem using cellular
XII
Preface
automata. Genetic programming is applied in the algorithm; the rule tables undergo
selection and crossover operations in the populations that follow.
Statistical Physics and Complexity. In Chapter 19, it is shown that elementary cel-
lular automata with a single additive conserved quantity classify the density of the
conserved quantity and that the same rules can show, when some stochastic boundary
conditions are employed, a kind of nonequilibrium phase transition which is originally
found in the asymmetric simple exclusion process. The probability distribution of pat-
terns is calculated and the domain wall theory is applied to the elementary cellular au-
tomata. Diff usive behavior of the domain wall is discussed as well. Chapter 20 intends
to show how simple cellular automata defi nitions allow construction of models refl ect-
ing physical properties of real systems, and to present how a complicated system evolu-
tion can be investigated with the help of cellular automata. In particular, the model of
many two-level subsystems is discussed, some of which have been used and discussed
extensively in physical models of solid state physics or quantum optics, but they also
have been discussed as sociological or economical models. Chapter 21 describes the
cellular automata simulation of two-layer Ising and Po s models. It was considered
the isotropic ferromagnetic and symmetric case, using a two-layer square la ice with
the periodic boundary condition. The Glauber method was used with checkerboard
approach to update sites. In Chapter 22 it is considered how classic propositional logic
and, in particular, propositional proof complexity can be combined with the study of
cellular automata. The fi eld of propositional proof complexity was born in the 1970s
from two fields connected with computers: automated theorem proving and compu-
tational complexity theory. Here it is shown how propositional logic and techniques
from propositional proof complexity can give a new proof of Richardson’s Theorem, a
famous theorem in this field. Also, some complexity results regarding cellular automa-
ta are considered and described, and the final section is devoted to a new proof system
based on cellular automata. Chapter 23 presents an in silico model environment for the
simulation of cardiac de- and repolarization and the three-dimensional potential pat-
tern throughout the entire volume conductor. It is based on a cellular automaton and a
bidomain-theory based source-field numerics. The in silico cardiac modelling solution
presented enables various applications for the study of the nature of the ECG pa ern
in space and time. In Chapter 24, a study of viability of a visual processing model is
presented. It has been defi ned by joining both cellular automata and spiking systems,
that have important similarities and complement each other. Cellular automata make
up a processing model for problem solving and spiking systems with address-event-
representation give a solution for implementing a grid of neurons in hardware. Fi-
nally, Chapter 25 presents the design and implementation of CAOS, a domain-specific
high-level programming language for the parallel simulation of extended cellular au-
tomata. CAOS allows scientists to specify complex simulations with limited program-
ming skills and eff ort. Yet the CAOS compiler generates effi ciently executable code that
automatically harnesses the potential of contemporary multi-core processors, shared
memory multiprocessors, workstation clusters and supercomputers. Both MPI (mes-
sage passing interface) and OpenMP (an industry standard for shared memory pro-
gramming) are used, either individually or in conjunction.
We hope that a er reading diff erent chapters of this book, we will succeed in bringing
across what the scientifi c community is doing about the application of cellular automata
XIII
Preface
for modelling complex systems in a diversity of disciplines, and that the readers will
fi nd it interesting.
Lastly, we would like to thank all the authors for their excellent contributions in diff er-
ent areas of cellular automata modelling.
Alejandro Salcido
Instituto de Investigaciones Eléctricas
Cuernavaca,
Mexico
Part 1
Land Use and Population Dynamics
1
An Interactive Method to Dynamically
Create Transition Rules in a Land-use
Cellular Automata Model
Hasbani, J G., N. Wijesekara and D.J. Marceau
Department of Geomatics Engineering,
University of Calgary
Canada
1. Introduction
Cellular automata (CA) models are increasingly applied to simulate a wide range of spatio-
temporal phenomena, including urban traffic (Sun and Wang, 2007), fire propagation
(Ohgai et al., 2007), and insect infestation (Bone et al. 2006), but most importantly urban
development (Almeida et al., 2008; Benenson and Torrens, 2004; Clarke et al., 1997; Santé et
al., 2010; Shen et al., 2009; Van Vliet et al., 2009), and land-use changes (Ménard and
Marceau, 2007; Moreno et al., 2010; Soares-Filho et al., 2002; Sui and Zeng, 2001). CA models
are particularly suitable for land-use change modeling for several reasons. They are
explicitly spatial and can be constrained in various ways to reflect local tendencies (Jenerette
and Wu, 2001; Li and Yeh, 2000). It is also possible to specify for each simulated time step
the quantity of land that should change from one land use to another (Jantz and Goetz,
2005). Information from a-spatial models, like a population growth model, can be integrated
into the CA model to spatially allocate the land-use changes (White et al., 1997). A stochastic
factor can also be included in the model to take into account some degree of unpredictability
in the system (Moreno et al., 2009). As a consequence, CA models are often designed to test
what-if scenarios and policies in urban and regional planning (Erlien et al., 2006; Jantz et al.,
2003; Li and Yeh, 2004).
However, a challenge when implementing a CA model is its calibration. Calibration
involves finding the parameters of the transition rules and the numerical values of these
parameters so that the rules closely correspond to the dynamics of the system under
investigation. This process is complicated due to the large number of combinations involved
when several cell states, state transitions, parameters, and parameter values are being
considered (Li and Yeh, 2002a; Shan et al., 2008). In addition, such combinations do not
necessarily yield unique solutions (Verburg et al., 2004). Since there is no obvious way of
finding which parameter should or should not be included in the model, the transition rules
are often based on the modeler’s intuitive understanding of the driving factors affecting the
system (Wu, 2002).
Statistical techniques, such as logistic and multiple regressions (Fang et al., 2005; Sui and
Zeng, 2001; Wu, 2002), principal component analysis (Li and Yeh, 2002a), and multivariate
Cellular Automata - Simplicity Behind Complexity
4
analysis of variance (Lau and Kam, 2005) have been proposed for CA calibration.
Computational intelligence techniques have also been tested, including artificial neural
network (Li and Yeh, 2002b; Pijanowski et al., 2002), genetic algorithm (Shan et al., 2008), and
data mining (Wang et al., 2010). Other methods involve the systematic testing of parameters
(Jantz and Goetz, 2005; Jantz et al., 2003) and iterative calibration to achieve reasonable
goodness-of-fit (Straatman et al., 2004). While these approaches might provide satisfactory
simulation results, they often leave the modeler with little control on the mathematical
equations used to determine the transition rules and the difficulty of understanding the
geographical meaning of these rules (Verburg et al., 2004).
This paper describes a semi-automated, interactive method that was designed and
implemented to dynamically create transition rules and calibrate a land-use CA model. The
proposed method combines the benefits of conditional and mathematical rules and is
adaptable in terms of number of land-use classes, and spatial and temporal scale of the input
data. It allows the modeler to acquire information about the importance of the factors
associated to historical land-use changes within the study area and to interactively select the
parameter values required for the model calibration. A detailed description of the steps
involved in the CA calibration is provided. The CA model is then used to answer the
following questions: a) how sensitive is the model to the conditions involved in the
calibration, including the cell size, neighborhood configuration, parameter values and
external driving factors? b) what is the performance of the model, in terms of presence and
location, in simulating land-use changes using the transition rules identified by the
proposed calibration method?
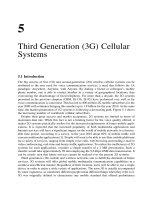
2. Methodology
The study area is the dynamic eastern portion of the Elbow River watershed, located in
southern Alberta, Canada, that covers an area of about 600 km
2
(Figure 1). The area is
experiencing considerable pressure for land-use development due to the booming of the
Alberta economy and its proximity to the City of Calgary, a fast growing city of one million
inhabitants. About 5% of the watershed lies within the City of Calgary; 10% lies within the
Tsuu T’ina nation, 20% within the municipal district of Rocky View, and the remaining 65%
within the Kananaskis country. The study area is covered by about 48% of forest, 40% of
agriculture and grassland, and 10% of built-up areas.
The historical land-use maps required for the CA calibration and validation were generated
from Landsat Thematic Mapper imagery acquired during the summers of 1985, 1992, 1996,
2001, 2006 and 2010 at the spatial resolution of 30 m. Seven dominant classes were
identified, namely evergreen, deciduous, agriculture, rangeland and parkland, built-up
areas, water and clear-cut. Field verification was conducted for the years 2006 and 2010 and
ancillary data along with expert knowledge were used to verify the classification results. A
computer program was developed and applied to identify and correct minor spatial-
temporal inconsistencies due to classification and georeference errors in the historical land-
use maps.
A graph of the historical land-use trends reveals a decrease in the forested areas, a slight
increase in parkland/rangeland, a sharper increase of built-up areas while agriculture
slightly fluctuates, mostly from 2002 (Figure 2).
An Interactive Method to Dynamically Create Transition Rules
in a Land-use Cellular Automata Model
5
Fig. 1. Location of the study area; the dashed line represents the western limit of the study
area
Fig. 2. Historical land-use trends in the study area
The historical land-use maps also indicate that a considerable amount of land-use transition
occurred in the study area during the period considered (Table 1).
Cellular Automata - Simplicity Behind Complexity
6
From To
Land-use transition (%) Total (%)
Evergreen 6.23
Deciduous 6.41
Rangeland/Parkland
Agriculture
1.83
14.47
Evergreen 11.40
Deciduous 17.88
Agriculture 65.97
Rangeland/Parkland
Built-up
2.91
98.16
Agriculture Rangeland
/Parkland
43.52 43.52
Table 1. Amount of land-use transitions observed in the historical maps from 1985 to 2010.
e.g. 14.47% is the percentage of agriculture increase in 2010 from the existing area of
agriculture in 1985 and 6.23%, 6.41%, 1.83% are the contributing portions to this increase
from each land-use transition to agriculture
2.1 Model implementation
The CA model was written in IDL version 6.3 from ITT Visual Information Solutions
(ITTVIS, 2007). IDL is an array-oriented interpreted language based on optimized C
routines. As a consequence, an operation on an array can be performed at a speed
unreachable by a traditional for-loop going through each element of an array. IDL also
offers the advantages of being a multiplatform language, of having internal functions
dealing with spatial data, and of being linked to ENVI, a remote sensing image analysis
software.
The model implementation includes three main steps: 1) the definition of the cell size,
neighborhood configuration, and driving factors, 2) the transition rule extraction and the
model calibration, and 3) the simulation procedure.
2.1.1 Cell size, neighborhood configuration, and driving factors selection
Several studies have shown that the cell size and neighborhood configuration have an
impact on the outcomes of raster-based CA models and should not be arbitrarily chosen
(Chen and Mynett, 2003; Kocabas and Dragicevic, 2006; Ménard and Marceau, 2005; Moreno
et al., 2009; Pan et al., 2010; Samat, 2006; Benenson, 2007). To guide the selection of the cell
size, an examination of the historical land-use maps was done, which revealed that most
land-use changes were occurring over four or more contiguous pixels. To reduce
computation time while maintaining the desired level of spatial details for the study, the
land-use maps were resampled at the resolution of 60 and 100 m using the nearest neighbor
algorithm available in ArcGIS 9.1 (ESRI, 2005).
The neighborhood was designed to approximate a circle around a center cell. This decision
was made in order to reduce spatial distortions, when compared to an extended Moore
neighborhood, as every cell located at a given distance from the center cell is considered in
the neighborhood (Li and Yeh, 2002b). The modeler can choose the desired number and size
of concentric neighborhood rings around a cell. The different rings are all exclusive; a cell
can only be located in a single ring, and there is no gap between two rings (Figure 3). Within
each ring, the influence of the neighboring cells on the central cell is constant but this
An Interactive Method to Dynamically Create Transition Rules
in a Land-use Cellular Automata Model
7
influence is different between rings. Consequently, the continuous distance function used in
most CA models to represent the influence of neighborhood cells has been replaced by a
discrete distance function. This approach has the main advantage of greatly simplifying the
definition of the cells’ influence as there is only one influence per ring. Moreover, these
influences are dynamically found in the historical data and are not hard coded in the model,
which allows the use of historical data at a different scale without changing the model.
Fig. 3. Illustration of the neighborhood configuration used in the study corresponding to
rings of 5, 9 and 17 cells
While testing all the possible combinations of cell size (60 m and 100 m) and neighborhood
configuration was beyond the scope of this study, several combinations were tested to
identify which ones provide the best simulation outcomes. Details regarding the sensitivity
analysis that was conducted are provided in Section 2.1.3.
Land-use changes are complex spatial processes resulting from the interactions of socio-
economic (e.g., population growth), biophysical (e.g., slope and soil quality), and geographic
(e.g., proximity and accessibility to services) factors operating at different spatial and temporal
scales (Liu and Phinn, 2003; Verburg et al., 2004). In this study, in addition to the influence of
the cells located within local and extended neighborhoods as previously described, four
external factors were considered as parameters in the transition rules, namely the distance to
Calgary city center, the distance to a main road, the distance to a main river, and the ground
slope. Such factors are commonly quoted in the literature as influencing land-use changes
(Fang et al., 2005; Li and Yeh, 2002b; Pijanowski et al., 2002; Wu, 2002). The aforementioned
distances were calculated for each cell and each historical year using the Euclidian distance
tool available in ArcGIS 9.1 (ESRI, 2006). The resulting distance files were stored as raster
images of the same resolution and extent as the land-use maps.
2.1.2 Rule extraction and model calibration
The transition rule extraction and the model calibration include the following steps (Figure
4). First, the set of historical land-use maps along with the maps corresponding to the
driving factors are read and the number of cells of a particular state in the neighborhood of
each central cell is computed. For each type of land-use change, all the cells that have
Cellular Automata - Simplicity Behind Complexity
8
changed state in the historical land-use maps are identified. Frequency histograms are built
to display the percentage of cells that have changed from one state to another when
considering a particular driving factor and the cell state in the neighborhood. This provides
quantitative information regarding the importance of each driving factor and neighborhood
composition (i.e. state of the cells within the neighborhood) as being related to historical
land-use changes within the study area. These histograms are interpreted by the modeler
who identifies the ranges of values of each driving factor and neighborhood composition to
be included in the conditional transition rules. This information is then automatically
translated into mathematical transition rules.
Historical
land-use maps
Count cells in the
neighborhood of each cell
Load driving
factors
Mathematical transition
rules are extracted from
the historical data
Mathematical transition
rules are extracted from
the historical data
User visually identifies the
ranges of values for the
conditional transition rules
User visually identifies the
ranges of values for the
conditional transition rules
Display frequency
histograms
Display frequency
histograms
Fig. 4. Procedure for the extraction of the transition rules
Figure 5 provides an example of such a frequency histogram. The total number of Evergreen
cells in the study area compared to the number of Evergreen cells that have changed to
Built-up areas is first displayed to show the relative contribution of the later in the study
area (Figure 5a). A detailed representation and analysis of the proportion of cells that have
changed from Evergreen to Built-up areas when considering their distance to a main road
(Figure 5b) reveals that 8% of these cells were located between 150 and 180 m of a main road
while 98% of the cells were within 1250 m of a main road. At 1250 m, there is an inflexion
point on the cumulative occurrence curve, expressing that this distance is critical for
interpreting the influence of a main road on this land-use change. The further a cell was
located from a main road, the less often it changed from Evergreen to Built-up area.
A graphical interface was designed to facilitate the interpretation of the frequency
histograms and to allow a modeler to interactively select the ranges of values to be used for
defining the conditional transition rules of the CA model (Figure 6). Each histogram can be
displayed, allowing the modeler to change the bin size and to zoom in and out. By clicking
on the histogram, the modeler identifies the ranges of values (minimum and maximum) for
each neighborhood configuration, driving factor and cell state within that neighborhood.
These values are stored in a table (Table 2) and further used to determine the conditional
transition rules. An example of such a rule defined from Table 2 is:
If distance to a main road is between 0 and 427 m
and number of evergreen cells within the first neighborhood ring is between 0 and 17
and number of built-up cells within the second neighborhood ring is between 0 and 14
and number of agriculture cells within the third neighborhood ring is between 0 and
168
then the central Evergreen cell might change from Evergreen to Built-up area.
All possible transition rules are created by combining the identified ranges of values from
the histograms.
An Interactive Method to Dynamically Create Transition Rules
in a Land-use Cellular Automata Model
9
a)
b)
Fig. 5. a) Frequency histogram comparing the total number of Evergreen cells located at a
certain distance from a main road (A), with the number of Evergreen cells that have changed
from Evergreen to Built-up areas when considering their distance to a main road (B); b)
Frequency histogram displaying the percentage of cells that have changed from Evergreen to
Built-up areas when considering their distance to a main road; the dashed curve represents the
cumulative occurrence of the cells located at a certain distance from a main road
Cellular Automata - Simplicity Behind Complexity
10
Fig. 6. Frequency histogram displaying the percentage of cells that have changed from
Evergreen to Built-up when considering the number of Built-up cells within 300 m of these
cells and graphical interface designed for the selection of the range of values to be
considered in the conditional transition rules
Cell state Distance to
a main road
(m)
Number of
Evergreen cells
located within
the first
neighborhood
ring [0 to 300) m
Number of Built-
up cells located
within the second
neighborhood
ring [300 to 540)
m
Number of
Agriculture
cells located
within the
third
neighborhood
ring [540 to
1020) m
…
Evergreen 0 to 427 0 to 17 0 to 14 0 to 168
428 to 1408 18 to 50 15 to 59 169 to 258
51 to 74 60 to 92 259 to 377
Table 2. Ranges of values identified from the frequency histogram to be used for
determining the conditional transition rules
To convert the conditional rules into mathematical rules, the mean and standard deviation
of the previously defined ranges of values are computed. These values become the
coefficients of the parameters of the mathematical transition rules. In this model, the
coefficients of each transition rule do not lead to a probability of change, but rather to a
Resemblance Index (RI) that quantitatively describes the similarity between the
neighborhood content of a cell at the time of the simulation and the neighborhood contents
An Interactive Method to Dynamically Create Transition Rules
in a Land-use Cellular Automata Model
11
that have been used to generate the values of the parameters of the transition rule. If they
are very similar, it is likely that the cell should change state for the corresponding type of
land use. RI is inspired by the Minimum Distance to Class Mean remote sensing image
classification algorithm (Richards, 2006). This algorithm calculates the mean point in the
parameter space for pixels of known classes and then assigns unknown pixels to the class
that is arithmetically closest. It is computed for every transition rule using Equation 1.
∑
n-x
RI =
=1
σ
i
m
i
i
i
(1)
where m is the number of layers (corresponding to the number of driving factors plus the
number of land-use classes multiplied by the number of neighborhood rings), n
i
is the value
in layer i, x
i
is the mean value for layer i in the transition rule and σ
i
is the standard
deviation for layer i in the transition rule. If the standard deviation is zero for layer i, then
n-x
=0
σ
i
i
i
if n=x
i
i
or otherwise equals positive infinity. Accordingly,
RI
+
∈
ℜ and the
smaller RI is, the more similar is the cell neighborhood configuration to the ones used to
define the transition rule. The mathematical rules offer greater flexibility compared to the
conditional rules as they reflect significant values for each type of land-use change and are
more adaptable to the neighborhood composition than the conditional rules identified from
specific observations in the historical dataset.
Table 3 presents some values representing the coefficients of the conditional and
mathematical rules, respectively for three neighborhood configurations. The Min and Max
columns are associated to the conditional transition rule, while the Mean and Standard
deviation columns are related to the mathematical transition rule. An example of a
mathematical rule defined from these values is,
D. main road - 259.38 D. city center - 6 272.57
RI(rule1, Evergreen to Agriculture) = + +
173.05 1 568.91
D. river - 3 465.61 Ground slope - 3.23 N0_Water - 0.17 N0_Evergreen - 10.71
+ + + +
310.77 1.79 0.44 5.25
N
{}
0_Deciduous - 3.13 N0_Agriculture - 81.84 N0_Rangeland /Parkland - 0.04
+ + +
3.42 5.75 0.29
N0_Built - up - 0.08 N1_Water - 0.44
+ 0 if N0_Clear - cut = 0; otherwise + +
0.35 0.86
N1_Evergreen - 19.24 N1_Deci
+
10.0
∞
{}
duous - 4.75 N1_Agriculture - 170.93
+ +
3.9 11.51
N1_Rangeland / Parkland - 0.28 N1_Built - up - 0.33
+ + 0 if N1_Clear - cut = 0; otherwise +
0.86 0.63
∞