SIX SIGMA FOR EVERYONE PART 4 pptx
Bạn đang xem bản rút gọn của tài liệu. Xem và tải ngay bản đầy đủ của tài liệu tại đây (110.52 KB, 22 trang )
67
4
CHAPTER
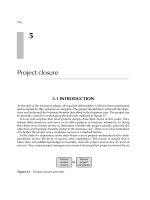
10 Technical
Tools to Master
While on a Six
Sigma Team
In Chapter 3, we reviewed the steps a team goes through as they
attempt to improve the sigma performance of a process.
Chapter 4 addresses the 10 most important technical tools a
Six Sigma team member needs to master as they progress through
the DMAIC methodology.
While these tools are considered technical in nature, most of
them are relatively easy to learn and apply. They are covered in the
order they are used in the DMAIC methodology.
Tool #1 The Critical to Quality (CTQ) Tree
The critical to quality tree is used in the second tollgate of the De-
fine phase of DMAIC. It is used to brainstorm and validate the
needs and requirements of the customer of the process targeted
for improvement.
68 SIX SIGMA FOR EVERYONE
The steps in creating a CTQ tree are as follows:
• Identify the customer of the process targeted for improve-
ment. A customer is the recipient of the product or service
of the process.
• Identify the need of the customer, that is either the product
or service desired by the customer.
• Identify the first level of requirements of the need, that is,
some characteristic of the need that determines whether
the customer is happy with the need.
• Drill down to more detailed level(s) of the requirement if
necessary. Some requirements of the customer dictate
greater specificity. If so, the tree will need to be created in
greater detail.
Figure 4.1 shows an example of a CTQ tree for a health care
provider where the customer of the patient registration process is
the patient. The need of the patient is to be registered. However,
you can also see that there are requirements of the patient that will
determine whether the patient has been satisfactorily registered.
Figure 4.1 Health care provider CTQ tree.
Registration
General
(need)
Behavioral
(requirement)
Accuracy
Type of room
Hospital ward
Timeliness
Courtesy
Need 1st Level 2nd Level
10 Technical Tools to Master While on a Six Sigma Team 69
Keys to Using This Tool
• Always start with the need of the customer.
• State the need as a noun with no adjectives to describe it.
• Keep moving left to right until you describe how to measure
the detailed requirements. If you have described a measure-
ment, you have gone to far (e.g., a requirement could be
speed or timeliness, but if you put it in minutes you have de-
scribed a measurement).
•
Once you have started a branch for the tree, all those
branches should be a greater detail of the preceding require-
ment, not a new requirement.
Tool #2 The Process Map
During the Define phase, the project team creates the first of sev-
eral process maps. A process map is a picture of the current steps
in the process targeted for improvement.
A process map has five major categories of work from the iden-
tification of the suppliers of the process, the inputs the suppliers
provide, the name of the process, the output of the process, and
the customers of the process. Each of these steps is summarized
as SIPOC to indicate to the team the steps that must be con-
ducted to complete a process map.
There are four stages of process mapping. The first stage is
what the project team creates during the Define stage of project
work. It is the high-level process map because the project team fo-
cuses in on the five to seven highest level steps in the current pro-
cess. Sometimes there will be less than five or more than seven
but most teams should strive to have five to seven.
The second step in process mapping occurs during the Analysis
stage. Here, the original high-level process map is created in more
detail. This second type of process map is called the subprocess
map. The third type of process map is created during the Improve
stage of DMAIC. This map is the improved map of what the new
process should be. Ergo, it is called the should-be map. Finally, the
fourth type of process map is the could-be map, usu
ally generated
70 SIX SIGMA FOR EVERYONE
in the Design for Six Sigma application. (Design for Six Sigma is
not addressed in this book.)
Figure 4.2 shows an example of a high-level process map for a
hospital lab test ordering process. In addition, we have also talked
about the subprocess map created in the Analysis stage of DMAIC.
Figure 4.3 shows the same hospital lab test ordering process with
one of the high-level steps drilled down in greater detail showing
the hospital lab test subprocess map.
Keys to Using This Tool
• Don’t rush to the creation of the should-be map, this occurs
in the Improve stage of DMAIC.
•
Capture all of the steps as they actually occur in the process,
not the way you would like to see the steps in the process.
• Use verbs or adjectives to describe steps in the process.
• Use unqualified nouns to describe the output and inputs of
the process.
Figure 4.2 Hospital lab test ordering—high-level process map.
CustomersOutputs
Hospital lab
test ordering
Process
InputsSuppliers
Phlebotomy
department
Order
Doctor
orders
lab
Doctor
receives lab
report
Place
order
Lab
result
Patient
Care
Team
Obtain
specifications
Specifications
are compared
to lab order
Test
Report
71
Figure 4.3
Subprocess map—hospital lab test ordering process.
CO
Customers
Outputs
P
Process
IS
Inputs
Suppliers
Specifications
compared to lab order
Spin specimen
for test
Test
Place
order
Obtain
specifications
Test
Report
Wait for
order
Review
specification
Wait for
results
Prepare
report
Review
report
Verify
specification
with care
specialist
72 SIX SIGMA FOR EVERYONE
• To verify any map, do two things. Talk to the people in the
process and follow the product or service through the pro-
cess. For example, in the case shown, the project team
should follow a lab order from beginning to end.
• Make sure to capture both easily seen and invisible steps.
Invisible steps are the waits or moves of the product or ser-
vice being mapped.
• Don’t map the best or worst case map, map what is repre-
sentative of how the process normally works.
Tool #3 The Histogram
During the Analysis stage of DMAIC, the project team will review
data collected during the Measure stage of DMAIC. It is often
suggested that the data be organized into graphs or charts to more
easily understand what the data is saying about the process. As
W.
Edwards Deming, the noted quality guru said, “Variation in any
process is the enemy and it’s easier to fight an enemy you can see.”
Data is of two types. Discrete data is either/or, go/no-go,
pass/fail type data while the other type of data exists on a contin-
uum and is called continuous data (time, height, etc.). For contin-
uous data, the best tool to use is the histogram, a graphical display
of the number of times a given event is seen in a set of observa-
tions. Figure 4.4 shows the histogram of timeliness of the lab test
ordering process.
The highest frequency of the bar graph indicates the central
tendency of the data. The bold line indicates the customer specifica-
tion. A customer specification indicates the least acceptable lab test
ordering time. (In this example, it is two hours.) The peak of the
curve shows that the average performance for lab test reporting oc-
curs past the specification. Also in this example, you see most of the
values in the middle and fewer tailing off in either direction. Be-
cause of its shape, some refer to it as a bell-shaped curve. The more
technical name for it is a Gaussian curve, named after the German
mathematician Gauss.
This type of curve shows common cause variation. This means
that the components of variation have no undue influence on the
10 Technical Tools to Master While on a Six Sigma Team 73
re
sults. The components of variation are the machines, methods,
materials, measurement, Mother Nature, and people in the process
(sometimes called the 5 m’s and 1 p). Typically, management blames
only one of the 5 m’s and 1 p when the performance of a process
looks as bad as the lab reporting process. That element is the p of
the 5 m’s and 1 p—people. Unfortunately, this type of management
often ends in disaster. What if management tells the people in this
process to work faster in doing lab reports? Without finding out the
root cause of the delays in lab test reporting, people in the process
may just work faster and make more mistakes (affecting another
customer requirement such as accuracy). They may have to redo lab
reports because of mistakes and the process will take even longer as
a result.
Figure 4.5 shows the second type of variation called special
cause variation. You can see from the picture of variation that the
distribution is not bell shaped. There are two peaks in the data.
Therefore, one or more of the 5 m’s or 1 p have had an undue in-
fluence in the process. Management should still not focus on the
p since only 5 percent to 15 percent of the time special cause
variation is due to the people. In manufacturing settings the
predominant special cause variation is due to machines and in
Figure 4.4 Histogram—lab test ordering time.
Time (minutes)
Number of Occurances
0–30
31–60
61–90
91–120
121–150
151–180
181–210
211–240
0
2
4
6
8
10
12
14
16
18
74 SIX SIGMA FOR EVERYONE
service-related businesses the predominant special cause varia-
tion is due to methods.
Keys to Using This Tool
• Remember to have five to seven measurement cells when
your database is 100 or less.
• Use histograms when you have continuous data only.
• Analyze your histogram for special cause or common cause
variation.
• Don’t rush to assume people are the special cause because
in most cases they aren’t.
• In manufacturing, first focus on the machine as the special
cause.
• In service-related businesses, focus first on the methods as
the special cause.
• While we recommend the histogram, box plots and normal
frequency charts can do the same thing for you.
Tool #4 The Pareto Chart
We just reviewed the favored tool for analyzing data when you
have collected continuous data. The other type of data teams can
Figure 4.5 Histogram bimodal distribution.
Number of Occurances
0
5
10
15
20
25
10 Technical Tools to Master While on a Six Sigma Team 75
collect is discrete data. Discrete data is counted data—go/no-go,
off/on, yes/no, and defect/no defect type data.
When the data is discrete, most teams create a Pareto chart.
The Pareto chart is named after an Italian economist, Vilfredo
Pareto who in the sixteenth century proved mathematically that
80 percent of the world’s wealth was controlled by 20 percent of
the population. This 80–20 rule eventually proved applicable in
arenas other than economics. For example, 80 percent of your day
is spent on 20 percent of your job description, 80 percent of your
scrap is in 20 percent of your floor space, and so on.
When dealing with discrete data, the project team should cre-
ate reason codes for why a defect occurs and count and categorize
the data into these reason codes.
Figure 4.6 shows a grocery store example for an unduly long
wait in line to check out. The grocery store project team creates
reason codes as to why the wait is so long. For every time a reason
code is determined, the team puts a tic mark in the appropriate
place on a check sheet. After a predetermined time goes by, the
team then calculates the most frequently occurring value, the next
most frequently occurring value, and so on to create the Pareto
chart found in Figure 4.7.
Keys to Using This Tool
• While most times the Pareto chart will be created based on
the frequency of times a given event occurs, the project
team should also consider making the Pareto chart based on
impact. For example, if the dollar impact of an event has a
greater effect on the business than the frequency of an
Item Frequency Comments
Price check 142
No money 14
No bagger 33
Register out of tape 44
Forget item 12
Override 86
Manager assistance needed.
Wrong item 52
Miscellaneous 8
Figure 4.6 Data collection grid.
76 SIX SIGMA FOR EVERYONE
event, the Pareto chart should be made based on the dollar
impact.
•
Always work to reduce the highest contributor on the Pareto
chart whether it is based on frequency or dollar impact. It
is easier to reduce the largest problem by 50 percent than
eliminate a small problem.
Tool #5 The Process Summary Worksheet
The goal of a Six Sigma project team is to improve effectiveness and
efficiency. Efficiency is measured in terms of cost, time, labor, or
value. The process summary worksheet is a “roll-up” of the sub-
process map indicating which steps add value in the process and
which steps don’t add value. Moreover, each of the non-value-added
steps is categorized for the type of non-value-added activity. The fol-
lowing are the most common types of non-value-added activities:
• Moves: Steps in the process where the product or service is
moved from one place to another.
• Delays: Steps in the process where the product or service is
waiting for the next step in the process.
• Set-up: Steps in the process that prepare the product or ser-
vice for a future step.
Figure 4.7 Pareto chart on data collection.
Wrong item 13.3%
Register out of tape 11.2%
No bagger 8.4%
No money 3.6%
Override 22.0%
Price check 36.3%
Forgot item 3.0%
Misc.
2.2%
10 Technical Tools to Master While on a Six Sigma Team 77
• Internal failures: Steps in the process that have to be re-
done.
• External failures: Steps in the process where a failure is de-
tected by the customer.
• Control/inspection: Steps in the process where the product
or service is reviewed to ensure customer satisfaction.
•
Value-enabling: Steps in the process that technically don’t
add value but are necessary for the functioning of the
organization.
To determine whether a step in the process adds value or not,
the following three criteria must be met:
1.
The customer of the step in the process must consider it
important.
2. There is a physical change to the product or service.
3. It is done right the first time.
When one or more of the preceding criteria is not met, the step
is considered non-value-added and that step must be categorized
into one of the aforementioned types of non-value-added elements.
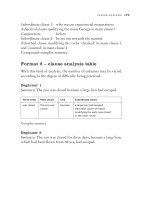
In Figure 4.8, you can see an example of a process summary
analysis worksheet where most of the steps don’t add value and
over 40 percent of the non-value-added steps are due to a delay.
To t a l
Process Step 1 23456(Minutes) Percent
Time (minutes) 1 20 15 45 10 15 106 100
Value added X X 16 15.1
Non-value added XXXX 90 84.9
Internal failure X X 25 23.5
External failure X 20 18.9
Control/inspection
00
Delay X 45 42.5
Prep/set-up 0 0
Moves 0 0
Value-enabling 0 0
Figure 4.8 Process summary analysis worksheet.
78 SIX SIGMA FOR EVERYONE
Keys to Using This Tool
• Don’t spend unnecessary time determining whether a step
adds value or not. If the project team can’t reach agreement
whether a step adds value or not use an alternative decision
making method, such as
a majority vote.
• Note from Figure 4.8 that the first line of the process sum-
mary analysis worksheet indicates the amount of time it
takes for the step to be completed.
• Don’t list the worst case time for the step to be completed or
the best time. Use an estimate of a representative time.
• If the goal of the project team is to improve cycle time of the
process the percent column could be for time, not fre-
quency, as seen in Figure 4.8.
•
Once the process summary analysis worksheet has been
completed, create a microproblem statement about the most
frequently occurring non-value-added steps. For example,
from Figure 4.8 we would create a microproblem statement
such as “Why is there so much time in Step 4 (the Delay)?”
Tool #6 The Cause-Effect Diagram
We repeatedly stressed the importance of root causation in Chapter
3. The most important tool to assist the project team in determining
root causation is the cause-effect diagram. This tool captures all the
ideas of the project team relative to what they feel are the root
causes behind the current sigma performance.
As you can see in Figure 4.9, the cause-effect diagram has the
microproblem statement in a box to the far right. Extending from
this box is a diagonal line with six lines attached. These six lines
represent the 5Ms and 1P.
Keys to Using This Tool
• While all ideas should be captured, be careful that the team
doesn’t brainstorm too many ideas in the people section.
Remember, people are rarely the root cause of problems in a
process.
79
Figure 4.9
Cause-effect diagram—phlebotomy response time.
Payment
system
Tube system
down
Prioritization
of orders
Dispatching
issues
Volume
of stats
Computer
function
Order
misplacement
Patient
misplacement
Phlebotomist
needs break
Phlebotomist
with patient
Staffing
issues
Measurement
Methods
Machine
Materials
People
Mother Nature
Why does it take phlebotomy
up to 30 minutes to respond
to a stat order?
Test materials
for availability
80 SIX SIGMA FOR EVERYONE
• Make sure to capture all ideas.
• Don’t criticize or debate ideas.
• Once all ideas are captured, make sure ideas are clarified so
that everyone understands one another’s ideas.
• Gather duplicates together.
•
Once ideas have been clarified and duplicates gathered, the
team should vote on what they consider the more likely ideas.
Tool #7 The Scatter Diagram
Once ideas have been prioritized after use of the cause-effect dia-
gram, the most important thing the project team does is validate the
remaining ideas with fact and data. As we indicated in Chapter 3,
the validation of root causation is one of the most important things
a Six Sigma project team does.
The team can validate through one of three methods. Using
basic data collection, a designed experiment, or through the scat-
ter diagram.
The scatter diagram takes an idea about root causation and
tracks corresponding data in the response the team is trying to
improve.
In Figure 4.10, we see a scatter diagram that tracks frequency
of communication with timeliness of lab orders. We see that most
of the values go downward from left to right. This pattern shows a
correlation between frequency of communication and timeliness
of lab orders. This type of correlation is called a negative correla-
tion. The term negative is not bad. It simply means that as com-
munication goes up (i.e., goes from low to high), the timeliness of
lab orders goes from high to low (this is desired).
Keys to Using This Tool
• Remember that correlation does not mean causation. There
may be a third factor explaining the correlation. For exam-
ple, there may be a relationship between ice cream sales
and shark attacks but one doesn’t cause the other. The third
factor is seasonality.
10 Technical Tools to Master While on a Six Sigma Team 81
• Make sure to use the scatter diagram with continuous data
only.
• Make sure the two axes are corresponding so a true rela-
tionship can be determined. Make sure there is proper scal-
ing and spacing on your diagram.
Tool #8 The Affinity Diagram
An affinity diagram is used to help sort and categorize a large num-
ber of ideas into major themes or categories. It is especially useful
when the team is ready to brainstorm solutions in the Improve
stage of DMAIC.
The steps in creating an affinity diagram are relatively simple.
They are:
• Have each team member write one idea per Post-it note and
post on a wall randomly.
• As ideas are read off for clarification, sort ideas into similar
groups.
• Create a “header” card for each general category of ideas
below it.
Figure 4.10 Scatter diagram—negative correlation.
Timeliness of Lab Reports
Communication
82 SIX SIGMA FOR EVERYONE
Figure 4.11 shows an example of ideas a project team brain-
stormed for going to a restaurant.
Keys to Using This Tool
•
Follow the rules of brainstorming. This means not criticiz-
ing ideas, capturing all ideas, and making sure everyone
participates.
• Don’t debate where an idea should go on the affinity dia-
gram. If two people think an idea should be in two different
groups, write the idea a second time and put it in a second
category.
• When creating the “header,” try to reach consensus but
don’t try to wordsmith an idea. Try to set an environment of
compromise.
• To narrow the list of solutions, multi-vote on the ideas
under the header cards.
Tool #9 The Run Chart
Earlier in this chapter, we discussed the histogram and Pareto
chart. Think of both of these tools as similar to a camera where a
Figure 4.11 Affinity diagram.
MiscellaneousItalian
Papa
Johns
Vittorios
Trattoria
Giorgio’s
Sid’s
Chinese Caribbean American
P. F.
Changs
Yellow
Flower
Silk
Garden
Bahama
Breeze
Red
Robin
Walnut
Brewery
Karen’s
Kitchen
Don’s
10 Technical Tools to Master While on a Six Sigma Team 83
snapshot of the process has been taken. Most people own both a
camera and a camcorder, the latter of which records some event
over time. Using this analogy, the run chart is similar to a cam-
corder, recording some process element over time.
Figure 4.12 shows an example of a run chart of someone who
is tracking their weight over time. You can see that while some
variation exists over time, this person’s weight seems consistent
and predicable over time.
Now examine the run chart in Figure 4.13. It shows after
Week 9 this person started a diet.
You note a decline in weight. Technically, you can see a trend
downward. The technical term trend applies to a process when a
run chart has seven points in a row going downward or upward. A
shift is when seven points in a row are above or below the average
line on the run chart (Figure 4.14).
Keys to Using This Tool
• A run chart should be used when the project team is inter-
ested in seeing some measure over time.
• Don’t interpret the chart prematurely. Too many times a
project team sees one or two points going one direction and
assumes this means there is a trend or shift.
Figure 4.12 Run chart—weight over time.
130
120
140
Pounds
150
160
12345678
Weeks
9
84 SIX SIGMA FOR EVERYONE
• In addition to examining the data on a run chart for trends
or shifts, look for unusual patterns. Two points above the
average line and then two points below in a repeating pat-
tern could indicate something unusual is happening in the
process.
Figure 4.13 Run chart—weight over time: trend.
130
120
140
Pounds
150
160
13 5791113
Weeks
15 17
Figure 4.14 Run chart—weight over time: shift.
130
120
140
Pounds
150
160
135791113
Weeks
15 17 19 21 23 25
10 Technical Tools to Master While on a Six Sigma Team 85
Tool #10 The Control Chart
Similar to a run chart, a control chart uses the data from a run
chart to determine the upper and lower control limits. Control
limits are the expected limits of variation above and below the av-
erage of the data. These limits are mathematically calculated and
indicated by dotted lines.
In Figure 4.15, you can see a straight line, which indicates the
average of the data. The upper and lower control limits indicated
by the dotted lines tell the project team when the process is no
longer consistent, predictable, and repeatable.
When a point “goes out of control” one or more of the 5 m’s
and 1 p have had an undue impact on the process (also known as
special cause variation).
In Figure 4.15, we see a control chart for someone’s diastolic
blood pressure. You can see that a reading above 130 doesn’t mean
that the patient has suffered a stroke or heart attack but clearly
the process of normal blood pressure has changed and corrective
action should be taken before a more serious problem occurs.
Keys to Using This Tool
• Don’t confuse control limits with specification limits. Spec-
ification limits are the least acceptable product or service in
Figure 4.15 Control chart—diastolic pressure.
100
90
110
120
130
Monday Tuesday Wednesday Thursday Friday
86 SIX SIGMA FOR EVERYONE
the eyes of the customer. The customer dictates specifica-
tion limits. Control limits are the expected limits of varia-
tion that is determined by the process itself.
• Think of specification limits as the voice of the customer.
Think of control limits as the voice of the process.
• Gather enough data for the 5Ms and 1P to exhibit enough
variation so that the control limits are representative of the
process.
• There are as many types of control charts as there are
processes.
Summary
Chapter 4 addresses the 10 major technical tools a project team
member uses during the time they are on a Six Sigma team. These
are not the only tools a Six Sigma team may use. However, the
tools covered in Chapter 4 are those that are most common for
every team member to be aware of and knowledgeable about.
10 Technical Tools to Master While on a Six Sigma Team 87
K
EY
L
EARNINGS
• Every Six Sigma project team utilizes a series of tools in
their work to improve sigma performance.
• The critical-to-quality (CTQ) tree helps a team identify the
needs and requirements of the customer.
•
A process map is a graphical display of the suppliers, in-
puts, process steps, outputs, and customers affecting a
project team.
•
There are four types of process maps. In the Define stage of
DMAIC, there is the map of how the process is currently
operating at the highest level. It is called the high-level pro-
cess map. In the Analysis stage of DMAIC, there is the sub-
process map. In the Improve stage of DMAIC, the team
creates the should-be map. In Design for Six Sigma, there
is the could-be map.
• The histogram is a graphical display of the number of
times a given event is seen in a set of observations. Among
its uses is telling the project team whether they are dealing
with common or special cause variation.
•
Common cause variation occurs in a process when no one
of the components of variation (machines, methods, materi-
als, measurement, mother nature, or people) has an undue
influence on the process.
• Special cause variation occurs when one or more of the
components of variation are having an undue influence on
the process.
•
The Pareto chart divides data into the vital few versus the
useful many. This is based on the concept of the 80–20 rule.
•
The process summary analysis worksheet separates value-
added from non-value-added steps in the process. The steps
are then categorized into the types of nonvalue activity.
(continued)
88 SIX SIGMA FOR EVERYONE
K
EY
L
EARNINGS
(C
ONTINUED
)
• The most common non-value-added activities are moves,
delays, set-ups, internal failures, external failures, control/
inspections, and value enabling.
•
The cause-effect diagram is a brainstorming tool that helps
teams generate factors that affect poor sigma performance.
• The scatter diagram is a tool to assist a team in establish-
ing a relationship between some factor and the response
the team is trying to improve.
• The affinity diagram is yet another tool to assist a project
team gather its thoughts. It is typically used to help a team
generate ideas to improve sigma performance.
• The run chart monitors some value over time. It should be
examined for shifts, trends, or unusual patterns.
• The control chart shows the expected level of variation for
a process variable enabling a project team to determine
when the process is no longer consistent, predictable, and
repeatable.