HANDBOOK OF CRM: Achieving Excellence in Customer Management Part 6 potx
Bạn đang xem bản rút gọn của tài liệu. Xem và tải ngay bản đầy đủ của tài liệu tại đây (1.13 MB, 45 trang )
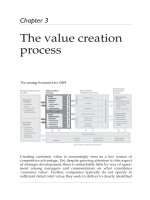
Chapter 6
The performance
assessment process
Business
strategy
• Business
vision
• Industry and
competitive
characteristics
Customer
strategy
• Customer
choice and
customer
characteristics
• Segment
granularity
Information management process
Back-office
applications
Front-office
applications
Analysis
tools
IT
systems
Data repository
Integrated channel management
Sales force
Outlets
Telephony
Electronic
commerce
Direct marketing
Mobile
commerce
Virtual
Physical
Shareholder
results
• Employee value
• Customer value
• Shareholder
value
• Cost reduction
Performance
monitoring
• Standards
• Satisfaction
measurement
• Results and
KPIs
Value
customer
receives
• Value
proposition
• Value
assessment
Value
organization
receives
• Acquisition
economics
• Retention
economics
Customer segment lifetime value analysis
Strategy development
process:
Multi-channel
integration process:
Performance
assessment
process:
Value creation
process:
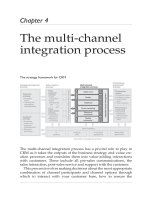
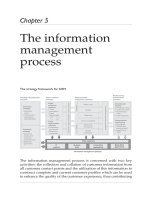
The strategic framework for CRM
The performance assessment process is the final process in the Strategic
Framework for CRM. The purpose of this process is to ensure that
the organization’s strategic aims in terms of CRM are being deliv-
ered to an appropriate and acceptable standard and that a basis
for future improvement is firmly established. As shown in the above
figure the process has a dual focus on shareholder results, which pro-
vides a ‘macro-view’ of the key drivers of CRM performance, and on
performance monitoring, which involves a more detailed ‘micro-view’
HCRM-Ch06.qxd 9/16/05 10:57 Page 283
of the key descriptors of CRM performance. This process involves
focusing on two key issues:
1. How can we create increased profits and shareholder value?
2. How should we set standards,develop metrics, measure our results and
improve our performance?
Together these issues provide an understanding of how CRM deliv-
ers shareholder results and how CRM performance can be measured
and thus further enhanced.
As emphasized throughout this book, CRM breaks with traditional
management practice in that it involves the whole organization and
emphasizes avoiding functional divides. In so doing CRM embraces
a new logic for commercial relevance: business success ultimately
derives from the creation of customer value, which is achieved
through the skilful management and development of customer rela-
tionships involving all key stakeholders. Market leaders will be those
who can demonstrate an unfailing ability continually and consis-
tently to deliver products and services that fulfil customers’ needs
and expectations and can do so in a manner that highlights organiza-
tional competencies and cost-effectiveness. This is a tall order and
demands the coordinated effort of all company members and part-
ners throughout the supply chain.
Likewise, the evaluation and enhancement of performance needs
all the required information to be supplied in a timely and accessible
manner by the information management process. This requires the
adoption of a more inclusive and comprehensive perspective. We
believe that concerns about the effectiveness of CRM solutions are a
key factor driving companies to consider CRM in this broader con-
text of business strategy and to monitor CRM performance more
carefully against specially selected criteria.
The need for a systematic approach
Historically, firms have tended to organize themselves in terms of func-
tional responsibility and thus performance measures have reflected the
individual objectives of departments or strategic business units. For
example, Finance has been driven by profit, Sales by volume and
Marketing by customer acquisition. The movement towards greater
284 Handbook of CRM: Achieving Excellence in Customer Management
HCRM-Ch06.qxd 9/16/05 10:57 Page 284
convergence and consolidation in many industries has blurred the
distinctions among the aims of traditional allocations of organizational
responsibility. More collaborative work practices have necessitated
more consultative measurement and monitoring systems. In short, a
redefinition of the business model requires a recalibration of business
performance. Because CRM is a cross-functional activity, CRM per-
formance measurement must use a range of metrics that span the
gamut of processes and channels used to deliver CRM.
As yet, there is no universally recognized system for measuring
the success of CRM. This is partly due to the fact that every CRM
programme is unique and cannot be judged identically and partly
because formalized CRM is a relatively new discipline. Although
customer relationship management is often considered the remit of
marketing as it builds on the tenets of relationship marketing, in
practice it forms part of the job of every employee in every depart-
ment. This sharing of customer responsibility compounds the diffi-
culty of agreeing specific measures that will accurately reflect CRM
performance and strategic progress.
Early attempts to measure marketing performance were largely
directed at monitoring financial outputs. These included profit, sales
and cash flow. In the 1980s, there was a realization that non-financial
measures also played a part in delivering the overall performance of
marketing. Organizations began to recognize that variables such as
brand equity, customer satisfaction and customer loyalty were very
important in transforming marketing inputs to organizational out-
puts. During the 1990s, the emphasis switched to the use of multiple
measures that would together provide a more complete picture of
marketing performance. However, this method raises difficult issues
for managers, including which measures should be included in per-
formance monitoring models and how to account for the interrela-
tionships between measures.
Clearly what is needed for the 2000s is a more definitive frame-
work that identifies the principal measures of CRM performance
and how these measures organize into a system that can be used con-
tinually to monitor, track and improve performance in support of the
CRM vision. The performance assessment process, highlighted in
the figure above, provides a structure for developing such a system
based on the following key actions:
1. Understand the key drivers of shareholder results and the significance of
the linkages between them
The performance assessment process 285
HCRM-Ch06.qxd 9/16/05 10:57 Page 285
2. Identify the appropriate standards, metrics and KPIs against which the
various CRM activities can be measured
3. Establish an effective CRM performance monitoring system to apply these
measures on an ongoing basis.
Each of these key actions is now examined in turn.
Understanding the key drivers of
shareholder results
To achieve the ultimate objective of CRM – the delivery of excellent
shareholder results through an increase in shareholder value – an
organization must maximize the main sources of revenue, profit and
growth within the context of both business and customer strategy.
The four main elements are:
● building employee value
● building customer value
● building shareholder value
● reducing costs.
The first three elements impact of three key stakeholder groups, while
the latter is a potentially significant means of directly improving prof-
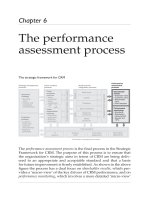
its. The development of the ‘linkage model’ or ‘service profit chain’,
1
shown in Figure 6.1, confirms the relationship correlation between
value creation and profitability, as well as the linkage between
employee value, customer value and shareholder value.
The linkage model suggests that an improvement in leadership
and management behaviour has a positive impact on employee atti-
tudes and employee satisfaction. The more satisfied and motivated
an employee, the longer they are likely to stay with an organization
and the better they will do their job. This will have a positive effect
286 Handbook of CRM: Achieving Excellence in Customer Management
Leadership and
management
behaviour
Employee
attitudes
Customer
satisfaction
Financial
performance
Figure 6.1 The linkage model
HCRM-Ch06.qxd 9/16/05 10:57 Page 286
on customer satisfaction, so customers will stay longer and generate
higher sales for the company. The result is stronger profitability and
increased shareholder value. This model provides a key logic to the
broader perspective of CRM. We will return to the model later in this
chapter.
Shareholder value, customer value, employee
value and cost reduction
Many organizations now recognize the importance of improving
their performance by managing the value input and impact of each
major stakeholder group. It is obvious that certain stakeholder
groups are more important than others. While this importance
will vary to some extent from organization to organization, three
stakeholder groups, shareholders, customers and employees have
emerged as the core focus for most organizations in terms of value
management and performance improvement. Frederick Reichheld
of consulting firm, Bain & Company, points out that these three key
stakeholders – the ‘forces of loyalty’ – are pivotal in achieving com-
mercial success.
2
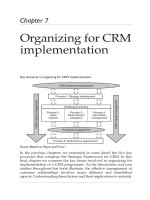
These key drivers of shareholder results are shown
in Figure 6.2. This figure emphasizes the need to consider each of
these stakeholders from the perspective of the value of the stake-
holder group to the organization and the value of the organization to
that stakeholder group.
It is useful to make a subtle distinction between building share-
holder value and achieving shareholder results. In this context, share-
holder value creation may be viewed in a more narrow sense as being
concerned with identifiable value in terms of returns on capital that
stem from initiatives such as improved customer satisfaction and
increasing customer retention, excluding stock market measures.
Shareholder results include how shareholders and the stock market
respond to these improvements in shareholder value: that is, they
reflect the stock market perspective. Research shows that sharehold-
ers take a range of non-financial measures into account when
valuing companies. For example, the ‘Measures that Matter’ study
3
suggests that on average 35 per cent of an investment decision is
driven by non-financial data. Hence, issues such as communicating a
coherent and well-planned CRM strategy may have a significant
part to play in achieving improved shareholder results.
The performance assessment process 287
HCRM-Ch06.qxd 9/16/05 10:57 Page 287
Cost reduction is an obvious source of potential increase in profits
and shareholder results. Improving efficiency and the use of lower
cost channels are common means of achieving cost reduction.
However, as we will discuss shortly it is important that this is not
done at the expense of lowered levels of customer satisfaction and
customer value.
Employee value
In addressing CRM performance it is tempting to focus immediately
on standards for CRM, metrics and key performance indicators
(KPIs). However, the need first to focus on the drivers of shareholder
results should be emphasized.
John McKean in his book Information Masters
4
made a critical
observation that typically 92 per cent of the historical investment in
CRM expenditure goes into data and technology, but these aspects
only represent 25 per cent of the competency determinants for suc-
cess. Organizations need also to make sure the other most critical
elements that represent 75 per cent of the competency determinants
for success, such as people, processes, organization, culture and
288 Handbook of CRM: Achieving Excellence in Customer Management
Shareholder value
Employees
Value
employees
deliver
to
organization
Value
organization
delivers
to
employees
Cost
reduction
Organization
Customers
Value
customers
deliver
to
organization
Value
organization
delivers
to
customers
Organization
Shareholders
Value
shareholders
deliver
to
organization
Value
organization
delivers
to
shareholders
Organization
Employee value Customer value
Figure 6.2 Key drivers of shareholder results
HCRM-Ch06.qxd 9/16/05 10:57 Page 288
leadership actively support CRM activities in a relevant manner.
McKean’s research indicates that a total of 60 per cent of the compe-
tency determinants for success involve people, organization, culture
and leadership. Thus the people element is absolutely critical in
making CRM work. These issues are discussed in more detail in the
next chapter.
Employee value needs to be considered from two perspectives –
the value employees deliver to the organization and the value the
organization delivers to employees. Further, a motivated employee
can add value to the customer.
The value employees deliver to the organization is usually meas-
ured against a number of performance objectives. Often these repre-
sent short-term goals, where employee performance is appraised
against performance targets. Employee value of this form is closely
linked to employee retention, for long-tenured employees are more
likely to know their jobs and the goals of the organization and are
thus able to be more productive.
The value the organization delivers to its employees comprises the
benefits the work force receives in exchange for the opportunity cost,
time and labour expended in performing their jobs. This bundle of
benefits includes the internal service quality created by management
practices, encompassing reward and appraisal policies, training and
development opportunities and the motivation and empowerment
of employees.
Linking employee remuneration to specific customer objectives,
such as customer satisfaction and customer retention, supports the
creation of value for both the employees and the organization.
How the company’s leadership, human resources and culture are
organized are therefore key factors in determining employee value
which, in turn, has a significant bearing on customer and shareholder
value. This is evident in the types of measures used to monitor the
value delivered by employees, for example, product quality measures,
employee turnover, recruitment costs and employee satisfaction.
Customer value
Customer value is concerned with both the value the organization
receives from the customer and the value the customer receives from the
organization. As the topic of customer value has been already dis-
cussed in Chapter 3, only a brief recap is given here.
The value the organization receives from the customer is deter-
mined by the profits obtained from the customer over the lifetime of
The performance assessment process 289
HCRM-Ch06.qxd 9/16/05 10:57 Page 289
their relationship with the organization, or their ‘customer lifetime
value’ and the economics of customer acquisition and retention.
The value the customer receives from the organization is defined
by the perceived benefits of the offer made to the customer, which
extend beyond the core product or service. These higher-level ben-
efits, or ‘added values’, emanate not from basic product features but
from intangible factors, such as the provision of better customer
service or association with a quality brand image. A number of
measures are used to monitor this aspect of customer value includ-
ing customer retention, customer acquisition costs, customer satis-
faction and customer profitability.
The key issues relating to customer value, discussed in Chapter 3,
include:
The nature of ‘the offer’ a company makes to its customer –
Customer value is an inherent part of the product or service offer
which the company can actively manage to benefit the customer.
Customers do not buy goods or services, but rather a bundle of ben-
efits in the form of product features and added value. This total
offering – or ‘the offer’, as it is commonly called – represents the
value that customers get when they buy goods or services.
The use of relationships and branding to increase customer value –
Building better relationships with customers through offering
superior customer service is one way of securing competitive advan-
tage. The use of customer service as a more important competitive
weapon derives from increasingly sophisticated customer require-
ments and the demand for ever-higher standards of service.
Developing greater customer involvement with the company’s
products is a good way to use the brand to enhance customer value.
The Harley-Davidson Owners Group, discussed in Chapter 3, pro-
vides a good illustration of this.
The value proposition – The value proposition comprises three key
steps: choose the value, provide the value and communicate the
value. Success rests on the thoroughness and innovation that goes
into developing the value proposition and communicating it
throughout the supplying organization.
The value of customers to the company – To calculate a customer’s real
worth, the company must look at the expected profit flow from the
customer over the customer’s lifetime, rather than the results this
year: the longer the customer relationship, the greater the profit per
customer.
290 Handbook of CRM: Achieving Excellence in Customer Management
HCRM-Ch06.qxd 9/16/05 10:57 Page 290
Shareholder value
The growing power and influence of financial analysts has driven
many company boards to regard the creation of shareholder value as
their primary business objective. However, the emphasis is fre-
quently placed on quarterly results rather than the longer term.
Balancing long-term and short-term returns and communicating this
balance to shareholders, is therefore becoming a priority.
Shareholder value is created by achieving a favourable rate of
return on capital invested. This can be accomplished in a number of
ways. Ian Cornelius and Matt Davies
5
have summarized the five
principal strategies that can lead to the creation of shareholder value.
These are:
1. increasing the return generated on existing capital invested
2. investing more capital where the rate of return exceeds that required
3. divesting assets which generate a return lower than that required, thus
releasing capital for more productive use
4. extending the period over which returns above the required rate are
generated
5. reducing the cost of capital.
These strategies require a ‘value based management’ approach that
emphasizes creating and maximizing the wealth of shareholders
in every aspect of the business. Such an approach involves measur-
ing and managing the following key financial variables, or ‘value
drivers’:
● the opening amount of capital invested
● the rate of return generated on capital
● the rate of return that investors require
● the growth in the value of capital invested
● the time horizon over which returns are expected to exceed those
required by shareholders.
Most of what has been written on shareholder value focuses on the
value the organization delivers to shareholders. Over the last decade
there has been particular emphasis on tools that measure share-
holder value creation and shareholder results, including economic
value added (EVA), shareholder value added (SVA), market value
added (MVA) and cash flow return on investment (CFROI). A sum-
mary of key measures of shareholder value is shown in Figure 6.3.
The performance assessment process 291
HCRM-Ch06.qxd 9/16/05 10:57 Page 291
Although there is an ongoing debate as to which technique most
accurately measures shareholder value, what is important is to
consider shareholder value in the context of the whole business and,
in particular, in relation to customer value. The specific measure-
ment of shareholder value is complex and beyond the scope of this
book. (The interested reader should consult the detailed report by
Cornelius and Davies.
6
)
Although the issue of the value the shareholders deliver to the organiza-
tion is emphasized much less, the loyalty of shareholders and other
investors is an issue of considerable importance. Frederick Reichheld
points out that shareholder churn in the average public company in
the USAis more than 50 per cent per annum and argues that managers
find it very difficult to pursue long-term value-creation strategies
without the support of loyal and knowledgeable shareholders. He
notes that many of the world’s leading companies (in terms of high
customer loyalty and high customer retention) are either privately
owned, ‘mutual’ or public companies, where there is a high share-
holder loyalty and thus a high value delivered by shareholders to the
organization.
Delivering value to shareholders is an increasing concern of CEOs.
However, an obsession with maximizing shareholder value has
sometimes led to the neglect of other stakeholder groups, causing
high employee turnover, poor quality products and services and
ultimately reduced shareholder value. It is therefore crucial that
shareholder value be viewed as a balance between immediate finan-
cial return and longer-term sustainability. This will be discussed in
the following chapter.
292 Handbook of CRM: Achieving Excellence in Customer Management
Figure 6.3 Shareholder value measures
Company Shareholder value product
LEK/Alcar Consulting Group Shareholder value added (SVA)
Stern Stewart & Co Market value added (MVA)
Economic value added (EVA
TM
)
McKinsey & Co Various methods
Marakon Associates Various methods
Braxton Associates Cash flow return on investment (CFROI)
The Boston Consulting Group Cash flow return on investment (CFROI)
Cash value added (CVA)
Holt Value Associates Cash flow return on investment (CFROI)
Source: Based on ‘Metric Wars’
7
HCRM-Ch06.qxd 9/16/05 10:57 Page 292
Cost reduction
Cost reduction can represent a good source of increase in profits and
shareholder results.
Opportunities for cost reduction lie in:
1. exploiting economies of scale
2. benchmarking best practice within and outside the industry
3. outsourcing non-core activities
4. leveraging shared activities across the organization
5. improving CRM efficiency and effectiveness.
Better information management can be a primary source of cost
reduction in CRM. For example, one large US investment bank
found they could redeploy 45 per cent of their staff in marketing,
sales and service because the time required to undertake these activ-
ities was significantly reduced through gaining a higher level of
information competency.
8
Deploying electronic systems, such as automated telephony ser-
vices, which lower costs by enabling reductions in staff and over-
heads, is an attractive potential source of cost reduction. However,
an over concentration on cost reduction as a means of delivering
shareholder results can be counterproductive if it decreases customer
value. For example, the creation of a central call centre in a bank will
help reduce costs but may disenfranchise customers who prefer to
interact with bank employees whom they know. Dealing with bank
representatives who are unfamiliar with their individual circum-
stances and banking habits can be regarded as an affront to their
long-standing status as loyal customers. A large UK bank recently
had to reverse its new policy of customers only being able to speak to
a central call centre, rather than directly to their branch, as a result of
many complaints from angry customers. Thus, any cost reduction
strategy needs to be considered in the context of its effect on cus-
tomer value.
The utilization of new electronic channels, such as online self-service
facilities on the Internet, which lower the costs of customer acquisi-
tion, transaction and servicing offers a further opportunity for cost
reduction. With its innovative web site Dell places much of the
buying process in its customers’ hands. Using the benefits of web
self-service, discussed in Chapter 5, customers can configure own
product and place their own orders. This dramatically speeds up the
buying process, improves accuracy, decreases costs of correction and
The performance assessment process 293
HCRM-Ch06.qxd 9/16/05 10:57 Page 293
problem resolution and is considerably less labour intensive for Dell.
Further, storage and distribution costs are cut because of more
timely and efficient stock management and delivery.
Achieving a productive balance between cost reduction and cus-
tomer satisfaction means understanding the value that may be cre-
ated or sacrificed in the management of the customer relationship.
This value factor constitutes a central element of CRM, for it is what
drives success in the organization. A well-managed value process
will lead to a better quality of workforce, in terms of the organiza-
tion’s ability to attract and retain highly motivated, committed and
appropriately skilled employees. Such a dedicated workforce is more
likely to deliver a better customer experience, which in turn will
deliver better shareholder value through increased sales, repeat
orders and customer referrals.
The importance of an appropriate value exchange is clear: concen-
trating on how much value (in the form of profits) an organization
can extract from its customers, without understanding what cus-
tomers value from the organization in order to provide it satisfacto-
rily, is not a sustainable strategy in today’s competitive environment.
Nor is a strategy of profit improvement through cost reduction
where cost savings are made at the expense of customer value. Thus,
an integrated approach is needed to optimize the contribution of
each stakeholder group and the opportunities for cost reduction, as
well as to exploit the linkages between them.
Linking shareholder value, employee value,
customer value and cost reduction
In addition to the profit-enhancing potential of each group’s value con-
tribution, there is potential contained in the linkages between them.
There is also an obvious connection between cost reduction and the
three key stakeholders discussed above. As Figure 6.3 suggests, cost
savings can be used to increase employee value (e.g. through investing
in staff training or job incentives), increase customer value (e.g.
through augmenting the value proposition) or increase shareholder
value (e.g. through improving ‘the bottom line’).
Conversely, improvement in these value areas can result in
substantial cost reductions. For example, an improvement in
294 Handbook of CRM: Achieving Excellence in Customer Management
HCRM-Ch06.qxd 9/16/05 10:57 Page 294
customer value may drive increased customer satisfaction, resulting
in high levels of advocacy among the customer base and consequent
savings in marketing costs. This knock-on effect is evident in organi-
zations such as First Direct, the UK bank, which acquires a third or
more of its customers through customer referrals rather than
through traditional marketing activities. Thus its acquisition costs
for each customer are significantly reduced.
We have noted above the linkage between three areas: employee
value, customer value and shareholder value – but how are they
related? The linkage model shown in Figure 6.1 gives insight into the
logic but not the specific relationships between variables within
these areas. It is not clear for most organizations how much one vari-
able needs to improve to achieve a given level of improvement in
another variable. For example, if employee attitudes and satisfaction
increase by a measurable amount, what specific impact will this
have on customer satisfaction and resulting profitability?
As discussed shortly, some leading companies are using
advanced modelling approaches to verify the exact nature of the
linkages between these sources of added value in their businesses
and use them to improve shareholder results. As the search for new
and improved ways of measuring the performance of key variables
across these critical linkages continues, organizations are recogniz-
ing the importance of addressing these higher-level drivers
before determining CRM standards, metrics and key performance
indicators (KPIs).
Developing appropriate standards,
metrics and KPIs
Despite the increasing focus in businesses on customer-facing activi-
ties, there is growing concern that the standards and metrics gener-
ally used by companies for assessing CRM performance are not as
advanced as they should be. In particular, more detailed standards,
measures and KPIs are needed to ensure CRM activities are planned
and performed effectively and that a feedback loop exists to maxi-
mize organizational learning and improvement.
As shown in the Strategic Framework for CRM, assessing CRM
performance involves a consideration of the contribution and
The performance assessment process 295
HCRM-Ch06.qxd 9/16/05 10:57 Page 295
interaction of multiple processes. The five interrelated and cross-
functional processes common to all commercial organizations are:
● the strategic development process
● the value creation process
● the multi-channel integration process
● the information management process
● the performance assessment process.
These processes centre on how the organization delivers value to the
customer while enhancing the value received by the company in
terms of shareholder results. While these processes have universal
application, the extent to which they are emphasized will vary
according to the situation of the organization concerned.
Companies need simultaneously to consider what standards
and metrics should be used by them and what are their CRM priori-
ties, given their specific circumstances. Organizations can benefit
from first learning about existing standards and metrics used by
other organizations before reinventing what others have already
done.
Standards
The lack of an internationally recognized set of standards for CRM
has hindered efforts to measure and benchmark best practice – a pre-
requisite to helping achieve improved performance in CRM. Few
companies as yet have developed their own integrated and detailed
processes for measuring CRM performance. The complexity of
measuring the many processes contributing to the success of CRM
makes this a potentially daunting task.
However, the increasing importance of CRM measurement has
recently resulted in a number of organizations developing CRM
standards for more general use. These standards typically relate to
either a complete view of CRM activity or a specific part of it. Two
of the leading initiatives are the QCi Customer Management
Assessment Tool used as a general CRM review and the Customer
Outsourcing Performance Centre (COPC) standards for customer
service centres.
296 Handbook of CRM: Achieving Excellence in Customer Management
HCRM-Ch06.qxd 9/16/05 10:57 Page 296
The QCi Customer Management Assessment
Tool (CMAT)
CMAT
™
is a proprietary assessment tool for understanding how
well an organization manages its customers. It is carried out by
trained assessors who are experienced CRM practitioners within
QCi Assessment Ltd,
9
a specialist CRM consultancy, or one of its
partner organizations.
The model is based on the following elements:
1. analysis and planning
2. the proposition
3. people and organization
4. information technology
5. process management
6. customer management activity
7. measuring the effect
8. the customer experience.
Each of these elements is further sub-divided into component parts.
For example, ‘people and organization’ covers:
● organizational structure
● role identification
● competencies definition and gap analysis
● training requirements and resources
● objective setting and monitoring
● supplier selection and management.
CMAT uses over 250 questions to assess the organization’s perform-
ance. Each question in the assessment is based on known and
demonstrable good practices from the clients of QCi and from
accepted industry benchmark organizations. A ‘scoring based on
evidence’ approach is taken to answering each question and a broad
range of people, from senior directors to operational level practition-
ers, are interviewed. The approach is specifically designed to iden-
tify clear plans, real delivery and an identifiable effect of each of the
practices questioned. In this way the all too common gap between
senior management perception of the situation and the ‘front line’
reality is often identified.
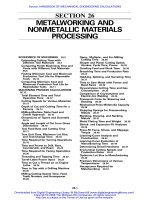
Figure 6.4 provides data for ‘United Bank’ in term of its overall
performance and eight component measures of the CMAT model. It
The performance assessment process 297
HCRM-Ch06.qxd 9/16/05 10:57 Page 297
also compares it with the overall average across all industry sectors and
also more interestingly within more direct competitors in banking,
insurance and other finance businesses. Thus United Bank can compare
itself with its competitors and also best practice across all industries.
The output of the assessment is a report and Board-level presenta-
tion that positions the organization against a relevant benchmark of
other organizations. It also provides a quartile positioning for each of
27 CRM areas into which the sections of the Customer Management
model are divided. The assessment has been carried out in over
100 organizations worldwide so provides a rich set of data for a com-
pany to benchmark its performance against.
The objective of the CMAT tool is to provide an objective and quan-
titative assessment of how well the organization currently manages its
customers with a score that correlates to business performance and
benchmarks the organization against a relevant set of other organiza-
tions. This is especially beneficial when the company can compare
itself against competitors in its own vertical industry sector, such as
shown in Figure 6.4. It also forms a clear ‘baseline’ against which
improvements delivered by a CRM programme can be measured and
provides a broad-based check that all the necessary CRM foundations
are in place before investing in specific programmes or technology.
Customer Operations Performance Centre
(COPC) Standard
Other standards focus on particular aspects of CRM in more detail.
One such approach is the COPC Standard developed by users of
298 Handbook of CRM: Achieving Excellence in Customer Management
Figure 6.4 CMAT performance benchmarking for ‘United Bank’
Overall United Insurance Other Retail
average Bank finance banking
Overall scores 32 40 28 30 41
Analysis & planning 28 28 27 19 37
The proposition 30 26 26 24 36
People & organization 38 54 31 40 49
Information & technology 37 36 32 38 46
Process management 29 36 27 36 35
Customer management activity 31 37 26 30 37
Measuring the effect 35 60 29 36 49
The customer experience 28 40 20 16 42
Source: © QCi Assessment Ltd, used with permission
HCRM-Ch06.qxd 9/16/05 10:57 Page 298
customer service centres, call centres and fulfilment services in the
USA. It was initiated by representatives of a number of leading compa-
nies – including American Express, Dell Computer Corp., Microsoft,
Novell and L.L. Bean – in response to their concerns about the per-
formance of call centre providers.
The developers of this standard believed that improvement stan-
dards could help augment service quality within a service environ-
ment, just as has been seen in manufacturing industries that employed
similar quality measures. Although some service providers used exist-
ing standards such as ISO 9000, these were orientated towards manu-
facturing industries and failed to give the operational benefits that
were needed in service businesses.
The COPC-2000 standard
10
is awarded to companies successfully
completing a formal audit measuring the effectiveness of their inter-
nal customer-facing operations. Among its aims is to distinguish
between excellent service providers and those that are mediocre,
enabling companies who are outsourcing call or service centres to
use this information before they make their purchasing decision. The
standard includes developing process specifications based on cus-
tomer requirements, so service delivery processes are customer and
not operationally driven.
The COPC standard is based on a number of well-recognized cri-
teria used in the Malcolm Baldridge Quality Award. There are four
key areas used within these standards.
● Performance standards, includes customer satisfaction, product and ser-
vice quality,employee satisfaction and supplier performance
● Processes, includes process control,supplier management, internal quality
audits and product development
● People, includes recruitment and development, compensation, recogni-
tion and the work environment of employees
● Planning and leadership, includes leadership, planning and performance
review.
Although COPC does not set specific performance objectives that
every call centre must meet, it does require that all performance met-
rics are tracked by linking them to customer satisfaction drivers. This
information is then used to improve overall call centre performance.
The aim of the COPC standard is to improve performance of all out-
sourced call centres through widespread adoption of the standards.
The measures have been widely accepted and, although call centres
The performance assessment process 299
HCRM-Ch06.qxd 9/16/05 10:57 Page 299
have often chosen not to pursue accreditation; many employ the per-
formance metrics.
While COPC is supported by many call centre providers, only a
small number have as yet been certified. The process is difficult and
costly, so some organizations are choosing to adopt the standards and
use these to benchmark their performance, without going through
the accreditation process.
While the COPC standards are designed for specific types of
organizations with a strong emphasis on customer service delivery,
they are useful as an example of an integrated approach to measur-
ing effectiveness within a key area of CRM.
Metrics
The identification of appropriate metrics is another challenge for
companies seeking to evaluate and enhance their CRM performance.
The main problem lies in determining the critical measures of CRM-
related activity that are most appropriate to the organization and
managing them effectively.
It is important at this stage to note the distinction between metrics
and KPIs. Metrics involve all those CRM-related activities that should
be measured. Key performance indicators are the high-level measures
that are critical to the success of the business and that should be
monitored closely by the Board and top management.
We consider four main categories of CRM metrics are especially
important – customer metrics, operational (employee and process)
metrics, strategic metrics and output and comparative metrics.
These key metrics represent the ‘vital statistics’ of healthy CRM, sig-
nalling the strength or weakness of the underlying CRM processes.
Other more specialized metrics may also be needed to meet specific
company requirements. In any event, these CRM metrics should be
applied regularly to provide an overall appraisal and monitoring of
CRM effectiveness.
Customer metrics
Customer metrics measure both the value delivered by the organiza-
tion to the customer and the value delivered by the customer to
the organization. They are focused around measures of customer
attitude and behaviour.
300 Handbook of CRM: Achieving Excellence in Customer Management
HCRM-Ch06.qxd 9/16/05 10:57 Page 300
Customer metrics are used to measure:
1. customer acquisition and customer retention rates
2. customer satisfaction measures
3. customer lifetime value
4. customer experience within channel and across multi-channels
5. customer complaints and seriousness of them
6. segment and micro-segment profitability
7. ‘share of wallet’
8. product density (number of products and services used by a customer)
9. customer recommendation and advocacy measures
10. increase in customer value through cross-sell and upsell.
People and process metrics
People and process metrics focus on how well the organization’s
resources are managed to optimize CRM at an operational level.
People metrics are concerned with standards used to monitor the
skills and motivation of employees in delivering the customer expe-
rience. Process metrics reflect the efficiency of the organization in
delivering CRM, including cost savings secured through process
enhancement.
People metrics are used to measure:
1. employee performance against customer service standards
2. employee satisfaction
3. employee attitudes and motivation
4. employee productivity
5. staff absenteeism
6. employee retention and employee tenure
7. recruitment costs.
Process metrics are used to measure:
1. customer service levels
2. order fulfilment
3. supplier performance targets
4. variation within key customer processes
5. new product/service development targets
6. time to market
7. process improvement targets.
The performance assessment process 301
HCRM-Ch06.qxd 9/16/05 10:57 Page 301
Strategic metrics
Strategic metrics measure the organization’s success in achieving its
business objectives within the strategic approach to CRM that has
been adopted. They measure, for example, the extent to which the
business strategies meet the required shareholder value targets and
strengthen the organization’s position in the marketplace.
Strategic metrics are used to measure:
1. shareholder value added/market value added
2. profitability and cash flow
3. returns on net assets,sales,CRM investments, etc.
4. growth rates
5. expense ratios
6. market positioning
7. innovation
8. brand equity
9. specific targets for other stakeholders.
Output and comparative metrics
Output and comparative metrics measure the output of the organiza-
tion’s CRM strategy, especially in relation to competitor activity and
recognized best practice. These comparative measures are frequently
more important than absolute measures. Sole reliance on internal
metrics can be dangerous for they provide an isolated and insular
view of the situation. For example, a market share of 20 per cent may
be advantageous if the largest competitor has a market share of 10 per
cent; however, it may be risky if the two largest competitors have
market shares of 30 per cent each. Similarly, high levels of service
quality and customer satisfaction are generally only beneficial if they
are higher than those of the competition.
Output and comparative metrics are used to measure:
1. relative profitability
2. relative market share
3. relative customer satisfaction
4. relative customer retention
5. relative employee retention and satisfaction
6. relative product or service quality
7. cost reduction
8. improvements in employee value (in terms of employee retention and
satisfaction)
9. increased competitive differentiation.
302 Handbook of CRM: Achieving Excellence in Customer Management
HCRM-Ch06.qxd 9/16/05 10:57 Page 302
Special metrics
Special metrics are sometimes used in conjunction with the four main
categories of metrics outlined above. For example, companies with
intermediaries may need to implement customer performance meas-
ures at different channel levels. Businesses with a strong e-commerce
component may need to address the different characteristics of an
Internet channel by developing specific e-metrics. Interestingly,
despite the availability of data from web channels, relatively few
companies use these data to measure and monitor the effectiveness
of their e-CRM activities.
Special e-metrics are used to measure:
11
1. stickiness (the web site’s ability to hold visitors’ attention and to get
them to become repeat users of the site)
2. focus (the scope and intensity of site visitor behaviour)
3. personalization index (how well the e-business uses personal customer
data captured during site visits)
4. lifetime value (the contribution to company profits over the duration of
the customer relationship.Measuring lifetime value is particularly impor-
tant as less valuable customers using other channels can be moved to
improved levels of profitability through using the web channel)
5. loyalty value (this includes visitor frequency, visit duration, number of
pages viewed per visit, time elapsed between the user’s first visit and
most recent visit)
6. freshness factor (how often content on a web site is reviewed and
renewed versus how frequently users visit the site).
Key performance indicators
As noted above, it is necessary to make a distinction among the met-
rics outlined above. Some of them will be relevant at an operational
level and some important at a strategic level. The latter metrics are
the key performance indicators that are critical to the success of the
business and which need to be monitored regularly at Board level.
Tim Ambler, a leading researcher on performance metrics, made
the following comment about high-level KPIs. ‘Large companies
have too many measures … Ten to 20 external metrics, plus two to
five for the internal market (employees), are enough for the Board of
a large company … Metrics and managing for value, taken together,
give the Board the information it needs.’
12, 13
The performance assessment process 303
HCRM-Ch06.qxd 9/16/05 10:57 Page 303
The outcome of Ambler’s research into the most commonly used
marketplace KPIs is summarized in Figure 6.5.
This research is of particular interest because it not only measures
companies’ use of these KPIs but also the percentage of companies
where these KPIs reach the Board. The research findings raise con-
cern as key aspects of CRM, such as customer satisfaction and cus-
tomer retention, only reach the Board in 36 per cent and 51 per cent
of companies, respectively.
Decisions regarding which CRM metrics and high-level KPIs
should be adopted for measuring the effectiveness of CRM processes
and activities should not be taken casually. Using the wrong meas-
ures or measuring the wrong things is clearly self-defeating. Many
companies will therefore need to establish a formalized system for
monitoring CRM performance in order to ensure that the right met-
rics are used to manage activities at operational level and the right
KPIs drive strategic decisions at Board level.
Multiple measures and linkage models
A relatively new development in measurement and metrics is the
use of multiple metrics and measures and efforts to identify relation-
ships between them. There has been a growing recognition of the
importance of considering multiple measures as traditional financial
accounting measures were prone to giving misleading results.
Proposals for a more balanced presentation of both financial and
operational measures have begun to proliferate.
304 Handbook of CRM: Achieving Excellence in Customer Management
Figure 6.5 Commonly used key marketplace metrics
Metric % of firms % that reach
using measure the top board
Awareness 78.0 28.0
Market share (volume or value) 78.0 33.5
Relative price (market share value/volume) 70.0 34.5
Number of complaints (level of dissatisfaction) 69.0 30.0
Consumer satisfaction 68.0 36.0
Distribution/availability 66.0 11.5
Total number of customers 65.5 37.4
Perceived quality/esteem 64.0 32.0
Loyalty/retention 64.0 50.7
Relative perceived quality 62.5 52.8
Source: Based on Ambler
14
HCRM-Ch06.qxd 9/16/05 10:57 Page 304
Arange of other models has been proposed for measuring different
aspects of enterprise-wide performance. These include the Malcolm
Baldridge award, the European Foundation for Quality Management
(EFQM) Award and The Balanced Scorecard. These models represent
systems of measures for monitoring and controlling enterprise per-
formance; additionally they act as communication devices. In partic-
ular, they emphasize the importance of measuring employee
satisfaction, customer satisfaction and business results in monitoring
business performance.
However, there are drawbacks with some of these models. For
example, although the Baldridge and EFQM quality models encour-
aged organizations to measure their performance in terms of
employee satisfaction, customer satisfaction and financial results, the
measures are not systematically linked together so as to identify the
relationships between them.
The balanced scorecard
One of the most popular attempts to provide cross-functional meas-
ures is the balanced scorecard approach developed by Robert
Kaplan and David Norton.
15
Their approach advocates the combina-
tion of four different perspectives of performance:
1. the customer perspective, which focuses on how the customer sees the
organization
2. the internal perspective, which identifies what an organization must excel at
3. the innovation and learning perspective,which focuses on how an organiza-
tion can improve and create value and
4. the financial perspective, which considers how an organization appears to
its shareholders.
The ‘balanced scorecard’ has become an important part of many
organizations’ CRM activities as it contains a customer outcome
dimension. However, the mixed focus of the scorecard approach can
lead to inadequate levels of customer-responsiveness and lethargic
change-management initiatives. The developers of this model also
point out that companies need to create their own unique scorecards
which reflect the nature of their own businesses and key priorities.
In the same way, CRM performance measurement needs to be
approached in an appropriately tailored way. Later in this chapter
we show how the balanced scorecard criteria can be used to create a
tailored success map for a specific organization.
The performance assessment process 305
HCRM-Ch06.qxd 9/16/05 10:58 Page 305
Linkage models and the service-profit chain
Linkage models illustrate the relationships between employees, cus-
tomers and organizational performance. The service-profit chain
model shown in Figure 6.6, the best-known version of the linkage
model, establishes the relationships between profitability, customer
loyalty and employee satisfaction, loyalty and productivity. The
researchers have described their model, as follows:
The links in the chain, which should be regarded as propositions,are as
follows:Profit and growth are stimulated primarily by customer loyalty.
Loyalty is a direct result of customer satisfaction. Satisfaction is largely
influenced by the value of services provided to customers.Value is cre-
ated by satisfied,loyal and productive employees.Employee satisfaction,
in turn,results primarily from high-quality support services and policies
that enable employees to deliver results to customers.
16
The service-profit chain model has shown how the linkages
between these metrics are related and how KPIs can be leveraged to
secure improved results. Advances in economic statistical modelling
can now enable companies to identify the various relationships with
greater accuracy and determine where improvements can most prof-
itably be made. This work has been pioneered by the international
consultancy CFI Group,
18
founded by University of Michigan econo-
metrician Claes Fornell.
306 Handbook of CRM: Achieving Excellence in Customer Management
Internal
service
quality
Employee
satisfaction
Employee
retention
Employee
productivity
External
service
value
Customer
satisfaction
Revenue
growth
Profitability
• Workplace design
• Job design
• Employee selection and
development
• Employee rewards
and recognition
• Tools for serving customers
• Service concept:
results for
customer
• Service designed
and delivered to
meet targeted
customers’ needs
• Retention
• Repeat business
• Referral
Customer
loyalty
Source: Based on Heskett et al.
17
Figure 6.6 The service-profit chain
HCRM-Ch06.qxd 9/16/05 10:58 Page 306
However, although the concept of using a linkage model is poten-
tially very attractive, there are still relatively few examples of com-
panies who could be described as ‘advanced’ in terms of adoption of
such an approach. This finding may not be surprising as very few of
the companies involved in the original service-profit chain research
had explored all the linkages across the model, let alone used causal
techniques of measurement. The two case studies in this chapter
show examples of leading companies who have pioneered this
approach – one from the business-to-consumer sector and one from
the business-to-business sector.
The first case study on Sears, Roebuck & Company, the leading US
department store, is one of the most outstanding exemplars of the
use of this approach. Sears used a modified version of the service
profit chain to predict and manage performance and shareholder
results.
The performance assessment process 307
Case 6.1 Sears, Roebuck & Company – Case
study overview
Sears has held a position of eminence in the US retail sector for over
100 years. During this period, it has become a household name, with
Americans associating it with quality and value. However, over the last
decade or so, Sears has had to fight hard to overcome the difficulties of a
mature market and adverse trading conditions.
This case study examines events over the last ten years. It focuses on
how the senior management approached the situation facing the
company in the 1990s, when Sears faced gigantic financial losses. Their
remedy included adopting a new approach to managing business per-
formance. They developed a model that links the performance of man-
agement, employees and customers directly to company profits and so
provides some important insights into the value of adopting CRM.
This case study shows how effective CRM depends not only on man-
aging relationships with customers, but also with other important stake-
holders. It describes the roles played by three stakeholder groups:
employees (including senior management and employees), customers
and suppliers. The CEO and his top team recognized that to implement
successful CRM, it was necessary to change the behaviour of its senior
managers. The leadership skills of managers were responsible for the
culture of Sears and this had an important impact on revenues.
Sears acknowledged that successful relationships with customers
are dependent upon successful management of employees. Senior
HCRM-Ch06.qxd 9/16/05 10:58 Page 307