Cẩm nang dữ liệu không dây P12 pps
Bạn đang xem bản rút gọn của tài liệu. Xem và tải ngay bản đầy đủ của tài liệu tại đây (628.07 KB, 31 trang )
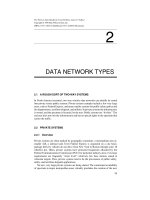
III
BUSINESS 102:
OTHER THINGS ARE
IMPORTANT TOO
The Wireless Data Handbook, Fourth Edition. James F. DeRose
Copyright © 1999 John Wiley & Sons, Inc.
ISBNs: 0-471-31651-2 (Hardback); 0-471-22458-8 (Electronic)
12
COVERAGE VERSUS
CAPACITY
12.1 INTRODUCTION
Paraphrasing the late Tip ONeill: All coverage is local. With 1214-in. full
wavelengths it is quite possible to encounter an ARDIS, BSWD, CDPD, or circuit
switched cellular dead spot simply by walking to another position in a room.
This annoying fact does not mean that all carriers operating near the same
frequency band offer essentially the same coverage choices. Design trade-offs are
made between area coverage and its close cousin, building penetration, versus
subscriber capacity. These trade-offs flow from fundamental decisions on channels
allocated for data versus control, channel reuse philosophy, base station quantity and
location, transmit power levels, FM capture exploitation, bit rates, and message
redundancyto name just a few.
Each of these decisions can cloud the certainty of coverage comparisons. ARDIS
configures minimal infrastructure for maximum in-building penetration at the cost of
subscriber capacity. For roughly equivalent geography, BSWDs technical choices
predispose it toward maximum subscriber potential at the cost of some penetration.
CDPD is not closely comparable to either ARDIS or BSWD because, in a
full-blown implementation, it would deploy
many
more base stations, each with a
dedicated channel, thereby achieving both high capacity and good penetration. But
carriers are hesitant about the cost of a CDPD deployment of that scope. Bell
Atlantic Mobile has stated
1
: CDPD will be offered in markets where it is expected
to be commercially viable, although equipment will not be installed at all cell sites
in those markets.
This uncertainty does not mean that coverage is simply unknowable without
comprehensive field tests. A great deal can be accomplished, without the special
171
The Wireless Data Handbook, Fourth Edition. James F. DeRose
Copyright © 1999 John Wiley & Sons, Inc.
ISBNs: 0-471-31651-2 (Hardback); 0-471-22458-8 (Electronic)
knowledge of a radio engineer, by analysis of site location licenses, judicious use of
vendor coverage maps, and ZIP code predictors. Not all carriers make these tools
available, and there are often quality variations in those that do exist. The base station
license and vendor coverage map techniques are most effective when judging
relatively wide geography such as an entire county. At their weakest these simple
methods permit the user to confine field testing to likely trouble spots. At their best
they are often powerful enough to be excellent predictors of coverage, eliminating
much tiresome, labor-intensive work.
Ultimately, some field tests are required to prove contract coverage in specific
areas. For a prospective user these tests need not be laden with instrumentation. Far
simpler techniques can give the thoughtful reviewer valuable insight into coverage
and retransmission performance that tends to vary with message length.
Since 1994 JFD Associates has conducted coverage and building penetration tests
at roughly six-month intervals on ARDIS, BSWD, and, later, CDPD. There are also
public domain summary reports from users such as Pitney-Bowes and
Schindler/Millar elevator, as well as carrier reports from BSWD. Illustrative extracts
from these sources are used in this chapter.
12.2 KEY COVERAGE PHILOSOPHIES
12.2.1 ARDIS
ARDIS employs each channel in a given area in single-frequency reuse (SFR) mode.
As the user moves from one single channel cell to another, the device remains tuned
to the same frequency. Higher level logic determines which base station will work
with the device. Its 90% coverage areas are deliberately designed
not
to overlap, as
illustrated in Figure 12-1.
Since ARDIS employs SFR, the area of reduced coverage probability between two
adjacent cells can be exploited. Extending beyond the solid 90% line are areas of
ever-decreasing coverage. The 70% curve is portrayed as a dotted line.
Where two of these 70% zones overlap, the effective coverage is 90% since the user
can be handled by either of two base stations. The explanation is straightforward:
When in an overlap zone there is a 30% probability that the user cannot be heard by
cell A; the same 30% probability extends to cell B. But the probability that the user
will not be heard by
either
cell A or B is 0.30
2
= 9%. The probability that the user
will
be heard by at least one base station is thus 91%.
Note that there are scattered areas in which the probability of success is very high
(shown here as triple-coverage zones). The proper siting of base stations can cause
these areas to become quite rich, thus improving building penetration. As an
illustration, the typical user transmission in Chicago is heard by 8 to 10 base
stations.
2
Clearly not all these base stations hear with anything like a 70%
probability, but there is always some finite chance that a message that would be missed
by BSWD or CDPD will be picked up by ARDIS.
172
COVERAGE VERSUS CAPACITY
When ARDIS adds a new channel, a new base station is typically installed at the
same physical site. Stamford, Connecticut, has such an overlay. When the device
modem is powered on, it listens first for an RD-LAP channel. If found, it begins
operation there. Lacking RD-LAP, it will switch to MDC4800. As the device moves
around, or as channel loads/conditions vary, it is quite possible to receive sequential
packets from the same message on different channels, some RD-LAP, some MDC.
These layers of channels are currently highest in metropolitan New York with a total
of eight 25-kHz-wide channels.
12.2.2 BSWD
BSWD has a cellularlike base station siting plan, though on a smaller scale.
Omnidirectional cells are grouped in clusters; no two cells in the same cluster employ
the same frequencies. The initial goal was to provide a 90% or greater probability of
street-level coverage. With the drive toward two-way paging, the goal has evolved to
coverage comparable to one-way paging, nationwide.
3
BSWDs base station density does not approach that of cellular. As an example, in
March 1998 BSWD had only 26 base stations in the entire state of Connecticut. There
are other helper sites along the Massachusetts, New York, and Rhode Island
borders. Since Connecticut is very small, about 5000 square miles, the
average
cell
radius for just the 26 Connecticut base stations is ~7.8 miles. This is not the same
Figure 12-1
ARDIS base station siting (representative).
12.2 KEY COVERAGE PHILOSOPHIES
173
design criteria as, say, metropolitan voice cellular, which sometimes operates with
1/2-mile-radius cells and microcells.
Naturally the sites are not uniformly distributed. BSWD has 12 of the 26 located
just in Fairfield County to improve Interactive Pager (I@P) coverage for the Greater
New York metropolitan area. Fairfield County is ~435 square miles, so the average
cell radius drops to ~3.4 miles in this densely populated sector.
BSWD has stated that it is able to reuse (each channel) easily four times.
4
This
requires a broad geographic spread employing perhaps 30 base stations. While the
reuse figure has been disputed, in this analysis BSWDs claim is accepted as correct.
Thus, say, Los Angeles County has ~4 channels per cell and 7 cells per cluster. The
90% coverage lines of each cell in the cluster overlap to ensure smooth hand-off. An
overly simplified representation of BSWDs base station siting is shown in Figure
12-2; the principal hand-off areas from the central base station are designated H.
12.2.3 ARDIS Versus BSWD: Representative 90% Coverage Contours
The resulting 90% area contours are depicted in Figure 12-3. The key point is that for
approximately the same geographic area coverage contours are always somewhat
different. There will be locations in which BSWD will operate and ARDIS will not,
and vice-versa. Note that in this example BSWD requires more cells to achieve
roughly the same 90% area coverage.
Figure 12-2
BSWD base station siting (representative).
174
COVERAGE VERSUS CAPACITY
12.2.4 Improving Building Penetration with More Base Stations
BSWD is clearly on a path to enrich its infrastructure for two-way paging building
penetration. One must be wary about carrier base station counts; they seldom
correspond to geographic locations. ARDIS counts each new frequency deployed at
the same physical location as an additional base station. BSWD counts two
transceivers at the same location as two base stations. Nevertheless, BSWDs August
1998 claim of 1900 installed base stations
5
probably brings it to a parity position with
ARDIS in unique site locationsand BSWD is growing its infrastructure more
rapidly than ARDIS. Further, BSWD is focused on ~160 fewer cities, each of which
costs ARDIS a base station. In selected areas, BSWD likely has more actual base
stations than ARDIS.
An interesting example is Fairfield County, Connecticut. BSWD has 12 physical
locations; ARDIS has only 9. As noted in Section 12.2.3, BSWD probably requires
Figure 12-3
Comparative areas of 90% coverage.
12.2 KEY COVERAGE PHILOSOPHIES
175
more base stations to achieve parity in an equivalent area. Field tests at 48 street-level
locations in Fairfield County during January 1998 show that ARDIS and BSWD have
equivalent, and very good, street-level coverage.
Additional tests revealed that ARDIS had ~6% coverage edge in totally enclosed
buildings. Continued enhancements in BSWD infrastructure would tend to offset any
building penetration shortfall. Very large additions might permit it to outperform
ARDIS and gain more capacity as well. But one must be mindful of the rules of plane
geometry. If BSWD drove its infrastructure to 18 locations, doubling the number of
ARDIS sites, the average cell diameter would only fall from 3.4 to 2.8 miles. This is
a significant reductionand would surely be pleasantly noted by BSWD usersbut
this major investment would not result in microcells.
12.2.5 CDPD
CDPD, using the same physical locations (and, e.g., antennas, T1 lines) as voice
cellular, follows the voice cochannel reuse rules. In metropolitan areas where CDPD
build-out is most complete, this means a trisectored layout. Hand-offs occur in the
zones marked H, as shown in Figure 12-4.
The hand-off threshold varies somewhat by carrier; the right user device is key. In early
BAM dedicated channel implementations, using the PCSI PAL phone, it was possible to
be in the central hand-off area and be unable to transmit or receive. Putting the phone in
diag mode, one could watch the hunt: channel 721, 555, 729, 721, 555, . . .unable
to decide which channel was the best! Now BAM has time and dBm selection
Figure 12-4
CDPD trisectored base station siting (representative).
176
COVERAGE VERSUS CAPACITY
thresholds. Every 90 seconds the device listens for alternatives. If the other channels
that can be heard are not 8 dBm better than the current channel, no switching occurs.
12.2.6 Other Coverage Considerations
12.2.6.1 Transmit Power Levels
12.2.6.1.1 ARDIS
Pre-ARDIS, the KDT-800 device used in IBMs Field Service
system had a transmit power of 4 watts. Much of this energy was wasted because the
hand-held brick had internal antennas (this was a dual-diversity receive unit). As the
infrastructure was enriched, succeeding internal antenna devices such as the KDT-840
had their output power reduced to 3 watts. This level remains the upper limit for
vehicular devices employing, say, Motorolas mobile radio modem (MRM) line of
modems.
With the coming of frequency-agile, hand-held devices a design trade-off was
made. The power-hungry synthesizers, which replaced simple crystal cut oscillators,
drew so much current at the 3-watt transmission level as to make battery life
unacceptably short. Regrettably for some users who treated their devices carelessly,
the antenna would have to be external. The trade-off was a reduction in output power
to 1.5 watts and longer battery life. This is the usual output power level for ARDIS
hand held devices.
The Interactive Pager (I@P) returned to an internal antenna located inside its
flip-top lid. The transmit power level was also eased down to 1 watt. Performance is
good with the lid open. It has been reported that IBM Field Service people who
normally work with the lid closed encounter reduced coverage as compared to the old
KDT-800.
12.2.6.1.2 BSWD
The Ericsson infrastructure employed in the original RAM
deployment had poor receive sensitivity, which limited the optimum radius of the base
station to ~5 miles (115 dBm laboratory capability).
6
In 1997, to prepare for the
coming of the I@P, BSWD began to retrofit all existing base stations to improve the
receive sensitivity to 121 dBm. This pushed their effective radius to ~7 miles.
Because of these early restrictions, the original external modems for portable users had
a transmit power of 2 watts AND an external antenna. The version of the I@P built
for BSWD also has 2 watts transmit power.
The higher transmit power requirement forced Ericsson, then subsequent vendors,
into excellent battery-saving techniques. They are among the best available today.
During one 14-day test I transmitted 157 messages each on both an ARDIS and a
BSWD I@P. The ARDIS unit was an early version, and there was actually a bit of
extra traffic on it, but that does not justify the very different results. I was forced to
replace ARDIS I@P batteries three times during the 14 days; I never changed the
BSWD I@P batteries. (
Note
: In some heavy usage CDPD tests external modem
batteries must be changed every 23
hours
).
12.2 KEY COVERAGE PHILOSOPHIES
177
All BSWD I@P tests were performed with lids open. A lids-closed test might
have revealed shortcomings, but it is a moot point since, in August 1998, BSWD
announced the availability of the no-lid RIM I@P950.
12.2.6.1.3 CDPD
After early consideration of 256 discrete power levels,
CDPD settled on the same range as its voice cellular counterpart. Except for
expensive, multipurpose vehicular units, CDPD modems generally operate with a
maximum transmission power of .6 watts, identical to hand-held voice phones.
This is generally satisfactory in richly endowed urban areas with small-diameter
cells. In the period 19951996, before some urban areas were optimized for
portable phones, CDPD performance was very poor. The lack of power is still
evident along many interstates that are really designed for 3-watt vehicular
devices. Very large, very troublesome coverage holes often appear in this
situation.
Figure 12-5
ARDIS RF coverage contours: Naples, Florida.
178
COVERAGE VERSUS CAPACITY
12.2.6.2 External Antennas
Another technique to extend the coverage area of
packet modems is to use external antennas without an increase in transmit power. The
use of an external mag mount antenna in my office improves CDPD signal strength
by about 20 dBm. Naturally, these improvements are terrain dependent. In the flat
geography of Florida the effects can be quite pronounced. Figure 12-5 shows the
improvement in the 90% ARDIS coverage area when a mag mount antenna is
employed with a PM100D class modem. The 90% coverage line extends an additional
5 miles from the base station center. Note, also, that coverage does not suddenly
vanish after the 90% contour curve is reached. Some success will be had at even
greater distances.
This technique is often employed with over-the-road trucks having multiprotocol
modems that feature satellite connections. Extending the terrestrial coverage
markedly lowers the higher cost satellite bills.
12.2.6.3 Repeaters
In some countries bidirectional amplifiersor
repeatersare used to extend coverage into areas without base stations. This
technique is used in Germanys DataTAC system, for example. The use of repeaters
in the United States tends to be limited to frequencies below 450 MHz. If selected
carriers did gain FCC approval for repeaters in the 800/900-MHz bands, coverage
might well be extended into rural areas.
12.3 ESTIMATING COVERAGE WITHOUT FIELD TESTS
12.3.1 License Examinations
For years most carriers filed a radio station license with the FCC. Reference copies are
available to all U.S. citizens for a nominal fee. The copious information on these
licenses includes a number of facts that can help a coverage analysis, including the
base station:
1. Address (street, city, county, state)
2. Latitude/longitude
3. Output power (watts)
4. Effective radiated power (watts)
5. Antenna height (meters)
Recently, BSWD license facts have become more difficult to check. BSWD
administratively canceled its licenses as a part of the 900-MHz auction process by a
letter to the FCC on September 26, 1996.
7
However, even purged records are still
public information. Much of the data can still be recovered. A listing of base station
sites for ARDIS and BSWD in Connecticut is contained in Appendix I. With position
12.3 ESTIMATING COVERAGE WITHOUT FIELD TESTS
179
information in hand, it is quite easy to plot base stations in a particular area of interest
to see how the paper coverage compares.
Figure 12-6 is a plot of ARDIS coverage in part of New Haven County using a
7-mile radius for the 90% coverage reach of the base station. This is probably an
overstatement of the radius since each ARDIS base station simply does not have to
Figure 12-6
Representative ARDIS base station locations: New Haven county, CT.
180
COVERAGE VERSUS CAPACITY
cover that much territory with 90% power. However, it is easier to represent than
plotting 70 and 90% curves.
Figure 12-7 is the identical layout for BSWD, also using a 7-mile radiusthe
stated capability of a retrofitted base station.
Figure 12-7
Representative BSWD base station locations: New Haven county, CT.
12.3 ESTIMATING COVERAGE WITHOUT FIELD TESTS
181
A cursory look at these plots indicates that ARDIS will likely have better
in-building coverage in Hamden/New Haven. Indeed, this seems to be true. In
side-by-side testing during January 1998, BSWD hit 6 for 6 on street and 3 for 3 in
buildings with large windows. But when severe conditions were attemptedinside a
closed stairwell, an elevator, the ancient stone City Hall, a Yale University building,
or the back room of a restaurantBSWD failed all five while ARDIS was completely
successful.
12.3.2 Coverage Maps
Most carriers provide coverage maps that are easily accessible on the Web. The
quality of these maps ranges widely: some useless, some misleading, a few that are
useful. There is still value in examining them, even when the greatest payoff is in
understanding what is
not
mentioned. A representative sampling of each class of
coverage map follows as a guide for more determined study.
12.3.2.1 Obfuscation, Not Illumination
The first class of maps are those that
seem to reveal something but, upon closer study, provide very little real insight into
realistic coverage expectations. The maps are generally blobs or clouds of a rather
large geographic area. No ability is given to the user to zoom in on specific cities. No
map scale is present for orientation, and geographic landmarks are generally limited
to interstate highways. The coverage blobs are not identified as either contours for
higher powered mobile devices or the more limited range portable or hand-held units.
Examples of this breed include:
1.
Ameritech
(Figure 12-8): There are only four maps in the entire repertoire. The
southwestern Ohio area, spilling over into Indiana and Kentucky, embraces
~20,000 square miles. One can guess at the main coverage by tracing the
Interstates on a road atlas. But there also odd splatter patterns around
Washington Court House south to Greenfield and near the Hocking State Forest
(I think; no towns or natural landmarks are on the map).
2.
GTE Mobile
(Figure 12-9): These maps have a scale and cover more limited
areas, typically ~6500 square miles, which is about 30% more land area than
the entire state of Connecticut. But since there is little detail, one is unsure
about, say, the San Mateo county edges in the San Francisco/San Jose map. Are
Saratoga and Los Gatos in or out? The map does not say.
3.
Bell Atlantic Mobile
(Figure 12-10): BAMs maps are especially disappointing
since they initially began with considerable detail. Individual base stations were
identifiable by the separated circles or arcs. Areas without any coverage were
clear. In a retrograde action BAM threw out all the detail and replaced it with
crude area maps like those shown for the New York City metropolitan area, an
area of 7600 square miles.
182
COVERAGE VERSUS CAPACITY
12.3.2.2 Useful But with Careless Errors
The second class contains scaled,
sequential maps of ever-increasing detail, often to less than 50 square miles. Not only
interstate highways but also secondary state and county roads often appear. The
primary example of this category is ARDIS. One can progress from the 50 United
States and its territories down to towns of less than 5000 people. An example is shown
in Figure 12-11.
This particular base station is a low-elevation gap filler. During September 1998
field tests the signal strength was 74 dBm inside the windowless barroom of the
225-year-old Griswold Inn in downtown Essex. Two miles away, at the intersection
of Route 9 and I-95, it was 104 dBm. Three miles away, west along I-95, the RSSI
was 111 dBm. Contact was lost at the 4-mile mark.
There are problems with the ARDIS coverage maps. First, they do not state
what to them is obvious: ARDIS contractually guarantees 90% probability of
success for hand-held devices operating within its coverage contours. That is what
the maps depict, but the legend says nothing about this crucial piece of
information.
Second, the map maker (American Digital Cartography) sometimes makes
ridiculous errors. The expansion view for New London shows the path of the
Unionville
Center
Piqua
Westerville
Springfield
Fairborn
Middletown
Richmond
Hamilton
Walton
Covington
Dillsboro
Fairfield
Jeffersonville
Kettering
Gahanna
Kirfersville
Lancaster
Columbus
Cincinnati
Dayton
75
71
74
70
75
71
71
Figure 12-8
Ameritech: Southwestern Ohio CDPD coverage (8-26-98).
12.3 ESTIMATING COVERAGE WITHOUT FIELD TESTS
183
Morgan Hill
Campbell
Sunnyvale
Pacifico
015
Miles
30
Hayward
Fremont
San Bruno
San Ramon
Berkeley
San Rafael
Novato
Petaluma
Vallojo
Napa
Fairfield
Pleasant Hill
Artison
Walnut Creek
Danville
Livermore
Pleasanton
San Mateo
Palo Alto
San Jose
San Francisco
San Francisco/San Jose GTE CDPD Service
GTE CDPD Coverage
Oakland
101
680
580
80
5
99
Figure 12-9
GTE Mobile: San Francisco Bay Area CDPD coverage (8-26-98).
White Plains
Commack
Brentwood
Hicksville
Hampstead
West Babylon
Freeport
NEW YORK
Jersey City
Bayonne
Bellport
Old Field
Cutchogue
Springs
Hampton Bays
Pine Valley
Wading River
495
87/287
95
0 7.5
Miles
15
Figure 12-10
BAM: Greater New York City metropolitan area coverage.
184
COVERAGE VERSUS CAPACITY
Orient Point ferryright over dry land (see Figure 12-12). The Thames, a wide,
deep river that is home for the Atlantic submarine fleet, is completely missing. The
river should bisect the map from north to south and provide important orientation.
Errors of this type harm the utility of what otherwise could be an excellent
customer tool.
12.3.2.3 Misleading
In the final class are those maps that seem to deliberately
lead the viewer to the wrong conclusion. Examples include:
1. AT&T Wireless: In Connecticut, CDPD coverage is provided by BAM or
SNET. Yet one can call up AT&T coverage maps for Connecticut cities whose
contours are identical to BAMs. That is because it actually
is
BAMs coverage, not
their own (which does not exist). The AT&T map is shown in Figure 12-13.
Preconsolidation, the service providers for New York City and Long Island were
AT&T Wireless (A side) and NYNEX (B side). When NYNEX was absorbed by
Essex
01
Miles
2
Rt 9
US 1
I-95
I-95
ARDIS Coverage
Cities and Towns
Water Features
Airports
US & State Highways
Interstate Highways
Coverage areas on this map
are representative of ARDIS
coverage. Actual coverage
may vary due to terrain,
building density, or other
environmental conditions
N
S
EW
ADC WorldMap data used with permission from American Digital Cartography, Inc. You can freely distribute any printed materials made from
this ADC WorldMap derivative product as long as you include this note and the following:
ADC WorldMap is copyrighted by American Digital Cartography, Inc.; 3003 W. College Avenue; Appleton, WI 54914-2910; Phone: 414.733.6678.
ADC WorldMap is a registered trademark of American Digital Cartography, Inc.
ARDIS
Coverage
Atlas
Figure 12-11
ARDIS: Essex, CT, coverage.
12.3 ESTIMATING COVERAGE WITHOUT FIELD TESTS
185
BAM, its A side Connecticut users commuting to New York City had to be
programmed to switch from A to B or AT&T Wireless got the business. This should
be taken literally; one can be stung by unexpected roaming charges. When an AT&T
CDPD user roams from Long Island (New York metropolitan area) to Connecticut,
BAM provides the service. The user pays a roaming fee. There is no intercarrier
agreement between AT&T and BAM for Connecticut.
8
BAMs explanation is
straightforward: we want our customers to use our own system. The extra charges
are not mentioned in the AT&T coverage map.
2. BSWD: Does some things exactly right. Its maps uniquely depict both portable
and mobile coverage. Further, one can search by state and specific cities within the
state. However, the resulting maps are disappointingly coarse, rarely depicting
anything less than ~2000 square miles. This coarseness disguises dissembling. If
Macallen, Texas, is called up, one is rewarded with a correctly titled, circular coverage
map. Unfortunately, those who had trouble with grade school geography will tend to
think Macallen is in the center of the blob. In fact, Macallen is 35 miles west of
Harlingen and has no BSWD coverage. See Figure 12-14.
Figure 12-12
ARDIS: New London, CT, map errors.
New London
Groton
GROTON
NEW LONDON
Thames River
FERRY
01
Miles
2
US 1
US 1
Rt 85
Rt 32
Rt 12
I-95
I-95
I-395
ARDIS Coverage
Cities and Towns
Water Features
Airports
US & State Highways
Interstate Highways
Coverage areas on this map
are representative of ARDIS
coverage. Actual coverage
may vary due to terrain,
building density, or other
environmental conditions
N
S
EW
ADC WorldMap data used with permission from American Digital Cartography, Inc. You can freely distribute any printed materials made from
this ADC WorldMap derivative product as long as you include this note and the following:
ADC WorldMap is copyrighted by American Digital Cartography, Inc.; 3003 W. College Avenue; Appleton, WI 54914-2910; Phone: 414.733.6678.
ADC WorldMap is a registered trademark of American Digital Cartography, Inc.
ARDIS
Coverage
Atlas
186
COVERAGE VERSUS CAPACITY
If Alexandria, Louisiana, is sought, it is very hard to tell that it is completely off
the map, 80 miles northwest of Lafayette on I-49 (see Figure 12-15).
In short, BSWD maps are perfect example of the reason for Ronald Reagans old
maxim: trust, but verify.
12.3.3 ZIP Code Predictors
It is virtually certain that all carriers have internal tools that yield the probability of
coverage by ZIP code. ARDIS and BSWD predict both in-building and on-street
coverage by ZIP code and provide this information as part of their customer bids.
AT&T Wireless apparently only has on-street coverage predictions; at least that is all
that will be externally shared.
9
Some carriers, ARDIS is one, provide ZIP code prediction tools to all relevant
partieseven consultants! As would be expected, one is immediately wary of a
carrier-provided tool. In my own case, I called up ARDISZIP, entered my own ZIP
code, 06902, and received the prediction shown in Figure 12-16. The in-building
probability prediction: 95.48%.
I immediately did 17 in-building tests within this ZIP code, from train station
tunnels to doctors waiting rooms, to the insides of supermarkets. Sixteen of the
Hartford
New Britain
Torrington
New Preston
Waterbury
Naugatock
Canaan
Salmon Brook
Enfield
Wilmington
Willimanic
Norwich
New London
Montauk
Middletown
Meriden
Danbury
Stamford
Norwalk
Putnam
New Haven
Bridgeport
NEW YORK
CONNECTICUT
LONG
ISLAND
SOUND
Connecticut Wireless IP Coverage 4/98
84
95
95
84
91
91
384
395
684
202
44
44
7
7
6
15
8
4
2
11
9
Figure 12-13
AT&T Wireless “Connecticut” coverage.
12.3 ESTIMATING COVERAGE WITHOUT FIELD TESTS
187
Brownsville
Bayview
Harlingen
Matamoros
77
83
Figure 12-14
BSWD: “Macallen,” TX, coverage.
MS
LA
New Roads
Baton Rouge
Lafayette
New Orleans
59
10
10
40
30
Figure 12-15
BSWD: “Alexandria,” LA, coverage.
188
COVERAGE VERSUS CAPACITY
17 were successful: 94.1% versus 95.5% predicted. Maybe I had something here! In
fact, the ZIP tool has proven to be an extraordinarily good indicator of coverage.
If the ZIP code prediction is off the mark, it does not necessarily mean a poor
sample size. When I consistently received much lower than expected results in the
Groton/New London area, I reported this fact to ARDIS. The Motorola
maintenance force reported the base station on spec. The coverage results
remained dismal. ARDIS network management people were dispatched and found
that a new building had been erected beside the base station. It was on spec all
right, but blasting much of its energy into a brick wall. An exculpatory comment:
Groton/New London has fallen on terrible economic times with the cancellation
of virtually all submarine contracts. Message traffic has declined precipitously as
users moved away. The practical existence of the problem had thus been somewhat
masked.
Since that time results of other user field tests have been reported. An extract from
the Schindler/Millar Elevator report is summarized in Table 12-1, which indicates that
every prospective user should begin the coverage analysis problem with a ZIP code
prediction tool.
Figure 12-16
ARDISZIP prediction: zip code 06902.
12.3 ESTIMATING COVERAGE WITHOUT FIELD TESTS
189
12.4 FIELD TESTS
12.4.1 Simplified Approaches
Analysis is great, but do field tests support the analytic conclusions? The general
answer is yes. The JFD Associates field tests
10
conducted through the years employ
no engineering tools. Instead, carrier-supplied devices are used to transmit
fixed-length, canned messages via E-mail. If response time is not a consideration, the
traffic can be sent to a large-scale system, such as a CompuServe account, for later data
reduction. Internet transfers also permit messages to flow between devices, a
convenient way to generate incoming traffic.
If the carrier is cooperating fully and will provide a post test transaction log, a
swifter approach is to send the same canned traffic to yourself. Response time goes
from minutes to seconds, speeding up the entire process, and each message transmitted
results in a paired receipt, doubling the traffic in the already shortened test time.
To simplify decisions, arbitrary ground rules are fixed. For example, the device is
turned off at the end of each test. After moving to the new location, the device is
powered on. Failure is declared if the device fails to register within 5 minutes or,
having registered, is unable to successfully complete message transmission within 5
minutes.
Since the tests have been ongoing, the device mix has steadily changed. ARDIS has
gone from the external InfoTAC to the PC-Card PM100D to the I@P. BSWD has
gone from the external Mobidem to the InfoTAC to the I@P. CDPD has moved from
internal Ubiquity modems to PALphones to both external and internal Sierra modems.
Device choices impact test results. It seems clear that BSWD performed better with
the Motorola InfoTAC than it did with the Ericcson Mobidem. But BSWD was
steadily enriching its infrastructure during these intervals; the impression could be
erroneous. It is best to test device for device, as in comparative I@P trials.
Gradually one learns what not to test. Without a speedometer readout, high-speed
vehicular tests are futile. One should note totally enclosed, versus windowed
in-building, tests, but not make too fine a point on how far away the windows are.
Longer (1000-byte) messages tend to fail a bit more often than 250-byte messages, but
Table 12-1 Schindler/Millar elevator in-building predicted versus actual results
ARDIS BSWD
Predicted Actual Predicted Actual
Percent coverage (weighted) 88 86 76 72
Number of locations 71 71 47 47
Number of test points 231 231 155 155
190
COVERAGE VERSUS CAPACITY
the tiny percentage difference is not worth the extra time invested. The tester seeks
directional accuracy, not flyspeck precision.
12.4.2 External Approaches
Side-by-side testing of ARDIS versus RAM was first performed by Pitney Bowes in
1993. Testing at 647 statistically chosen customer locations was performed in the
following priority sequence:
1. At the machine to be serviced (preferred)
If unsuccessful:
2. Somewhere in the same room with the machine
If unsuccessful:
3. At the nearest window
If unsuccessful:
4. Outside the building
The summary tabulation of successful tests
by height in the building
(0 = ground, 1 =
first floor) is given in Table 12-2.
On October 31, 1995, BSWD (then RAM Mobile) made a presentation claiming
equal in-building coverage with ARDIS.
11
The words were most emphatic. They
were also laced with frequent references to the objectivity of their own independent
study as well as inaccurate references to the Pitney Bowes tests. Interested, I read the
White Paper on the subject.
12
There one learns that:
1. The modem used for both carriers was the InfoTAC, an excellent normalizing
decision.
2. While RD-LAP was available in Boston, the test location, BSWD chose not to
use it. Instead, it employed only MDC4800 for ARDIS. Better response time
Table 12-2 Pitney Bowes field test summary
Percentage of Successful Tests
Number of
Successful Tests
Floor Number ARDIS RAM
1 68.0 20.0 25
0 73.3 38.9 90
1 75.0 46.1 395
2 90.9 67.7 65
3, 4 91.2 78.1 32
>4 92.5 95.0 40
All (weighted) 78.1 50.9 647
12.4 FIELD TESTS
191
was then claimed for BSWD, which is not surprising, but unfairly portrayed
during the presentation.
3. The in-building test may have had no deep penetration component at all: At
each selected location a test was run for each service outside and inside a
building. There went half the in-building count. Further, in-building tests were
close to a window as well as away from the window. Were any totally
enclosed?
Thus, the BSWD test was reported with great distortion. Once again, potential users
must be wary about accepting sales pitches at face value.
12.4.3 Summary Field Test Results
Table 12-3 summarizes five years of test results, divided into two main categories:
street-level and in-building coverage. It is possible to subdivide many of the
in-building tests still further (e.g., window present, completely enclosed). However,
these gross summaries give a high-level view that is a reasonable characterization of
the coverage capability of the three main packet providers.
12.4.3.1 Street-Level Tests
These results are dominated by JFD Associates
tests. ARDIS and BSWD have similar results, with ARDIS holding a useful
advantage. The cumulative results are less than the 90% goal. This is primarily a result
of the severity of testing in the first half of 1994. The marginal suburbs tests worked
the very edges of the coverage contour lines; many of the Stamford tests were equally
difficult. These tests were not random and dragged down both ARDIS and BSWD. If
the results are plotted, as in Figure 12-17, one gets a better comparative feel for
street-level coverage.
Figure 12-17
ARDIS vs. BSWD street-level coverage.
192
COVERAGE VERSUS CAPACITY
Table 12-3 Field test summary report
ARDIS BSWD CDPD
Date Tester Description
Number of
Tests Good
Number of
Tests Good
Number of
Tests Good
Street Level
2Q94 JFD Assoc. Marginal suburbs 30 17 30 11
JFD Assoc. Stamford, CT 56 47 56 37
4Q94 JFD Assoc. Philadelphia metropolitan
area
44 40 44 37
JFD Assoc. Brooklyn street level 48 43 48 47 Abandoned
4Q96 JFD Assoc. CT metropolitan area:
on-street
36 34 43 12
3Q97 Schindler Workday on-street 60 59 38 35 Abandoned
1Q98 JFD Assoc. I@P street/highway 94 68 100 90
3Q98 JFD Assoc. I@P partial failure retest 14 13
382 321 316 257 43 12
Percentage of success 84.0 81.3 27.9
193
Table 12-3 (
Continued
)
ARDIS BSWD CDPD
Date Tester Description
Number of
Tests Good
Number of
Tests Good
Number of
Tests Good
In-Building
1993 PitneyBowes Workday locations 747 660 647 444
1Q95 JFD Assoc. Brooklyn 23 16 23 15 23 7
JFD Assoc. Manhattan 20 13 17 6
2Q95 BSWD Boston: ~25% in-buildg 422 335 422 334
1Q96 JFD Assoc. InfoTAC 70 56
JFD Assoc. PM100D 70 60
4Q96 JFD Assoc. CT metropolitan area 25 21 25 13
1Q97 Schindler Workday in-building 176 153 117 67 Abandoned
JFD Assoc. Fairfield, CT 46 40 45 34
JFD Assoc. NYC 62 60 63 54
JFD Assoc. Westchester 25 16 24 12
JFD Assoc. Nassau/Hudson 17 16 17 15
1Q98 JFD Assoc. I@P NYC/CT
metropolitan area
53 40 54 45
1756 1486 1280 911 197 135
Percentage of success 84.6 71.2 68.5
194