Real Options in practice Chapter 7 potx
Bạn đang xem bản rút gọn của tài liệu. Xem và tải ngay bản đầy đủ của tài liệu tại đây (4.31 MB, 46 trang )
217
CHAPTER
7
Real Option Analysis—A Support
Framework for Corporate Strategy
S
trategy, according to the Oxford Dictionary, is a plan intended to
achieve a particular purpose, such as the planning of movements of
armies in a battle of war. The origin of the word is Greek; strategia refers to
the office of the general. Strategy is science and art, and it involves three
components: resources, understanding of a situation, and a goal. From these
three components the strategic plan is derived. Strategy addresses uncer-
tainty, irreversibility, and flexibility. The cornerstones of real option analy-
sis are uncertainty, irreversibility, and the managerial flexibility to respond
to future changes. Rumelt
1
noticed some time ago a growing closeness be-
tween strategic management research and economic theory; the main goal of
real option analysis is to align corporate strategy with financial markets
2
in
times of great uncertainty and complexity.
Several concepts and frameworks feature in the strategic management
literature to assist management in drawing the road map for future value
creation. Real options are an excellent analytical tool to integrate internally
project management, budget decisions, and overall corporate strategy, while
also establishing the link to internal and external uncertainties. Key ingredi-
ents for reliable and helpful real option analysis include a very good under-
standing of corporate capabilities and resources, the competitive environment,
and market dynamics. Strategy requires predictions about the future, and so
does real option analysis, but in the words of Niels Bohr, the Danish physi-
cist: “Prediction is very difficult, especially about the future.” Or, as Eugene
Ionesco, the Romanian-born, French writer states: “You can only predict
things after they have happened.” Still, patterns of the past provide com-
forting guidance; they serve to collect data, as projections for future what-if
scenarios, and as such deliver the scaffold for planning.
A look at the strategic management literature suggests that strategic
management concepts undergo decadal changes.
3
The seventies valued mar-
ket growth and favored the emergence of large, diversified multinational
conglomerates. The strategic management literate witnessed the creation of
the Boston Consulting Group Growth Share matrix and subsequent to that
a strong focus on the portfolio approach to management. The eighties,
under the influence of dramatic conglomerate failures, invited a more com-
prehensive analysis of competitive forces that shape business decisions and
business survival: they became the decade of Porter’s five forces. The nineties
replaced strategic focus on differentiation and cost leadership by a new em-
phasis on quality. As businesses that focused on total quality management
failed, during the last decade of the past millennium continued renewal, core
competence, and time and network building emerged as driving strategic
forces that led to business success.
Each of these concepts reflects economic systems, society, culture, and
the realization that the existing mainframe paradigm failed to work in a
changing environment. Each new concept provides a new perspective on
how to approach value creation for the firm, and what it may entail. Real
option analysis works well within all those strategic frameworks. This chap-
ter will discuss how the real option framework can be integrated into, sup-
port, and benefit from some of these concepts. We will touch on three main
ideas: the notion of core competence of an organization, the balanced score-
card, and portfolio management.
THE BALANCED SCORECARD
Kaplan and Norton
4
introduced the balanced scorecard to managerial think-
ing in the early nineties. The balanced scorecard marries financial with or-
ganizational performance. The authors propose a causative link between
monitoring and evaluation of daily business operations and overall strategic
achievements as well as financial performance. The creation of the balanced
scorecard was driven by the ambition to offer an alternative perspective to
organizations that overemphasized short-term financial performance. The
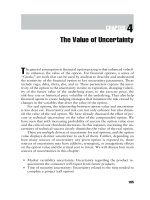
balanced scorecard introduces four dimensions of performance measure-
ment and their mutual interplay: Financials, Learning, Processes, and Cus-
tomers (Figure 7.1). The ability of the organization to learn continuously
and manage and improve processes and procedures is key to customer satis-
faction and loyalty. Enhancing both customer satisfaction and retention will
ultimately also improve financial performance.
There are some obvious overlaps between the balanced scorecard and
the real option framework: (1) Enforcement and communication throughout
218 REAL OPTIONS IN PRACTICE
the organization is key to the successful implementation of the balanced
scorecard, an idea also common to the real option framework. 2) Measure-
ment of past performance, as was pointed out when Kaplan and Norton
5
recently revisited the topic, has consequences far beyond reporting on the
past: It creates focus for the future and communicates important messages to
all organizational units and employees. In other words, it shapes corporate
strategy, bottom-up and top-down. Ultimately, the scorecard aims at help-
ing with the alignment of management processes and systems to corporate
strategy.
6
The balanced scorecard increasingly emerges as a strategic man-
agement system to institutionalize cultural values and structures. If tightly
linked with traditional organizational processes and procedures, such as
compensation, budgeting, and resource allocation, it becomes a strategy
scorecard. Paired with real option analysis, the loop to alignment with fi-
nancial markets is closed.
Enforcement of communication throughout the organization as well as
gathering historical data on benchmarks and performance generates the em-
pirical platform to identify, create, and value emerging real options. Firms
that have performance measures in place and are diligent in observing and
measuring them will not only learn very quickly about their resources, skills,
and capabilities but also use the wealth of data that is generated to make
predictions related to private risks with less noise and thereby deliver a more
reliable and valuable real option analysis. They also will have processes and
procedures in place to monitor the drivers of private risk and will realize
when trigger thresholds to delay, accelerate, abandon, expand, contract or
switch are hit. Furthermore, they will be able to link internal data with value
creation in the market. The real option framework serves well to provide the
roadmap back and forth from strategy to organizational performance via fi-
nancial performance and back to strategy, as shown in Figure 7.2.
Real Option Analysis—A Support Framework for Corporate Strategy 219
Customers
Learning
Financials
Processes
FIGURE 7.1 The balanced scorecard concept
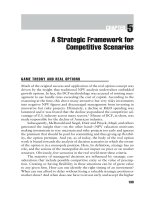
The balanced scorecard turns into an integrated real option scorecard.
Financials, Learning, Processes and Customers are broken down into com-
ponents; value creation and risk-exposure of those components are mapped
out and analyzed, drivers of uncertainty and their impact on overall value
contribution will be understood and guide adjusting and redesigning the pa-
rameters the scorecard should capture.
A key challenge in implementing the balanced scorecard, as pointed out
recently by Peter Brewer,
7
is translating strategic statements into specific
scorecard measures that serve to connect strategy and performance mea-
surement. The real option framework could serve well as an analytical tool
to link strategy, performance measure, and financial management. It can as-
sist in defining performance measures that actually drive uncertainty and
value creation, while at the same time benefiting from the data gathered to
refine assumptions underlying the real option valuation.
In fact, there are numerous key success factors that apply to imple-
menting both the balanced scorecard and the real option framework. Both
concepts also offer similar organizational benefits to ultimately drive the
strategic success of the corporation.
220 REAL OPTIONS IN PRACTICE
Customers
Learning
Financials
Processes
Differentiation
Satisfaction
Value
Growth
Profitability
Risk
Change
Innovation
Opportunities
Improvement
Acceleration
Positioning
FIGURE 7.2 The integrated real option scorecard
Both concepts help management to communicate the company’s vision
and mission and link performance measures to mission and strategy. An
organization that excels in one capacity will be able to create real option value
in an area where others fail or will derive less value from the same opportunity.
Both rely on the involvement of employees in defining the parameters for
performance and using the measured data stemming from operations, logis-
tics, human resources, and finance as input parameters for private risk, speed,
time to development, and competitive strength to assess real option valuation.
Both benefit from a focus on the essentials. It is easy to get lost in a real
option jungle by finding more and more sources of uncertainty and discov-
ering more and more options that are beyond the organizational ability to
execute. Equally, a scorecard approach that pays equal attention to vital per-
formance measures and less important parameters diverts focus and may fail
to capture the essence.
Both are optimally utilized if closely linked to corporate strategy and vi-
sion. The performance measures used in the scorecard should be key to imple-
menting corporate strategy. Having those measures installed, in turn, delivers
the basic organizational data to perform a reliable real option analysis.
Implementation of both concepts benefits if it is endorsed as a strategic,
corporate initiative throughout the entire organization rather than a project
with limited applicability. Both also benefit from strong links to outcome:
value creation is a strong feedback mechanism for performance measures
and exercise of real options. Both finally rely on creating an incentive and
compensation structure that is aligned: Performance measures need to tie in
with the scorecard to be reinforcing, honest, and motivational. Real options
will only be exercised rationally and will be value maximizing if execution
is rewarded and not penalized, not even for the abandonment option.
The success of both tools for continuous organizational improvement,
strategy enforcement and value creation, relies on daily use of each one. Real
options require continuous monitoring of the environment to adjust risks
and uncertainties, alter option triggers, and exercise the option if the trigger
is hit. Likewise, the balanced scorecard will only work effectively if it be-
comes deeply engrained in daily management activities.
Both concepts also benefit from continuous efforts to improve and
adapt to individual and changing organizational needs and changing strate-
gies. Figure 7.3 provides the conceptual outline as to how the balanced
scorecard and the real option framework can work together to support a
strategic vision.
Assume that a firm attempts a change in strategic vision from a mass
production approach to a more tailored, customized product portfolio. It is
motivated to make that move because a more detailed analysis of its profit
structure has shown that the most profitable customers are those that value
Real Option Analysis—A Support Framework for Corporate Strategy 221
Strategic Vision
Customized Product
Learning Measures
• # Product ideas from customer interaction
• # Customer Support Teams
• # $$ for Customer Service Training
Process Measures
• Average Ramp-up Time for product ideas
• # Customer-driven Innovations
• $$ spent for product Innovation
Customer Measures
• Market Research on Customer Satisfaction
• Customer Switch
• Customer Base Expansion
Financial Measures
• Growth and Profit Margins by Segment/Product
• Cost Structure
Innovation Portfolio
# Growth Options
Probability distribution
q for success
Time and Cost Estimates
Market Size
Market Dynamics
Price Dynamics
Expected Payoff
Best & Worst Case
Scenario
FIGURE 7.3
Strategic vision—an integrated real option scorecard approach
222
tailored product design. Learning measures designed to focus the organiza-
tion on making that transition could entail the amount spent on the training
of customer service employees, the number of customer support teams built,
and the number of product ideas or improvement suggestions collected
through the improved and more direct interaction with the customer. Those
ideas may constitute the pool of product ideas from which future growth op-
tions arise. Each dollar spent for training and education of the customer sup-
port team (the exercise price) can be related to the number of product ideas
created, and more importantly, the number of executed growth options de-
rived from the idea portfolio.
As process measures, the firm may contemplate gathering data about
how long it takes to transfer a product idea into a tangible improvement of
an existing product or new product, and how often a growth option is suc-
cessfully executed. Gathering these operational metrics will help the firm in
the future to derive internal benchmarks on the probability distribution of
customer-derived product ideas to advance into novel products or product
features, what the time of maturation for those options is, and what the ex-
ercise price, that is, costs involved, may be.
Customer measures along these lines could entail primary market re-
search on customer satisfaction and data collection on keeping or losing cus-
tomers, as well as expansion of the customer base. Each performance
measure will help refine market uncertainties: the best and worst case mar-
ket scenarios as well as market and size dynamics over time.
Financial measures, finally, will include repeated over-time assessment
of profit and cost function of the organization, and these data will help the
organization to arrive at reliable estimates for expected payoff as well as ex-
ercise prices.
From here, the loop can be closed back to the beginning. Is the strategic
vision turning into reality? Does the expense in employee training pay off by
increasing customer satisfaction, stabilizing the customer base or even ex-
panding it, and leading to more innovative product ideas that result in exe-
cutable growth options? And does the entire exercise pay off financially by
leading to an expansion of the most profitable customer segment?
CORE COMPETENCE
The concept of core competence as a firm foundation for corporate success
evolved in the late eighties in response to increasing financial pressures ex-
ercised by institutional investors. In an environment of aggressive mergers
Real Option Analysis—A Support Framework for Corporate Strategy 223
and acquisitions, the notion that a firm’s unique resources and capabilities
were the key factors in achieving and maintaining competitive advantage
gained much attention and support in the early nineties.
8
The resource-based view of the firm emerged in response to Michael
Porter’s concept of the competitive forces that shape corporate payoff and
ultimately strategy. Porter put the corporation in the midst of a power strug-
gle where it is exposed to pressures from buyers, supplier power, barriers to
entry, the threat of product substitution, and competitive pressure that dic-
tated the overall profit potential of a given industry as well as the profit per-
formance of the individual corporation. In the real option framework, these
components drive the external, non-private uncertainties that put the value
of the real option at risk but by the same token also create the upside po-
tential.
The resource-based view of the firm
9
offers a complimentary perspective
on corporate strategy. It argues that the firm’s collective tangible and intan-
gible assets and resources create the foundation for a specific set of compe-
tencies that cannot be easily imitated and therefore constitute the basis for
sustainable competitive advantage. Conceptually, these ideas had their roots
in work done by Selznik and Penrose,
10
who proposed the notion that the
unique set of a firm’s capabilities drive the competitive advantage. In the real
option framework, this collective organizational ability, tangible and intan-
gible resources that include financial resources, skills, knowledge, intellectual
property, organizational processes and procedures, drive the organizational
ability to cope with uncertainties. Both components, external uncertainties
or forces and internal capabilities, drive the real option equation, as sym-
bolized in Figure 7.4.
Core competence—through the real option lens—entails the entire body
of organizational capabilities that creates option value and allows respond-
ing to future changes. Core competence adds value to a real option, for ex-
ample, by allowing an organization to ascribe a higher probability of
technical success and shorter development time frame to a new product de-
velopment program—based on internal know-how and established
processes, thereby potentially driving an investment option at or in the
money that remains out of the money for a less capable organization. Some-
what indirect empirical support comes from several sources that identify the
diversification discount.
11
The market value of diversified firms, which by
intuition are less likely to have had the chance of developing core compe-
tencies, is less than the sum of market value of individual firms that operate
with exclusive focus in similar businesses. This phenomenon may point to
the alignment of financial markets to corporate strategy via the real option
framework. Financial markets, intuitively, may acknowledge that diversified
224 REAL OPTIONS IN PRACTICE
operations with less core competence and fewer key capabilities pay a higher
exercise price to execute their real options and thus create less value than fo-
cused firms with a more specialized but relevant skill set.
Firm-specific resources or capabilities include skilled, qualified, and mo-
tivated personnel, in-house knowledge of technology, and established
processes and procedures as well as trade contracts.
12
These resources evolve
and grow through organizational learning and are intricately linked to the
evolution of the firm and its traditional playgrounds in terms of products,
markets, and technologies.
13
It is the combined organizational knowledge,
skill set, and experience that permit a given firm to offer products of better
quality, at cheaper prices, with more reliability, and within a shorter time to
market.
In addition, there are organizational skills and competence, acquired
over time by learning and growing experience, to deal with uncertainties and
environmentally imposed changes and challenges. Henderson and Cock-
burn,
14
for example, have suggested—based on a comparative analysis of the
corporate competences of ten leading pharmaceutical firms—that organiza-
tional competence explains variances in research productivity across firms,
ultimately creating competitive advantage.
Each capability has a value-added impact on the real option valuation as
it drives the assumptions on costs, probability of success, time frames, and
market share that go into the analysis. Therefore, the same market oppor-
tunity has a different real option value to different firms. Further, since firms
operate with different skill sets, the execution capabilities of real options dif-
fer and lead to different payoffs. This, in turn, impacts the learning experi-
ence an organization gains when executing a real option and guides how the
organization will analyze and value similar real options in the future.
Hamel and Prahalad,
15
building on and extending the view of the
resource-based firm and emphasizing the idea of the competitive advantage
that derives from internal resources, have pointed out that a firm capable of
not just reacting to but in fact shaping the environment is positioned best to
Real Option Analysis—A Support Framework for Corporate Strategy 225
Porter’s Five
Buyers
Suppliers
Competitors
Substitutes
Barriers to Entry
Firm’s
Core Competence
& Capabilities
+=
Real Option
Creation &
Execution
FIGURE 7.4 The real option framework at the interface of industry dynamics and
corporate competencies
benefit from future uncertainties. Such a firm, in real option terminology, is
capable of identifying and maximizing the upside potential of current and
future emerging options by managing all available resources to build com-
petitive flexibility. This, in turn, enables the organization to create and also
execute real options where others fail to do so.
More recent literature also focuses on the organizational ability to cre-
ate, maintain, and protect knowledge, which is perceived as a key competi-
tive advantage. Leonard-Barton
16
suggested eight strategies that facilitate
organizational learning, sharing and retention of knowledge. These include
learning from the market, a key element of option analysis. In addition, es-
tablishing internal communication channels and creating room for shared
problem solving and for experimenting also feature prominently on her list
of key success factors. The latter, room for experimenting, is captured nicely
in the real learning option. Shared problem solving, on the other hand, is
mandatory to arrive at cross-organizational consensus estimates for risks
and uncertainties underlying the real option analysis and valuation. In fact,
building on the early work of Nelson and Winter,
17
some have suggested
that the ability of firms to create and, more importantly, to recombine and
transfer knowledge internally constitutes the basis for the evolution of multi-
national corporations.
18
This ability creates the competitive advantage that
allows firms to operate across countries.
The basic ingredients of an organizational architecture that facilitates ef-
fective accumulation and sharing of expertise, knowledge, and information
will—if implemented well—undoubtedly assist in bringing together the col-
lective organizational wisdom that drives many of the assumptions that
guide a real option analysis valuation and execution. Other sources of com-
petitive advantage include the managerial systems and problem-solving
strategies established within any given firm. These capabilities dictate the
success of the firm to access and integrate external knowledge and transform
it into competitive capabilities and products.
Internal capabilities and competencies of this nature have a tangible ef-
fect on the firm’s performance and on the outcome of the real option analy-
sis. For example, the pharmaceutical company Merck has been praised for
its capabilities in clinical trial design and trial management.
19
The firm de-
signed, planned, executed, and communicated with regulatory authorities
about a multitude of clinical trials. This has led through a successive build
up to a wealth of cumulative organizational experience about this critical
step of drug development. This collective organizational wisdom impacts on
real option analysis at several levels.
The firm created over time a large internal dataset from both completed
as well as failed clinical programs. This is a corporate treasure that facilitates
226 REAL OPTIONS IN PRACTICE
making key assumptions for option analysis such as the likelihood of suc-
cess, the timelines for different steps in the development program, the
likely costs involved, and a good understanding of regulatory challenges.
Merck can make those assumptions based on past experience, and be quite
confident about the assumptions. Merck also reduced the uncertainty caused
by noise which, as we discussed before, does not add to real option value.
Further, the organization can assign higher probabilities of success to the
final regulatory step in the product development program, which will con-
tribute to increases in option value and the critical cost to invest. The orga-
nization may be able to shorten development time by good trial design and
a strong focus on key deliverables, thereby reducing time to maturation, and
thus increasing the real option value to the organization. In addition, the or-
ganization may have procedures in place to efficiently execute the trial pro-
gram, thereby reducing the exercise price, increasing real option value as
well as freeing resources to invest in other growth options.
An organization less skilled or apt may still envision the real options but
fail while executing them. Organizational learning, be it project-specific pas-
sive learning by waiting for information or by active investment and exper-
imentation, or collective learning over time about improving organizational
experience, skills, tacit knowledge, and organizational processes and proce-
dures, is a key ingredient in building core competence and enabling the or-
ganization in the identification and execution of real options.
The concept of core competence has attracted much attention and in-
terest, but many managers find it hard to adopt it for their organizations.
In-house knowledge of technology processes and designs, for example, are
frequently cited as important firm competencies.
20
Because such technology
capabilities often arise only with accumulated experience and are based on
embedded or highly tacit knowledge, they are largely immobile and difficult
for other firms to easily acquire or imitate.
21
The difficulty, for managers, however, remains in defining what exactly
a core competence should be for a given organization. The quick, but not
necessarily right or helpful answer lies in filling the paradigm with firm-
specific and pragmatic content. A core competence is what made you suc-
ceed, a non-competence is what made you fail. That may be helpful when
doing a post-mortem analysis, but such a definition will provide little guid-
ance in identifying competences key to the success of the firm in the future,
and helping build them. Then core competence as a strategic management
tool becomes a “mirage.”
22
Real option analysis, instead of delivering yet another mirage, will actu-
ally help in putting boundaries and tangibility on the core competence mi-
rage. Core competence makes an opportunity into a real option at the money
Real Option Analysis—A Support Framework for Corporate Strategy 227
or deep in the money for a given business. Other organizations with different
organizational skills and experience will fail to create that moneyness when
going after the same opportunity. A core competence is what drives the value
of the opportunity into the money because internal skill sets and capabilities
reduce the technical uncertainty, shorten the time to market, trouble the com-
petitive environment, and permit execution of the real option.
Real options link core competence to capabilities to financial valuation.
Let us discuss this with an example. In a recent article Nolan argues that
data competence is a core competence of nurse leaders in the information
age.
23
The primary nurse, in the case of an acutely ill patient, has compre-
hensive knowledge of the patient and his care. With the help of information
technology, the same nurse can access a wealth of clinical and statistical
data, the collective wisdom of patient care. The author argues in a hypo-
thetical example that a data-competent nurse can integrate available exoge-
nous information on patient care and financial data to guide management
decisions on patient care.
Key to the idea of competitive advantage through core competence is the
ability of the organization to reduce uncertainty by increasing flexibility.
This may entail the ability to reduce fixed costs by creating economies of
scope and by sharing resources.
24
This notion is also at the very heart of real
option analysis. However, some scholars have also pointed out an important
trade off: the path-dependency of core competence. The more specialized
and adept an organization becomes, the less capable it may be in preserving
opportunistic fitness—at the end of this path waits the core competence
trap. “While a firm’s distinctive capabilities facilitate innovation, they have
a flip side called core rigidities that hamper development.”
25
Core compe-
tence then becomes a double-edged sword when organizational skills and
specialized capabilities transform into inertia and create core incompe-
tence,
26
or a real anti-option. The established set of core competence is un-
suitable to create real option value from emerging opportunities. The real
organizational challenge then becomes creating and sustaining the dynamic
core competence.
27
Again, real option analysis may be a valuable tool to succeed on this
path. While management cannot easily switch from the established set of
core competences to a new one that better fits the current market require-
ments, it can invest in fundamental organizational capabilities that will en-
able it to make flexible responses in the future. From this perspective, core
competence entails the set of capabilities that prepares a firm in the best pos-
sible way to respond to future uncertainties.
28
The value of real options is very sensitive to the strength of corporate
competencies; real options provide a link between assets, resources, organi-
228 REAL OPTIONS IN PRACTICE
zational capabilities, and core competencies. Real option analysis will assign
value to unique and to flexible core competencies; the right mixture of both
will ensure sustainable dynamic core competence.
Some have argued that today’s business environment is characterized by
very efficient markets, in capital as well as in products or talents, that will
not tolerate idle disparities of corporate performance.
29
In such an environ-
ment, the ability to anticipate future changes (that is, foresight) is viewed as
a very valuable corporate asset and indeed core competence.
30
Along these lines, Hamel and Prahalad made the point that the real mis-
sion of industry foresight starts with the question “what could be?” and then
works backward to what must happen today to make that future happen to-
morrow. Here lies another strong parallel to real option analysis and the bi-
nomial framework: We also start way out in the future and work our way
back to today to identify the value of the future world. We identify what
must happen now to make the future happen, what endangers the path into
that future, and what an alternative future may then look like. It is foresight
informed by insights that derive from picking up today’s signals of future
scenarios.
Corporate capabilities describe in sum the way of doing business. They
entail knowledge assets, including patents, brand names, and reputation, as
well as organizational assets such as culture, capability of information shar-
ing and processes of decision making, as well as technologies and procedures
in place. The value of investing in intangible assets such as business
processes and procedures, employer training and education, positioning and
early stage R&D to create core capabilities is well recognized by U.S. firms.
At the end of the last decade, U.S. firms spent approximately $1 trillion per
year on these items, compared to $1.2 trillion of investments that went into
tangible assets within the manufacturing sector alone.
31
How then can real
option analysis assist in shaping strategic intent, identifying required capa-
bilities and core competence and closing the gap between the current skill set
and the one required in the future?
Consider the example of a computer manufacturer who may find out
from a detailed market survey and internal analysis of his customer segments
that the most profitable customers consist of a selective group that places
much more importance on the flexible and individualized design of com-
puter features rather than overall price. A general flow chart for building
transferable as well as flexible corporate core competence is outlined in the
diagram in Figure 7.5. It consists of the following key steps: Identify and
quantify the value of product flexibility, map out the required capabilities,
focus on those capabilities that emerge as value drivers in the real option val-
uation, adjust organizational processes, perform performance review, and
Real Option Analysis—A Support Framework for Corporate Strategy 229
create incentives in line with revised product strategy, monitor success based
on market data and customer feedback.
To better and more effectively address this customer group and also ex-
pand market share within this customer segment, management devises a set
of core capabilities that are viewed as critical to the success. These include a
modular production process with maximum flexibility, sufficient inventory
capacity to facilitate quick and flexible assembly of individual modules, and
a responsive and efficient customer service department to pick up trends and
customer demands proactively, as well as an efficient and reliable distribu-
tion network. These organizational capabilities are very distinct from those
required for a production process that focuses on product competition
through price: economies of scale through a simplified mainstream assembly-
line process, just-in-time relationships with suppliers and buyers, and low
inventory.
Management envisions a multi-step cross-functional and cross-
organizational strategy that should ultimately lead to building the new set of
required capabilities and provide growth of the most profitable customer
segment. This strategy addresses three major components of the firm: orga-
nization, its culture and procedures, and operational processes as well as
technology. Each of these components can be further broken up in several
sub-components that need to be addressed, as shown in Figure 7.6.
230 REAL OPTIONS IN PRACTICE
Market Survey – Customer Values
Current Capabilities Required Capabilities
Value Drivers in the Real Option Analysis
Design of Flexible Investment Strategy to build
Most valuable core capabilities
Performance Measures
Incentive Structure
Assumption
Revision
Market Uncertainty
Positive Reinforcement
Capability Building
Customer Feedback
Data Collection
FIGURE 7.5 Flow chart to build corporate capabilities integrating the real option
framework
In order to define the best investment strategy, value and risk drivers
need to be defined. Management needs to understand the added value and
cost implications for each of these items as well as their contribution to the
real option valuation of the entire project. Then the process of organiza-
tional change to build new sets of core capabilities will be initiated.
Assume that an internal survey combined with market research pro-
duces the following information: Because of the current design of the produc-
tion process and inventory management, 10% of the most profitable
customer segment are not served in the most optimal fashion. Failure to de-
liver desired custom-designed products within acceptable time frames has
led to cancellations or withdrawals of 5% of these customers, costing the
firm $4 million in product revenues per month on average and building up
an increasingly negative brand name and reputation that will make it more
and more difficult to attract new customers. This in turn suppresses the
firm’s growth rate in this most profitable customer segment. There is a risk
that the current trend worsens, and in the worst case scenario, management
envisions accumulating annual losses of market share in this customer seg-
ment of up to 20%, leading to significant revenue loss of approximately $80
million per year over the next seven years and even more pronounced de-
clines in overall profitability of the firm by 5%, which will undoubtedly at-
tract the attention of Wall Street and be penalized in the market.
To reverse the trend, management envisions major improvements in
three core areas: customer service, production processes, and new product
development (Figure 7.6). Building more core competence in the customer
Real Option Analysis—A Support Framework for Corporate Strategy 231
Communication
Infrastructure
Data Collection
& Management
Growth of Most Profitable
Customer Segment
Customer
Service
Supplier
Relationships
Inventory
Management
Modular
Production
Process
Supplier
Relationships
Rapid
Prototype
Design
Flexible
Product
Development
Organization
Processes
Technology
FIGURE 7.6 A three component approach to increase profitability
service department is likely to result in a better, proactive understanding of
changing trends in the customer base and will allow in the future somewhat
improved product development and production planning. After an initial
learning curve of 12 months, inventory management should improve, re-
ducing working capital requirements by 15%. This leads to cost savings of
$5 million per year without compromising the quality of the newly built im-
proved service.
Production processes need to be changed to a more modular procedure.
This will require an initial cost outlay of $5 million and also enhance the
cost of production by $0.3 million annually.
Finally, management envisions a new initiative in product development
designed to focus on prototype developments that incorporate modular pro-
duction processes. The envisioned benefit is two-fold: rapid response to
changing customer demands, thereby helping to sustain and expand market
share in the most attractive customer segment. In the worst case scenario,
this should help to sustain market share, while product prices could be en-
hanced to compensate for highly desirable product features, resulting in ad-
ditional annual revenue starting in two years from now, which is—over a
period of five years—valued at $50 million of additional asset value. In the
best case scenario, the market could be grown over time, leading to an over-
all additional asset value of $80 million in the best case. The new product
development initiative should also create a more efficient, cost-effective
modular production process that would ultimately reduce the variable cost
outlay, also starting in two years and—over a period of five years—result-
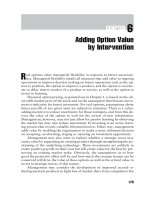
ing in cost savings of $5 million. These assumptions translate into the fol-
lowing binomial asset tree shown in Figure 7.7.
Without reversion of the trend, management sees its current option in
place on future revenues at risk. In the best case scenario, the present value
of $336 million could be lost; in the worst case $560 million could be lost.
The expected value at risk amounts to $479.36 million.
Improving the current customer service is expected to take one year to
complete and require an investment of $5 million. Management expects that
this improvement will be successful at a probability of 90% (q7 = 0.9), and
that it will result in cost savings over a period of six years of a minimum of
$30 million and a maximum of $48 million, with equal probability for each
scenario (q9 = q10 = 0.5). Management also believes that this program will
assist in retaining customers and reducing the number of orders that will be
withdrawn. Management expects that with a probability of 40% at the best
case, 30% of customers can be retained, and with a probability of 60% in
the worst case, 20% of the customers will be retained. This secures revenue
232 REAL OPTIONS IN PRACTICE
233
1
2
5
9
10
7
8
q
7
= 0.9
q
8
= 0.1
q
12
= 0.7
q
13
= 0.3
q
17
= 0.8
q
18
= 0.2
q
22
= 0.7
q
23
= 0.3
q
27
= 0.5
q
28
= 0.5
q
32
= 0.9
q
33
= 0.1
q
34
= 0.5
q
35
= 0.5
q
9
= 0.5
q
10
= 0.5
q
14
= 0.4
q
15
= 0.6
q
19
= 0.4
q
20
= 0.6
q
24
= 0.6
q
25
= 0.4
q
29
= 0.6
q
30
= 0.4
14
15
12
13
6
11
21
19
20
17
18
24
25
16
29
30
22
23
27
28
32
33
34
35
48m
30m
134m
89.6m
224m
134m
76.8m
51.2m
80m
50m
24m
15m
26
31
4
3
Recoverable
Option Value 313.83m
Asset Value at Risk: 479.36m
FIGURE 7.7
The binomial asset tree of the capability building option
streams worth $134.4 million in the best case scenario and $89.6 million in
the worst case scenario (nodes 14 and 15, respectively).
Management further assumes that this part of the customer service and
training program has a success probability of 70% (q12 = 0.7). The maxi-
mum value at nodes 7 and 12, respectively, is the expected value derived
from customer retention and cost savings, that is, $35 million and $107 mil-
lion. The minimum value at node 8 and node 13, respectively, is zero when
the trading and education program fails to succeed, with a likelihood of
10% for node 8 and of 30% for node 13, respectively. Under these assump-
tions the value of the call at node 6 and node 11 is $37.56 million and
$88.53 million, respectively. Both options will be acquired with the initial
investment outlay at node 5; at a budgeted cost of $5 million the value of the
call at node 5 then becomes $113.09 million.
Changes in the production process will come at a total cost of $7.1 mil-
lion (present value), but management believes that those changes will ulti-
mately facilitate retaining in the best case 50% of the customers at risk of
switching at a probability of 40%, and in the worst case retain 30% of cus-
tomers with a probability of 60%. This translates into retained revenue
streams of $224 million (node 19) or $134 million (node 20). This gives a
call value at node 17 of $175.05 million and at nodes 4/16 of $145.72 given
a 20% chance that those measures may fail (node 16).
Finally, management contemplates an initial investment of $50 million
in order to create a new product development initiative designed to come up
with fast prototype developments (node 3). This initiative will not material-
ize until three years from now, but then has the potential to secure up to
90% of the current customers that remain at risk of switching despite the
improvements in customer services and production processes. This will pre-
serve $76.8 million in the best case scenario (60% probability) and $51.2
million in the worst case scenario (40% probability) of revenues currently at
risk (nodes 24/25). It creates an option value of $71 million at node 22. The
probability of the product development program being completed success-
fully and being able to make this contribution to customer retention is esti-
mated to be 70% (node 22). This gives rise to an option value at node 21 of
$49.85 million.
Management further assumes that the new product development initia-
tive will permit bringing products that are in better alignment with changing
customer demands much quicker to the market and thereby expects this ini-
tiative to also expand the customer base by another 5% to 10% at the most
at a probability of 60%. This would result in an additional revenue stream
of $80 million in the best case scenario and $50 million in the worst case sce-
nario (nodes 29 and 30, respectively). The likelihood of this component of
234 REAL OPTIONS IN PRACTICE
the new product development initiative to succeed is estimated to be 50%
(q27 = q28 = 0.5).
Finally, management envisions cost savings coming out of the product
development initiative simply by allowing for more flexibility in the pro-
duction process. These savings will more than outweigh the envisioned in-
creased production costs that result from changing the production processes
(Part B of the program) which have been included in the option valuation at
node 16 as a component of the exercise price. Those cost savings will be in
the worst case scenario $5 million per year, starting in year 4, and in the best
case scenario $8 million per year. Each scenario is equally likely (q34 = q35
= 0.5), and the likelihood of completing this part of the new product devel-
opment initiative is 90% (q32 = 0.9). This gives an option value at node 31
of $18.78 million. The initial investment outlay of $50 million acquires all
three options; the value of the call at node 3 then becomes $55 million. Tak-
ing all options together, the value at node 2 is $313.82 million. How does
this compare to the expected value of $479.36 million at risk?
THE OPTION VALUE OF POSITIONING
In the strategic management literature, positioning refers to the ability of a
firm to increase its organizational effectiveness by placing or rearranging its
resources. Ideally, positioning increases the efficacy of any given firm in re-
lation to that of the competitor, who is ideally weakened or put into disar-
ray by these strategic moves. Whether in table games such as chess, in a
wartime situation, or in business strategy, moves that create a positional ad-
vantage are of value. For a firm, they refer to economies of scale, to network
effects of a specific technology, to patents, a brand name, ownership of a dis-
tribution channel, or special supply contracts. Investments that create or em-
phasize positional advantages have option value, even if they do not create
cash flow by themselves. Indirectly, through the positional advantage, they
contribute either to cost savings, that is, reducing the exercise price of the
option, prolonging the life-time of the asset, or enhancing payoff.
Rita McGrath refers to investments designed to strengthen a firm’s po-
sition as “amplifying pre-investments.”
32
One example given by the author
includes investments in lobbying at regulatory or government authorities to
facilitate the creation of a favorable regulatory environment that will accept
products in development.
Positioning also entails investments in a proof of concept for any given
technology or product. For example, a car manufacturer may spend resources
Real Option Analysis—A Support Framework for Corporate Strategy 235
for excessive car safety testing in extreme environmental conditions. The re-
sults of these tests can be utilized in commercials and other forms of adver-
tising and help to create or sustain a reputation for safety that preserves
market share. Such a reputation would position not just the model for which
those tests have been done but would extend to the entire product line. Sim-
ilarly, a drug manufacturer may engage in a series of clinical trials to prove
an additional benefit of a marketed compound related to the underlying
technology employed in the design of the compound. If such a trial is done
with leading medical authorities in the field, the results will have additional
credibility and impact. This may assist the sales force of this particular com-
pany in convincing physicians to use this drug instead of the competing
compound.
Positioning options create value in many ways: by securing network po-
sitions or distribution channels, by promoting rapid product adoption or
sustaining demand by promoting brand-name and strengthening reputation.
The value of the option is driven by several factors:
Maintenance of current market position
Deterrence of competitor
Expansion of current market position
Costs of positioning
If the positioning value extends to an entire line of products or organi-
zational capabilities, obviously the value created for each product line adds
to the positioning value. In this regard, the decision to establish an e-business
is a positioning option. It adds an additional organizational capability that
advances the ability of the firm to engage in a new form of interacting with
and offering services to customers and suppliers; it provides a novel value
proposition for the firm that will be beneficial across product lines and
across departments. It will assist in streamlining manufacturing, supply
chains, and inventory management; provide a novel infrastructure for mar-
keting and open new distribution channels, and enable the organization to
offer new services to its customers with a growing focus on individualized,
customized solutions. The overall vision associated with this project is sum-
marized in Figure 7.8.
The challenge is to value these mostly intangible benefits and also de-
termine the critical cost to invest. To this end, the vision needs to be trans-
formed into distinct branches of the binomial asset tree that carry timelines,
bear probabilities, and identify sources of value creation. Figure 7.9 provides
the basic outline of the binomial asset tree.
236 REAL OPTIONS IN PRACTICE
The five basic branches do not necessarily run in parallel but may be
structured sequentially, as shown in Figure 7.10.
The investment may start with a pilot project that focuses on streamlin-
ing internal processes, followed by an integration step with external con-
tractual partners, followed by building novel distribution channels and
ultimately the offering of novel products. At each level the value proposition
of leveraging organizational capability and brand name across the organi-
zation and across geographical areas is maintained. During the implementa-
tion of each phase, management has the option to learn and evaluate. After
completion of each phase, management may either take the project to the
next level or terminate the project at the current level and abandon the idea
of further expanding the e-business strategy across the organization.
By initiating the e-business strategy internally to streamline internal
transactions, initial investment costs are quite limited, but the opportunity to
gain experience and learn is very valuable. Management may feel confident
in assigning probabilities of success to the e-business initiative internally,
having full knowledge of organizational structures and procedures. The ex-
perience gained in this phase will be helpful in implementing the next phase.
Real Option Analysis—A Support Framework for Corporate Strategy 237
E-Business
Novel
Distribution
Channels
Streamline
Internal
Processes
Platform for
New Products/
Services
Streamline
Interactions
With Suppliers/
Contractors
Value
Proposition/
Brand-Name
FIGURE 7.8 The positioning vision
Automation of Routine Transactions
Integrated Product Planning
Cost Savings
Working Capital Savings
Internal
Processes
Value
Proposition
Global Branding &
Differentiation
Facilitate Customer /
Supplier Feedback
Integration with
Customer Systems
Distribution
Channel
Less Customer
Switching
Cost Savings
Global
Store
Front
Less Customer Switching
Growing Customer Base
New Customers
Competitor
Deterrence
New Service Offerings
Platform for
new
Products/
Services
E-Business
Investment
Integration with
Contractors
Suppliers
Logistic Service
Provider
Reduction in logistic planning Time
More Flexibility & Reliability
Decrease Transportation Cost
Improved Control & Visibility
Improved Utilization of
Transportation Assets
Demand Forecast
Inventory Consumptions
FIGURE 7.9
The binomial tree of the strategic options
238
Further, it will be instrumental in extrapolating basic data sets to the next
phase and making more informed assumptions as to the likely time line of
implementation and probabilities of success when extending the e-business
initiative to the outer circle of contractors, the next phase, which is likely to in-
volve a bigger cost outlay.
PORTFOLIO MANAGEMENT
The fundamental objective of portfolio management, writes David Swenson,
the CFO of Yale and in charge of a 7 billion dollar endowment, lies in faith-
ful implementation of long-term policy targets.
33
Portfolio theory is con-
cerned with tools and systems that permit investors to classify, estimate, and
control both the nature and extent of expected risk and return. It is of crucial
importance to the strategic framework of an organization to incorporate a
decision-making framework and procedures that proactively attend to the
collective risks, their nature, their size, their implications, and their man-
agement, be it internally or externally.
In 1990, the three economists to receive the Nobel prize included Harry
M. Markowitz, the founder of modern portfolio theory. Markowitz won the
award for work he had published in 1952.
34
He had proposed that the risk
Real Option Analysis—A Support Framework for Corporate Strategy 239
Internal
Processes
Value
Proposition
Distribution
Channel
Platform for
new
Products/
Services
E-Business
Investment
Abandon
Learn/Evaluate
Learn/Evaluate
Learn/Evaluate
Learn/Evaluate
Integration with
Contractors
Suppliers
Logistic Service
Provider
FIGURE 7.10 The staged investment strategy
of a financial security should not be measured at the individual level but in
the context of the entire security portfolio. Selecting a set of securities that
are negatively correlated and therefore will respond to future uncertain
changes in the market by moving in opposite directions helps the portfolio
owner to diversify and therefore minimize exposure to risk while preserving
returns. Asset allocation decisions emerged as the key to manage risk and re-
turn for investment securities—and for investment projects.
The quantification of the relationship between risk and return as well as
the notion that investors must be compensated for taking on risks are at the
heart of modern portfolio theory. The relationship between individual secu-
rities within a given portfolio dictates the overall risk-return profile of the
portfolio; understanding and managing this relationship becomes more im-
portant than the analysis of an individual security.
Corporate portfolio decisions cover acquisitions and divestments; allo-
cation and re-allocation of resources between projects, extensions, and con-
tractions; insourcing and outsourcing decisions; and management of fixed
assets such as plants, buildings, and machines, as well as intangible assets in-
cluding brand names and intellectual property. Portfolio design and portfo-
lio decisions work across departments and across the organization; they are
fundamental to the formulation and execution of corporate strategy.
Financial portfolio theory recommends four basic steps to evaluate se-
curity investments:
1. Security valuation—describing a universe of assets in terms of expected
return and expected risk
2. Asset allocation—determining how assets are to be distributed among
classes of investment such as stocks or bonds
3. Portfolio optimization—reconciling risk and return in selecting the se-
curities to be included
4. Performance measurement—dividing each stock’s performance (risk)
into market-related (systematic) and industry/security-related (residual)
classifications
The same principles are applicable to corporate project portfolio analy-
sis and design.
1. Opportunity analysis—describing the wealth of investment opportuni-
ties, their risk and return profiles, aligned with corporate strategy and
vision
2. Allocation decision—allocating human, financial, and asset resources to
portfolio projects, including the withdrawal of corporate resources
240 REAL OPTIONS IN PRACTICE
3. Project mix—defining the combination of projects that maximize profit
but minimize risk, aligned with corporate strategy and vision and sup-
ported by corporate core competence
4. Performance review—characterizing and monitoring the specific private
risks associated with individual projects and across the project portfolio;
managing those risks and leveraging them across projects; defining the
exogenous risks any project portfolio will face and understanding how
different project portfolios are likely to respond to those risks.
For financial securities, the generic recommendation for portfolio man-
agement is to include three asset classes: equities, real estate, and fixed in-
come.
35
The underlying rationale for investments in each class is relatively
simple, as briefly summarized in Figure 7.11.
For project portfolio investments, criteria are not only much more com-
plex but also conflicting. They include time to completion, fit into corporate
strategy, drivers of risk, probabilities of success, expected costs, revenue and
profit profiles, competitive strength, and inter-project leverage. In addition,
there is allocation of resources to sustain existing core businesses (fixed in-
come, cash cows) as well as to maintain existing assets. Depending on over-
all corporate strategy and the risk-comfort zone of the organization, as well
as assumptions on future uncertainties and market developments, there will
not be just one but several corporate project portfolios that may address
conflicting objectives and a set of different uncertain futures.
The first prominent strategic management frameworks for portfolio
management include matrix-based approaches, such as the Boston Consult-
ing Group Matrix and the McKinsey and Company Matrix. The key di-
mensions of the McKinsey matrix are industry attractiveness on the x-axis
and the current position of individual business units on the y-axis. Industry
attractiveness is captured by market size, market growth, industry prof-
itability, and cyclicality. The strength of the business unit is measured by its
market position, that is, market share; by its competitive position; by judging,
for example, brand name, quality, technology innovation, manufacturing
ability, distribution network, and cost structure; and by return on sales.
Real Option Analysis—A Support Framework for Corporate Strategy 241
Rationale
Asset Class
• Stability• Current Income
• Stability
• Risk Premium
• Dissimilar price
movements
Real EstateFixed IncomeEquity
FIGURE 7.11 Financial portfolio approach