Urban Health and Society: Interdisciplinary Approaches to Research and Practice - Part 13 ppsx
Bạn đang xem bản rút gọn của tài liệu. Xem và tải ngay bản đầy đủ của tài liệu tại đây (592.99 KB, 10 trang )
Methods 101
Academic Partners Lehman College, City University of New York (CUNY) became
CUNY ’ s only four - year liberal arts college in the Bronx in 1968. Lehman ’ s Department
of Environmental, Geographic, and Geological Sciences sponsors a certifi cate pro-
gram in GISc and brings technical expertise in GIS to the partnership. Research based
in geographic information science (GISc) and environmental and health spatial analy-
ses is conducted in the Urban GISc Lab.
Partnership Organization
The South Bronx Environmental Justice Partnership (SBEJP) has operated with fund-
ing from the NIEHS since 2001 with Montefi ore Medical Center (MMC) serving as
the grantee and For a Better Bronx (FABB) and Lehman College receiving subcon-
tracts. Although this structure represents the organizational and administrative resources
of the partners, it does not refl ect the relative commitment to environmental justice or
environmental health expertise of the partners. In fact, only FABB has a mission focu-
sed on promoting environmental justice, whereas AECOM, MMC, and Lehman have a
variety of clinical, educational, and research goals. SBEJP has operated generally by
consensus and has aims that include organizational development. Currently, meetings
rotate between each partner ’ s offi ces with a member of the host organization develop-
ing the agenda and chairing the meeting.
To better understand health disparities in the Bronx, we set out to explore whether
environmental factors, such as poor outdoor air quality, could be shown to have a spa-
tial association with the increased rates of asthma hospitalization in the Bronx. To
conduct this multifaceted study, we needed to develop a team of experts in several
fi elds as well as community - based scientists.
For the asthma and air pollution study, the academic, medical, and community -
based organizations have joined together, and all three partners have been instrumental
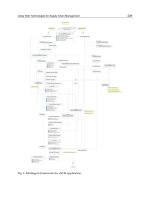
in crafting the methods for the analyses. The process of our collaboration and contribu-
tion of each partner is summarized in Table 5.1 . In this project, geographic information
systems were instrumental in the research design, and one of the strengths behind GIS
is that it can take large amounts of data and examine complex interactions, making the
complex visible and intelligible. GIS also provides an excellent foundation for mean-
ingful community participation in research design, development of methodology, data
needs assessment, data acquisition, and the actual analytic portions of the work. In
other words, it permits the integration of local knowledge bases and “ street science ”
into the more traditional health and environmental assessments.
METHODS
Community - Scale Assessment Techniques and Units of Analysis
Within Bronx County, not all areas are equally affected by high asthma hospitalization
rates. Smaller geographic units may show contradictory trends regarding concentrations,
hot spots, or prevalence. Therefore, we must look at the subcounty level to discern import-
ant differences and potential spatial correlations with air pollution sources. The unit of
c05.indd 101c05.indd 101 6/5/09 2:12:42 PM6/5/09 2:12:42 PM
TABLE 5.1. Phases of South Bronx Environmental Justice Partnership’s Geographical Information Systems
and Asthma Study and Partners’ Contributions
Phase of asthma and GIS study
Role of collaborating
partners Description of analysis Results
I: Proximity Analysis
a
I A—Use of census tract data
as areal unit of analysis
I B—Use of individual
hospitalization and census block
group as units of analysis
Community focused on
infl uence of outdoor air
pollution in asthma; Lehman
conducted GIS analysis;
Montefi ore provided SPARCS
data; funding from Einstein
Original creation of circular
and linear “buffers” or
“impact” zones and
calculation of odds ratios
inside vs. outside impact
zones
Statistically signifi cant increases
in odds ratios for most exposures
except major truck routes (MTRs)
for children and limited access
highways (LAHs) for both adults
and children
II: Regression Analysis
b
Einstein and Montefi ore
statisticians performed analysis
to control for infl uence of
poverty and racial/ethnic
minority of original fi ndings
Multiple regression analysis
to determine contribution of
minority and poverty status
in relation to buffer zone
exposure
Most hospitalization variance
explained by minority and
poverty status with 1 percent
residual contribution from air
pollution exposure
III: Multiple Exposure Analysis
c
In response to FABB’s concern
about excess burden of
multiple exposures, Lehman
restructured data and analyzed
for zones affected by two or
more sources of air pollution
Creation of “multiple
exposure” buffer zones and
calculation of odds ratios
Multiple exposure zones
have higher odds ratios for
hospitalizations than single
exposure zones
c05.indd 102c05.indd 102 6/5/09 2:12:42 PM6/5/09 2:12:42 PM
IV: Dasymetric Population
Mapping: Development of CEDS
d
Analysis developed by Lehman
in response to all partners’
skepticism of original fi ndings
that proximity to LAHs were
“protective” against asthma
hospitalizations
Dasymetric analysis:
Application of cadastral
(tax assessment) database
to calculating population
distribution within block
groups and calculation of
odds ratios
Odds ratios for LAHs now show
statistical signifi cance; odds
Ratios increase for all individual,
combined, and multiple exposure
impact buffers
V: Loose-Coupling an Air
Dispersion Model and the GIS
e
Analysis developed by Lehman
in response to concerns that
circular “impact zones” were
unrealistic and did not refl ect
local geography, prevailing
winds, height of apartment
buildings, etc.
Air dispersion modeling:
Loose coupling air dispersion
modeling estimates more
accurate exposure plumes
and, therefore, different
“buffers”
Odds ratios increased for
stationary point sources impact
buffers
a
Maantay, J. A. Asthma and Air Pollution in the Bronx: Methodological and Data Considerations in Using GIS for Environmental Justice and Health Research
Health & Place. Special issue: Linking Environmental Justice, Population Health, and Geographical Information Science, 13 (2007): 32–56.
b
Fletcher, J. Report on the Regression Analysis of Asthma Hospitalization Rates and Proximity to Major Air Pollution Sources. Bronx, NY: Albert Einstein Col-
lege of Medicine, 2006.
c
Maantay, J. A., Maroko, A. R., Porter-Morgan, H. A New Method for Population Mapping and Understanding the Spatiality of Disease in Urban Areas. Urban
Geography, 29, no. 7 (2008); 724–738.
d
Maantay, J. A., Maroko, A. R., and Herrmann, C. Mapping Population Distribution in the Urban Environment: The Cadastral-Based Expert Dasymetric System
(CEDS). Cartography and Geographic Information Science. Special issue: Cartography 2007: Refl ections, Status, and Prediction. 34 no. 2 (2007): 77–102.
e
Maantay, J. A., Tu, J., and Maroko, A. R. Loose-Coupling an Air Dispersion Model and a Geographic Information System (GIS) for Studying Air Pollution and
Asthma in the Bronx, New York City. International Journal of Environmental Health Research, 2008.
c05.indd 103c05.indd 103 6/5/09 2:12:42 PM6/5/09 2:12:42 PM
104 Geographic Information Systems, Environmental Justice, and Health Disparities
analysis for demographic and socioeconomic data is the census block group, the smallest
census enumeration unit for which demographic and socioeconomic data are consis-
tently available. The Bronx has 957 block groups, each containing an average of about
1,400 people .
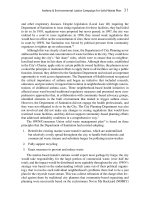
The unit of analysis for the asthma hospitalization cases is the individual patient
record for each admission, and this level of resolution was crucial in developing accu-
rate rates of asthma hospitalization inside and outside buffered areas around polluting
land uses, as described later. These individual hospital discharge records were drawn
from the publicly available Statewide Planning and Research Consortium System
(SPARCS) database of the New York State Department of Health. The home address
of each individual hospitalized with a primary discharge diagnosis of asthma was
geocoded to exact longitude and latitude with protections put into place to assure con-
fi dentiality and prevent back - coding. Rates were developed by dividing the number of
asthma cases by the block group populations. Prior studies have used census tract data
(a larger geographic unit than the block group) for both. The units of analysis for the
environmental data are the individual polluting land uses and impact zones constructed
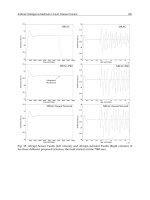
around each. Figure 5.2 shows the spatial distribution of asthma hospitalization rates
for various age groups.
2
Miles
Total Population
Hosppitalization Rate
per 1,000
1.88–3.93
3.94–7.36
Ͼ7.36
no population/
no data
0–1.87
Hospitalization Rate
per 1,000
0–2.74
2.75–5.54
5.55–9.80
Ͼ9.80
no population/no data
Children (Ͻ16)
Adults (16 and older)
no population/
no data
Hospitalization Rate
per 1,000
4.61–9.40
9.41–14.60
Ͼ14.60
0–4.60
FIGURE 5.2 Five-Year Average Asthma Hospitalization
Rates in the Bronx (1995–1999) by Census Block Group
c05.indd 104c05.indd 104 6/5/09 2:12:43 PM6/5/09 2:12:43 PM
Methods 105
Environmental Hazards and Pollutants Investigated
The locations of known sources of air pollution were used to derive approximations of
the areas with poor air quality in the Bronx. In ascertaining which land uses are most
likely associated with the suspected pollutants of concern for asthma, we decided to
focus on major stationary point sources of air pollutants and the Toxic Release Inven-
tories (TRIs) as well as mobile sources from major highways and truck routes as proxies
for local areas of poor air quality.
Our GIS analysis used the publicly available TRI, maintained by the U.S. Environ-
mental Protection Agency (EPA), which is a fairly consistent database and covers the
entire United States. Facilities within certain Standard Industrial Classifi cation (SIC)
codes (e.g., chemical, printing, electronic, plastics, refi ning, metal, paper industries,
etc.) must report their emissions and waste to the EPA if they meet certain conditions,
such as manufacturing more than 25,000 pounds per year or using more than 10,000
pounds per year of one or more of the 650 listed toxic chemicals.
52
Because of the high
thresholds in the reporting regulations, TRI includes only the largest users and emit-
ters of toxic substances.
In many communities, TRI facilities and other listed major stationary point sources
represent just one component of the total environmental burden, and many other facili-
ties (which individually are below the reporting thresholds for quantities of emissions,
use, or production of toxic chemicals and, thus, are not required to report to the EPA)
may contribute as much or more on a cumulative basis to the overall air emissions.
Unfor tu nately, it is diffi cult to obtain reliable data about these facilities because they
are not listed in a publicly accessible format and often do not receive any governmental
oversight. Many smaller facilities, such as auto body painting and repair shops, electro -
plating fi rms, waste transfer stations, and factories, also emit contaminants to the air,
but these emissions for the most part remain undocumented and, thus, are diffi cult to
incorporate into the analysis.
Another major contributor to air pollution, especially fi ne particulate matter, is the
high level of truck traffi c in the Bronx, which is especially prevalent in the industrial
zones. It is not uncommon for 1,000 trucks to enter one solid waste transfer station
each day, and there are more than a dozen such transfer stations in the Bronx.
53
Also of
note, FABB has observed signifi cant truck traffi c on streets other than the truck routes
designated by the Department of Transportation.
Although other vehicular traffi c is a signifi cant source of air pollution in the Bronx, it
is more diffi cult than the major truck routes to isolate and quantify. Limited access high-
ways, which carry in excess of 50,000 vehicles per day (average annual daily count), were
selected to represent the most signifi cant pollution sources from vehicular traffi c in addi-
tion to trucks. The Hunts Point Terminal and Fulton Fish Markets, the major fi sh, meat
and produce wholesale exchange in the metropolitan area are also located in the South
Bronx, resulting in more than 15,000 trucks entering the area per day.
Most researchers now consider air pollutants to be a risk factor for asthma, although
the roles that specifi c air pollutants play in various respiratory illnesses remain unclear.
54 ,
55
However, if we examine the general effects of air pollution, rather than the effects of
c05.indd 105c05.indd 105 6/5/09 2:12:44 PM6/5/09 2:12:44 PM
106 Geographic Information Systems, Environmental Justice, and Health Disparities
specifi c pollutants, we fi nd there is a large body of literature demonstrating their rela-
tionship to adverse respiratory events, suggesting that air pollutants are best treated as a
whole. Therefore, air pollution in this article refers to the substances that constitute the
pollutant mixture from traffi c and industrial - related sources that has been associated
with respiratory effects and typically includes particulate matter (e.g., PM
10
, PM
2.5
), vol-
atile organic compounds (e.g., VOCs, benzene, acetaldehyde, tetrachloroethlene,
toluene), NO
2
(nitrogen dioxide), SO
2
(sulfur dioxide), and O
3
(ozone). The locations of
the stationary and mobile sources of these pollutants were mapped and examined in light
of their spatial correspondence to areas of high asthma hospitalization rates.
Proximity: Analysis with GIS
This study accounts for exposure to air pollution burdens by using proximity analysis
to create impact zones around the TRI facilities (TRIs) and other listed major station-
ary point sources (SPSs) as a proxy for areas of elevated air pollution, as shown
in Figure 5.3 . Exposure to the pollution from truck traffi c is accounted for by the cre-
ation of impact zones surrounding the major truck routes (MTRs), many of which
traverse residential neighborhoods. Impact zones were also constructed around limited
access highways (LAHs) to represent areas of elevated exposure from other vehicular
traffi c in addition to trucks.
The impact zones constructed for this study were based on distances established as
standards by environmental agencies or used most often by other researchers as the area
of greatest potential exposure from sources. One - half mile radius impact zones were
constructed around TRI facilities;
56 ,
57
one - quarter mile radius impact zones around
other major stationary point sources of criteria pollutants.
58
In addition, we created a
150 - meter impact zone from roadway centerline around both LAHs and MTRs,
59 ,
60
the
“ distance within which concentrations of primary vehicle traffi c pollutants are raised
above ambient background levels. ”
61
The majority of similar studies found signifi cant
associations between traffi c - related emissions and respiratory symptoms within the 100
to 200 meter range.
41 ,
62
–
64
Each of these impact zone types constituted a separate layer that was then inter-
sected with the asthma hospitalization layers. A layer of all the impact zones combined
was also created and intersected as shown in Figure 5.3 . Using the locations of the
asthma hospitalization cases, it was possible to determine which cases fell within each
of the four different impact zone types, as well as within their sum or “ combined ” buf-
fer, by “ clipping ” (i.e., removing all the display elements that lie outside the boundary)
the asthma layer by each of the fi ve impact zone layers. The clip function was per-
formed for total asthma hospitalization cases as well as for each of the age cohorts
separately.
Rates based on the fi ve - year average were calculated for the portions of the block
groups within each type of impact zone and the combined impact zone. Because the
locations of the asthma hospitalization cases are pinpointed with accuracy by latitude
and longitude and are not aggregated by census tract or block group, it is possible to
c05.indd 106c05.indd 106 6/5/09 2:12:44 PM6/5/09 2:12:44 PM
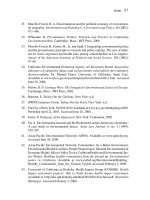
Methods 107
derive rates for the block groups that can be differentiated by whether the portion of
the block groups is in or out of the buffer, as shown in Figure 5.4 . This would not be
possible using data aggregated by enumeration unit (i.e., census tract) and is only fea-
sible because individual patient record - level data were used.
To develop and compare rates inside and outside the impact zones, an interpola-
tion process called “ areal weighting ” was performed on the census block groups. The
boundaries of census block groups are not coincident with the buffer areas, and there-
fore, the population data for each tract or block group must be recalculated based on
the portion of the tract or block group that falls within the impact zone. The census
block groups that fall partially, but not totally, within a certain impact zone are weighted
by the proportion of the area that falls within.
65 ,
66
For instance, if a tract or block group
SPS TRI
Combined Multiple
Exposure
MTR
LAH
Proximity Buffer
Bronx
042 Miles
FIGURE 5.3 Pollution Proximity Buffers
Bronx, N.Y.
c05.indd 107c05.indd 107 6/5/09 2:12:44 PM6/5/09 2:12:44 PM
108 Geographic Information Systems, Environmental Justice, and Health Disparities
is exactly half within the impact zone, the ratio would be 0.5. These ratios are then
applied to the population variables to get a reasonable estimate of the population
within the impact zones.
The set of demographic and socioeconomic characteristics that we were interested
in were quantifi ed and mapped for the within - buffer population and compared to
the outside - of - buffer population. The proportion of each variable within the impact
zone is based on the proportion of area within the impact zone. Thus, the underlying
Buffer
Bronx
0 500 1,000 1,500250 Feet021 Miles
Residential Locations of Asthma Hospitalizations
Asthma Hospitalizations
Outside Combined Proximity Buffer
Inside Combined Proximity Buffer
FIGURE 5.4 Asthma Hospitalization Cases, In and Out of Buffers
Each dot represents the residence of one Bronx person admitted to the hospital for asthma in 1999.
Some dots represent multiple admissions of the same person or multiple people admitted from the
same address. The multiple cases are not shown as individual dots on the map, but have been in-
cluded in statistical calculations. There were 8,188 hospital admissions in 1999: 5,876 of them from
within the areas of the combined buffers and 2312 of them from the areas outside the buffers. Over-
all in 1999, a Bronx resident was 27 percent more likely to be admitted to the hospital for asthma if
living within a buffer area than if living outside a buffer area.
Important note: the patient address locations shown on this map are derived from hypothetical data
and do not represent actual addresses. Because of patient confi dentiality requirements, the actual ad-
dress locations could not be shown in a document for public dissemination, and this map is intended
to illustrate only the methods used in the analysis. Actual address locations were, however, used by
the researchers in the spatial analyses to derive the in- and out-of-buffer rates, odds ratios, and other
statistical tests. The researchers were permitted to show only aggregated data (as opposed to record-
level data) in any maps available to the public.
Data source: hypothetical data.
c05.indd 108c05.indd 108 6/5/09 2:12:45 PM6/5/09 2:12:45 PM
Methods 109
assumption in this method is that the data for entire unit of analysis (in our case, the
block group) are homogeneous, with its population spread evenly throughout, which
obviously may not be the case, a limitation of this method. For instance, a large housing
project in one corner of the tract would affect the accuracy of areal weighting, as would
a large part of the tract being parkland or water, where people are unlikely to live.
Asthma hospitalization rates were developed by using the actual number of cases
in each portion of the block group within the impact zones divided by the number of
people estimated by areal weighting in that portion of the block group within the
impact zones. As noted earlier, this is a simplifi cation; however, considering the small
areal extent of the typical Bronx block group, it appears to be reasonably accurate.
Rates in and out of impact zones were calculated for the total population and the age
cohorts separately, for each of the fi ve years, and then calculated based on the fi ve -
year average.
67
In general, the smaller the unit of data aggregation, the greater the likelihood of
homogeneity and the more reliable the method of areal weighting. However, data disag-
gregation methods exist for obtaining more precise locations of populations, and these
can be utilized to calculate better rates in and out of buffers, although these methods are
more computationally demanding, time consuming, and require more detailed ancillary
data. These data disaggregation methods are referred to as “ dasymetric mapping. ” We
developed a new population - mapping technique to improve the “ denominator ” to calcu-
late more accurate rates.
The Cadastral - based Expert Dasymetric System (CEDS) is a model that uses both
an expert system and dasymetric mapping to disaggregate population data (e.g., from
the census) into much higher resolution data, giving a more realistic depiction of
population locations and densities.
68
Dasymetric mapping entails using ancillary data
sets to refi ne and redistribute the locations of some phenomena (e.g., population) to
refl ect their distribution more accurately. CEDS, for instance, uses data sets that mask
off the areas where people tend not to live (e.g., parks and water bodies) and then
redistributes the census populations throughout only the known inhabited areas rather
than throughout the entirety of the census unit area (which often includes uninhabited
areas). CEDS then uses tax - lot (cadastral) data, which in NYC is on average 150 times
fi ner resolution than the census block group data, to further disaggregate the census
population data, as described below.
The expert system is a computerized decision - making program, which has been
instructed to “ decide, ” based on heuristic rules and expert judgment, which among sev-
eral variables in the tax - lot data set to use for disaggregating the census data to calculate
the optimally accurate tax - lot - level population. CEDS can be used to reliably disaggre-
gate population data as well as subpopulations such as racial/ethnic groups, age cohorts,
income/poverty groups, and those with differing educational attainment levels. We
recalculated our rates and analyses based on this more precise population denominator
obtained by using CEDS and found more pronounced increases in hospitalization rates
in impact zones.
68 ,
69
c05.indd 109c05.indd 109 6/5/09 2:12:45 PM6/5/09 2:12:45 PM
110 Geographic Information Systems, Environmental Justice, and Health Disparities
FINDINGS
The results of the proximity and other GIS analyses are instructive in guiding our
future research directions. The most noticeable visual aspect of the impact zones that
were created around major air pollution sources is the extent to which the Bronx is
covered. Approximately 66 percent of the Bronx ’ s landmass falls within the impact
zones (excluding major parkland and water bodies). Because the impact zones in this
study represent those areas most affected by air pollution, a majority of the Bronx pop-
ulation may be exposed. According to calculations based on the areal weighting script,
88 percent of the people within the impact zones are minorities, and 33 percent are below
the federal poverty level. In contrast, outside the impact zone, 79 percent are minorities
and 25 percent are below the poverty level. Even though the impact zones cover so much
of the Bronx, there is still a disparity between the characteristics of the populations inside
and outside the impact zones, indicating the likelihood of disproportionate environmen-
tal burdens.
In addition to the differences seen in poverty and minority status inside and out-
side the impact zones, there is also a difference in asthma hospitalization rates inside
and outside the impact zones. Calculating odds ratios for the rates, we found that people
living within the combined impact zones are 30 percent more likely to be hospitalized
for asthma than people outside the impact zones, as shown in Table 5.2 . Within some
of the individual impact zones, such as TRI and major stationary point sources, asthma
hospitalization rates were 60 and 66 percent higher, respectively, compared to areas
outside the impact zones. The odds ratios, in general, are higher for adults 16 years
and older than for children 0 to 15 years. This is true for every type of impact zone and
for nearly every year of the fi ve years analyzed.
TABLE 5.2. Odds Ratio Ranges for the Five-Year Study
Period 1995–1999
Buffer type Adults Children Total population
Combined 1.28–1.30*
1.11–1.17* 1.25–1.29*
Toxic release inventory 1.29–1.60* 1.14–1.30* 1.33–1.49*
Stationary point sources 1.26–1.66* 1.16–1.30* 1.23–1.32*
Major truck routes 1.07–1.17* 1.00–1.09 1.10–1.15*
Limited access highways 0.90–0.93 0.83–0.99 0.86–0.93
* Indicated results are statistically signifi cant at p Ͻ 0.01.
c05.indd 110c05.indd 110 6/5/09 2:12:45 PM6/5/09 2:12:45 PM