Configuring Windows 7 (Training Kit) - Part 68 doc
Bạn đang xem bản rút gọn của tài liệu. Xem và tải ngay bản đầy đủ của tài liệu tại đây (193.31 KB, 10 trang )
Case Scenarios CHAPTER 12 643
Chapter Review
To further practice and reinforce the skills you learned in this chapter, you can perform the
following tasks:
n
Review the chapter summary.
n
Review the list of key terms introduced in this chapter.
n
Complete the case scenarios. These scenarios set up real-world situations involving the
topics of this chapter and ask you to create a solution.
n
Complete the suggested practices.
n
Take a practice test.
Chapter Summary
n
Windows Update is a feature built into Windows 7 that manages how software updates
are downloaded and installed.
n
Windows Update can retrieve updates from the Microsoft Update servers on the
Internet or from a local update source, such as a WSUS server.
n
Some Windows Update servers can be configured through the Windows Update
control panel, but most settings are configured through Group Policy.
n
InPrivate Browsing mode stops Internet Explorer from recording a browsing session.
n
Internet Explorer add-ons extend the functionality of Internet Explorer.
n
Internet Zones allow Web sites to be classified according to how trustworthy they are.
Key Terms
Do you know what these key terms mean? You can check your answers by looking up the
terms in the glossary at the end of the book.
n
InPrivate Browsing
n
InPrivate Filtering
Case Scenarios
In the following case scenarios, you apply what you’ve learned about subjects of this chapter.
You can find answers to these questions in the “Answers” section at the end of this book.
6 4 4 CHAPTER 12 Windows Update and Windows Internet Explorer
Case Scenario 1: Windows Update at Contoso
Contoso has three Australian offices. The head office is in the city of Canberra. There are branch
offices in the cities of Adelaide and Brisbane. All client computers at Contoso have Windows 7
Enterprise installed, are configured so that you can log on to them remotely using Remote
Desktop Connection, and have power features that support waking from hibernation. You
have just installed the WSUS role in the Canberra office. You want computers in the Canberra
office to use the WSUS server for updates, but you want to have computers in the Adelaide and
Brisbane offices retrieve updates from Microsoft Update. Another issue that you must deal with
relates to a custom software application installed on computers in the Adelaide and Brisbane
offices. You have just heard from the software vendor that a recent update, which is associated
with KB123456, has caused the custom software application to behave erratically.
With these facts in mind, answer the following questions:
1. Which policy should you configure for the computers in the Canberra office to ensure
that they use the local WSUS server rather than the Microsoft Update servers on the
Internet?
2. Which policy should you configure to ensure that computers wake for the installation
of software updates?
3. How should you remove update KB123456 from the computers at the Brisbane and
Adelaide offices and how can you ensure that it will not be installed until a fix for the
custom software application is available?
Case Scenario 2: Internet Explorer at Wingtip Toys
You have recently overseen the deployment of 100 computers running Windows 7 Enterprise
at WingTip Toys. WingTip Toys and its subsidiary, Tailspin Toys, sell high-performance,
remote-controlled aircraft. As part of the Windows 7 deployment, you need to deal with the
following post-migration issues:
n
Some members of the research department have concerns that their Web browsing
sessions across a variety of Web sites are being tracked by third-party competitor
organizations. Although this is something that they have been aware of for some
time, several have read that Windows 7 includes special technologies to deal with this
problem.
n
After several incidents where company information was posted on external blogs
accidentally, you want to minimize the use of accelerators with Internet Explorer 8.
n
The company has two external Web sites: and
. These Web sites do not render well in Internet Explorer 8,
though they appear normal in Internet Explorer 7 running on clients running Windows
XP and Windows Vista. The company has plans to update the sites, but no firm
timetable has been set.
Suggested Practices CHAPTER 12 645
With this information in mind, answer the following questions:
1. What steps can you take to ensure that users are not able to use any accelerators with
Internet Explorer?
2. What steps can members of the research department take to ensure that their
browsing sessions are not tracked across multiple Web sites?
3. How can you ensure that the sites and gtiptoys
.com are always rendered in Compatibility View by clients at WingTip Toys?
Suggested Practices
To help you master the exam objectives presented in this chapter, complete the
following tasks.
Configure Updates to Windows 7
You can complete these practices only if you are connected to the Internet.
n
Practice 1 Run Windows Update, check for available updates, and then install
available updates marked Important or Recommended. Reboot the computer if
n e c e s s a r y .
n
Practice 2 Once available updates have installed and no more updates are available,
uninstall one of the updates. Use the Windows Update control panel to again check for
updates and verify that the update that you uninstalled is now available for installation.
Use the Windows Update control panel to hide this update. Use Windows Update
to again check for updates and verify that no Important or Recommended updates
are available. Unhide the update. Use Windows Update again to check for available
updates. Install the unhidden update.
Configure Internet Explorer
You can complete practices only if you are connected to the Internet.
n
Practice 1 Add accelerators to Internet Explorer for the Blog, E-mail, and Translate
categories.
n
Practice 2 Navigate to the Security tab of Internet Options. Using the Custom Level
button, view the individual settings that apply to each zone. Note which zones allow
the user to download signed and unsigned ActiveX controls.
6 4 6 CHAPTER 12 Windows Update and Windows Internet Explorer
Take a Practice Test
The practice tests on this book’s companion DVD offer many options. For example, you
can test yourself on just one exam objective, or you can test yourself on all the 70-680
certification exam content. You can set up the test so that it closely simulates the experience
of taking a certification exam, or you can set it up in study mode so that you can look at the
correct answers and explanations after you answer each question.
More Info PRACTICE TESTS
For details about all the practice test options available, see the section entitled “How to
Use the Practice Tests,” in the Introduction to this book.
CHAPTER 13 647
CHAPTER 13
Monitoring and Performance
T
his chapter looks at monitoring resources and performance on a computer running
Windows 7. It considers the various tools that tell you what resources are available on
a computer and report problems encountered in using a resource. The chapter discusses
performance monitoring, establishing baselines and logs, and determining where bottlenecks
might occur before they happen. It looks at checking the potential of the computer to
perform resource-intensive tasks and how to capture both local events and events on other
computers.
Sometimes services, processes, and applications encounter problems and the chapter
considers how you can deal with them. Sometimes the tools provided by the operating
system are not exactly what you require, and the chapter looks at how you can create
standard scripts to address any problems you encounter without requiring a high level of
programming expertise.
You need to manage and configure services, configure page files and memory cache,
configure services, manage processes, configure your desktop, and, if necessary, change
your boot environment. The chapter discusses all these requirements.
Exam objectives in this chapter:
n
Monitor systems.
n
Configure performance settings.
Lessons in this chapter:
n
Lesson 1: Monitoring Systems 649
n
Lesson 2: Configuring Performance Settings 689
6 4 8 CHAPTER 13 Monitoring and Performance
Before You Begin
To complete the exercises in the practices in this chapter, you need to have done the following:
n
Installed the Windows 7 operating system on a stand-alone client PC, as described in
Chapter 1, “Install, Migrate, or Upgrade to Windows 7.” You need Internet access to
complete the exercises.
n
Optionally installed Windows 7 on a second PC, as described in Chapter 6, “Network
Settings.” A second computer is not required for the practice exercises but will enable
you to complete the suggested practices at the end of this chapter.
n
If you have two physical computers that are not otherwise on the same network, you need
to connect their Ethernet ports with a crossover cable or by using an Ethernet switch.
n
You need a universal serial bus (USB) flash memory device with at least 200 MB usable
free space, or a second internal or external hard disk.
n
The computer you use for the practice exercises (Canberra) needs to have an optical
drive that can write to DVD-ROM.
real World
Ian McLean
Y
ou can usually justify a server upgrade to management, even though many
managers don’t know what a server is.
There aren’t many servers. With virtualization, they are fewer than ever before.
They are mysterious black boxes that do incomprehensible things. If the network
administrator says the servers need an upgrade, the expense probably isn’t huge in
the general scheme of things.
Senior managers may not typically be technically aware (when you find one that
is, it can be scary) but they are emphatically not fools, especially where money
is concerned. You can justify extra cash to upgrade half a dozen servers. When it
comes to upgrading 500 workstations, it’s a different ball game.
So gathering performance statistics about your workstations is just as important as
gathering them about your servers. You can have the fastest servers on the market,
but if your client computers aren’t up to the job, you have a poorly performing
network. Even the thinnest of thin clients have bottlenecks, especially when it
comes to network resource.
You will need to upgrade your hardware, if not right now, then in a year or two.
Start preparing your case. Ensure that you have defined sensible baselines. Keep
track of the small but cumulative performance drops as your equipment ages and
user expectations increase. Start preparing a good case right now for the upgrades
you need in the future. Don’t wait for tomorrow, or else tomorrow somebody else
might be doing your job.
Lesson 1: Monitoring Systems CHAPTER 13 649
Lesson 1: Monitoring Systems
As an IT professional with at least one year’s experience, you will have come across some of,
if not all, the tools and utilities described in this lesson. Windows 7 offers tools to measure
performance, set baselines, identify bottlenecks, display resources, measure system stability
and reliability, and so on.
It is sometimes not easy to select the right tool for the job. Often you can use several tools
to obtain the same information or carry out the same configuration, but one of them does
it more efficiently than the others. It is relatively straightforward to use one or more tools
to gather information about a computer system. Interpreting that information may be more
difficult. This lesson attempts to split the various tools into different functional groups and
describe how the tools in each group complement each other.
After this lesson, you will be able to:
n
Use performance tools to view real-time performance data, collect data in Data
Collector Sets (DCSs), and generate reports that identify actual or potential
resource bottlenecks.
n
Examine failures and potential problems related to software installations and
other significant system changes.
n
Gather event subscriptions from source computers and store them on
a destination computer.
n
Access the Windows Experience Index and choose computer software based on
that index.
Estimated lesson time: 50 minutes
Performance Monitoring and Reporting
Monitoring performance data and comparing it to established baselines is crucial to
determining the health of your client computers, as is examining events in the event logs.
Many events are informational, but you should not ignore them because of that. Your skill
and experience as an administrator must determine what you should address and what you
can safely ignore. You should never ignore warning and error events that indicate real and
immediate problems.
As an IT professional, you probably have experience with Windows performance tools
such as Performance Monitor and the Reports tool. You might not be familiar with DCSs
that use performance counters to generate performance logs and can, in turn, be read by
Performance Monitor and the Reports tool. DCSs provide a replacement for Performance
Logs and Alerts in earlier operating systems.
Your aim is to monitor and improve performance, identify potential bottlenecks, and
upgrade the appropriate resources. You especially want to identify sources of critical
performance problems that could make a computer unacceptably slow or completely unusable.
6 5 0 CHAPTER 13 Monitoring and Performance
Performance Monitor
In Windows 7, you can open Performance Monitor by accessing Control Panel, specifying
All Control Panel Items, selecting Performance Information And Tools, clicking Advanced
Tools in the Performance Information And Tools window, and clicking Open Performance
Monitor. However it is easier to type perfmon in the Start menu search box (or at a command
prompt). The Performance dialog box lets you access Performance Monitor, DCSs, and the
Reports tool. Select Performance Monitor on the tree pane.
You can add counters by clicking the green + button on the Performance Monitor toolbar,
expanding the object (such as Memory), selecting the counter, and clicking Add. You can
specify whether you want to display a single instance of a counter or a total of all instances.
For example, if a computer has more than one CPU, you could select a counter that monitors
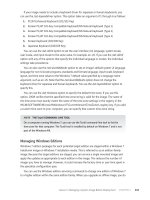
the usage of a single CPU or a counter that monitors total CPU usage. Figure 13-1 shows
Performance Monitor displaying real-time data.
FIGURE 13-1 Performance Monitor displaying real-time data
Each line on the graph appears in a different color. To make it easier to view a specific
graph, select its counter and press Ctrl+H. The selected counter appears bold and in black on
the graph. To change the appearance and refresh rate of the chart, right-click Performance
Monitor and then select Properties. The five tabs of the Performance Monitor Properties
dialog box provide access to different configuration options, as follows:
Lesson 1: Monitoring Systems CHAPTER 13 651
n
General In the Graph Elements group, you can adjust the Sample Every box to
change how frequently the graph updates. You can also specify whether the Legend,
Value Bar, and Toolbar are displayed and whether the Report and Histogram views
show Default, Maximum, Minimum, Average, or Current values. Figure 13-2 shows the
General tab.
FIGURE 13-2 The General tab of Performance Monitor Properties
n
Source On this tab, you can choose whether to display current activity in real time or
show log files that you have saved using a DCS
n
Data On this tab, in the Counters list, select the counter that you want to configure
and adjust Color, Width, and Style.
n
Graph By default, Performance Monitor begins overwriting graphed counter values
on the left portion of the chart after the specified duration is reached. If you want
to record counter values over a long period of time, you likely want to see the chart
scroll from right to left. To do this, select the Scroll style. You can also select one of the
following chart types by clicking the Change Graph Type button on the toolbar or by
pressing Ctrl+G:
•
Line This is the default setting and shows values as lines on the chart.
•
Histogram This shows a bar graph with the current, maximum, minimum,
or average counter values displayed. If you have a large number of counters,
a histogram is easier to read than a line chart.
•
Report This lists the current, maximum, minimum, or average counter values in
a text report.
n
Appearance If you keep multiple Performance Monitor windows open simultaneously,
you can use this tab to change the color of the background or other elements.
6 5 2 CHAPTER 13 Monitoring and Performance
Quick Check
1. On which tab of the Performance Monitor Properties dialog box can you specify
how often the graphs update?
2. Which rights does a user need to be able to monitor performance data remotely?
Quick Check Answers
1. On the General tab, in the Graph Elements group, you can adjust the Sample
Every box to change how frequently the graph updates.
2. At a minimum, the user’s account must be a member of the Performance Log
Users group and the Event Log Readers group on the remote computer.
Data Collector Sets
Data collector sets (DCSs) gather system information, including configuration settings and
performance data, and store it in a data file. You can use Performance Monitor to examine
the data file and analyze detailed performance data, or you can generate a report that
summarizes this information.
Windows 7 includes the following built-in DCSs:
n
System Performance You can use this DCS when troubleshooting a slow computer
or intermittent performance problems. It logs processor, disk, memory, and network
performance (Internet Protocol versions 4 and 6) counters and kernel trace data.
n
System Diagnostics You can use this DCS when troubleshooting reliability problems
such as problematic hardware, driver failures, or STOP errors. It logs all the information
included in the System Performance DCS, plus detailed system information.
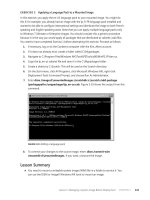
Figure 13-3 shows some of the counters included in the System Diagnostics data set.
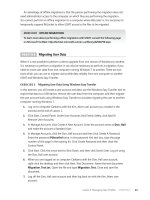
To use a DCS, right-click it and then select Start. The System Performance DCS has
a default overall duration of 10 minutes. The System Diagnostics DCS collector set has
a default overall duration of 1 minute. To stop a DCS manually, right-click it and then
click Stop.
After running a DCS, you can view a summary of the data that it has gathered in the
Performance Monitor\Reports node. To view the most recent report for a DCS, right-click the
DCS and then click Latest Report. You can then view the report by accessing it in the Reports
node, as shown in Figure 13-4.
You can also add performance counter alerts to DCSs. This enables you to monitor and
detect an alert, which you can then use to start a batch file, send you an e-mail, or call you
on a pager. For example, if you configured an alert to trigger when free space on a logical
volume falls below 30 percent, you could add this to a DCS and use it to trigger a batch file
that archives the data on the volume.