Configuring Windows 7 (Training Kit) - Part 75 pdf
Bạn đang xem bản rút gọn của tài liệu. Xem và tải ngay bản đầy đủ của tài liệu tại đây (250.56 KB, 10 trang )
Lesson 2: Configuring Performance Settings CHAPTER 13 713
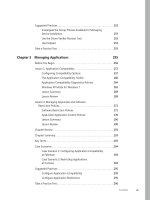
However, there is a more straightforward method of accessing this information. Click
the Performance Information And Tools item of Control Panel. Click Advanced Tools in this
dialog box, and then click View Performance Details In Event Log. This opens Event Viewer
and displays the events in the Operational container, as shown in Figure 13-46. Examining
a critical error shows that, for example, the Canberra computer had a problem during the
boot process.
FIGURE 13-46 Viewing performance diagnostic events in the Operational container
note DEVICE DRIVERS
If a device is not working properly, then this has an effect on performance that is often
catastrophic. You need to ensure that (in general) the latest device drivers are installed
for all your devices. The exception is when a new device driver does not work as well as
its predecessor, in which case you need to roll back to the old device driver. Chapter 4,
“ Managing Devices and Disks,” discusses this topic in detail.
note POWER PLANS
Power plans and configuring power settings are mentioned in the examination objectives
covered in this chapter. However, Chapter 11, “BitLocker and Mobility Options,” discusses
these topics in depth, and there is no point duplicating that material here.
7 1 4 CHAPTER 13 Monitoring and Performance
Using Task Manager to Configure Processes
Lesson 1 described how you use Task Manager to close failed applications and manage
services. You can also use the tool to configure the processes that implement services. If
a process is particularly significant and should be allocated more resources, you can set
a higher priority for that process. If a process is using too many resources, or if the speed
at which a process works is unimportant, you can assign it a lower priority and hence free
resources for other processes.
If your computer has more than one processor, you can configure the affinity of your
processes to use a particular processor. By default, processes that install on a multiprocessor
computer are set to use whatever processor is available. If an additional processor is added
retrospectively to a computer, however, processes might require configuration so they can
use that processor. For example, if Task Manager or Performance Monitor counters show that
one processor on a dual-processor computer is heavily used and the other is not, you should
change the affinity so resource-intensive processes use both processors. You also have the
option of changing the affinity of some processes so that they use only the second processor.
To determine what process or processes are used by a service, right-click the service in
the Services tab of Task Manager and click Go To Process. This selects the Processes tab and
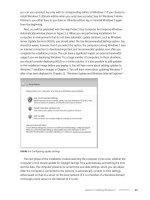
highlights the relevant process. To change the priority of a process, right-click the process and
click Set Priority. As shown in Figure 13-47, you can choose one of six priority levels. Do not select
Realtime, though—this could seriously affect the operation of other processes on your computer.
FIGURE 13-47 Setting process priority in Task Manager
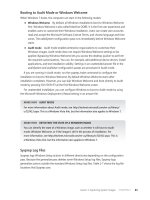
To determine the affinity of a process and change it if necessary, right-click the process
and click Set Affinity. You cannot change the affinity of certain system processes, and you
Lesson 2: Configuring Performance Settings CHAPTER 13 715
cannot change affinity if the computer has only one processor. Otherwise, the Processor
Affinity dialog box appears, as shown in Figure 13-48, and you can configure process affinity.
FIGURE 13-48 The Processor Affinity dialog box
Configuring Networking Performance
Networking performance on an enterprise network depends upon a large number of factors,
such as the type of Ethernet or wireless connections used, the speed of switches and routers,
the number of devices on a network, and so on. However, in a small network, users tend
to define networking performance by the speed of connection to other computers on the
network (if they are transferring files) and the performance of their Internet connections.
Configuring Internet Options can have a significant effect on networking performance and
on computer performance in general. As an IT professional, you are aware that temporary
Internet files can take up a considerable amount of disk space and should be deleted on
a regular basis. You know that users with excessively large mailboxes can experience lengthy
logon times, especially when they are downloading their profiles from a central server in the
enterprise environment. These however, are matters that involve user training rather than
configuration.
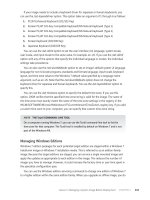
The Internet Options dialog box offers configuration options that can affect networking
performance. You can access this dialog box from Network And Internet on Control Panel
or from your browser. On the General tab, you can delete temporary Internet files and other
downloaded information such as Web form information. However, in the context of networking
performance settings, the most significant tab in the dialog box is the Advanced tab, shown in
Figure 13-49.
7 1 6 CHAPTER 13 Monitoring and Performance
FIGURE 13-49 The Internet Options Advanced tab
The Advanced tab enables you to configure Accessibility, Browsing, International,
Multimedia, Printing, and Security settings. Some of these have little or no impact on
performance, whereas others can affect performance considerably. Typically, for example,
Accessibility features would not be considered a performance issue, but if large font or caret
browsing is set for a user that does not need them, then the perceived performance for that
user is reduced.
The Browsing settings can impinge on performance. For example, if you do not disable
script debugging and display notifications about script errors, the user’s browsing experience
slows down. These settings are useful if you are debugging a new Web site that runs scripts
but are inappropriate for the standard user. Even the simplest setting, such as choosing to
always underline links, can slow browsing on a slow or heavily used site.
If you are accessing sites that provide multimedia files for either streaming or downloading
you can choose (for example) whether to play sounds and animations, automatically resize
images, or use smart image dithering. In general effects that enhance the user’s multimedia
experience often also slow down site access and browsing.
The more secure a site is, the slower it tends to be because of additional security checks.
Typically, this is something you and your users need to accept. You should not reduce security
merely to shorten access times. Nevertheless, it is probably not necessary to warn users
whenever they browse from an HTTPS secure site to an insecure HTTP site.
Lesson 2: Configuring Performance Settings CHAPTER 13 717
Windows Performance Analysis Tools
The Windows Performance Toolkit (WPT) contains performance analysis tools that are new to
the Windows SDK for Windows 7, Windows Server 2008, and Microsoft .NET Framework 3.5.
WPT can be used by a range of IT Professionals including system administrators, network
administrators, and application developers. The tools are designed for measuring and
analyzing system and application performance on Windows Vista, Windows Server 2008,
Windows Server 2008 R2, and Windows 7.
Windows performance analysis tools analyze a wide range of performance problems
including application start times, boot issues, deferred procedure calls (DPCs), interrupt
service requests (ISRs), system responsiveness issues, application resource usage, and
interrupt storms.
These tools ship with the Microsoft Windows SDK for Windows Server 2008 and .NET
Framework 3.5, which you can download at
.aspx?FamilyId=F26B1AA4-741A-433A-9BE5-FA919850BDBF&displaylang=en (although it
is probably easier to go to the Microsoft Download Center at />downloads and search for it). This SDK provides documentation, samples, header files,
libraries, and tools to develop applications for Windows XP; Windows Server 2003; Windows
Vista; Windows Server 2008; Windows Server 2008 R2; Windows 7; and .NET Framework
versions 2.0, 3.0, and 3.5. You download and install the SDK in the practice later in this lesson.
The WPT is released as an MSI installer (one per architecture) and contains the Performance
Analyzer tool suite, consisting of the following tools:
n
The Trace Capture, Processing, and Command-Line Analysis tool (Xperf.exe) This
tool captures traces, processes them for use on a computer, and supports command-line
(action-based) trace analysis.
n
The Visual Trace Analysis tool (Xperfview.exe) This tool presents trace content in the
form of interactive graphs and summary tables.
n
The On/Off Transition Trace Capture tool (Xbootmgr.exe) This tool automates
on/off state transitions and captures traces during these transitions.
The Trace Capture, Processing, and Command-Line Analysis Tool
Xperf.exe is a command-line tool that provides the following features:
n
Event Tracing for Windows (ETW) trace control
n
ETW trace merging and enhancements by including other events
n
Executable image and symbol identification
n
Trace dump capabilities
n
Support for post-processing
7 1 8 CHAPTER 13 Monitoring and Performance
This tool manages the end-to-end operations that are needed to generate a trace file for
analysis. You use Xperf.exe in the practice later in this lesson.
Xperf.exe enables events in the operating system by using groups and flags. These flags
enable and disable events from providers in various parts of the operating system. For
example, flags can direct the kernel, services, and applications to one or more trace files by
using log sessions with custom configurations. You can then merge all traces into a single
aggregate trace file that is referred to as a merged trace file.
When Xperf generates this file, it collects additional information from the operating system
and adds it to the aggregate trace. You can process the merged trace file on any supported
operating system without reference to the system that generated the trace. You can then use
Performance Analyzer (Xperfview.exe) to analyze the merged file, you can post-process the
merged file into a text file, or you can use actions to do other types of processing. Actions
produce summarized outputs that are specific to an area of interest, such as boot, shutdown,
suspend, and resume operations, or to a type of system event, such as sampled profile, context
switches, DPCs and ISRs, disk I/O, registry accesses, file accesses, or system configuration.
The Visual Trace Analysis Tool
The Visual Trace Analysis tool, or Performance Analyzer, is used to view the information
from a single trace file generated by Xperf.exe. You can use the following command to start
Performance Analyzer:
xperf file.etl
Xperf.exe forwards the file name to Performance Analyzer, which then opens and displays
the data in the file. You can also run Performance Analyzer directly by entering xperfview
in the Search box on the Start menu, the Run command box, or the command prompt.
A Performance Analyzer trace is displayed in the practice later in this lesson.
The On/Off Transition Trace Capture Tool
Xbootmgr.exe collects information during the on/off transition phases of Windows 7. You can
capture data during any of the following phases:
n
Boot
n
Shutdown
n
Sleep and resume
n
Hibernate and resume
After issuing a trace command, the test computer resets within 5 seconds.
The On/Off Transition Trace Capture tool can automate a reboot cycle during which the
computer running Windows 7 is shut down and rebooted multiple times. You can analyze the
captured data by using the Xperf.exe and Xperfview.exe tools.
Lesson 2: Configuring Performance Settings CHAPTER 13 719
Practice Downloading and Using the Windows Performance
Analysis Tools
In this practice, you download and install the Microsoft Windows SDK for Windows Server
2008 and .NET Framework 3.5, then install the WPT and use the Xperf.exe tool to generate
a trace.
exercise 1 Downloading and Installing the SDK
In this exercise, you download and install the SDK. The exercise gives a direct link to the SDK
download file, but you might find it easier to browse to this link. Perform the following steps:
1. Log on to the Canberra computer with the Kim_Akers account.
2. Insert a blank recordable DVD-ROM into your optical drive. Close the Autoplay box.
3. Open your browser and access
.aspx?FamilyId=F26B1AA4-741A-433A-9BE5-FA919850BDBF&displaylang=en.
4. Click Download.
5. In the File Download box, click Open. The download takes some time.
6. If prompted, click Allow to close the Internet Explorer Security dialog box.
7. In the Windows Disc Image Burner, select Verify The Disc After Burning, and then
click Burn.
8. When you have burned and verified the DVD-ROM, it ejects automatically. Close the
Windows Disc Image Burner. Insert the DVD-ROM into the optical drive.
9. In the Autoplay box, click Run Setup.exe.
10. If prompted, click Yes to clear the User Account Control (UAC) dialog box.
11. The Windows SDK Setup Wizard opens. Click Next.
12. Read the License terms, select I Agree, and then click Next.
13. Click Next to accept the Folder defaults.
14. Click Next to accept the Installation Options defaults.
15. Click Next to start the Installation.
16. Click Finish when installation completes. Read the SDK release notes.
exercise 2 Installing the Windows Performance Toolkit
In this exercise, you install the 32-bit version of the Windows Performance Toolkit. If your
computer is running a 64-bit operating system, choose Xperf_64.msi instead of Xperf_86.msi.
You need to have installed the SDK in Exercise 1 before you attempt this exercise.
1. If necessary, log on to the Canberra computer with the Kim_Akers account.
2. Open My Computer and navigate to C:\Program Files\Microsoft SDKs\Windows\
v6.1\Bin.
7 2 0 CHAPTER 13 Monitoring and Performance
3. Double-click the Xperf_86.msi file. The Microsoft Windows Performance Toolkit Setup
Wizard starts. Click Next.
4. Accept the License Agreement. Click Next.
5. Click Typical and then click Install.
6. If prompted, click Yes to clear the UAC dialog box.
7. Click Finish when setup completes.
exercise 3 Using Xperf.exe to Generate Traces
In this exercise, you use the Trace Capture, Processing, and Command-Line Analysis Tool
(Xperf.exe) to generate a kernel trace and a user trace. You combine the traces and process the
results into a text file. You need to have completed Exercises 1 and 2 before you attempt this
exercise.
1. If necessary, log on to the Canberra computer with the Kim_Akers account.
2. Open an elevated command prompt.
3. Start the kernel trace. The kernel session does not need a specified name because its name
is unique. The groups Base and Network are enabled on the kernel provider. The trace is
collected in a file called Kernel.etl. To accomplish this, enter the following command:
xperf -on Base+Network -f kernel.etl
4. Start a user trace named UserTrace and enable the provider’s Microsoft-Windows-
Firewall to it. This trace is collected in a file called User.etl. To accomplish this task, enter
the following command:
xperf -start UserTrace -on Microsoft-Windows-Firewall -f user.etl
5. Stop the UserTrace session so the user-mode provider no longer produces events to
this session. To accomplish this, enter the following command:
xperf -stop UserTrace
6. Stop the kernel session. To accomplish this, enter the following command:
xperf -stop
7. Merge the user and kernel traces into a single trace called Single.etl. To accomplish
this, enter the following command:
xperf -merge user.etl kernel.etl single.etl
8. Process the binary trace file Single.etl into a text file called C:\Mytrace.txt. To
accomplish this, enter the following command:
xperf -i single.etl -o c:\mytrace.txt -a dumper
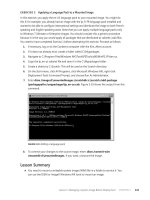
Figure 13-50 shows the Xperf commands used in this procedure. Note that there was
a problem loading a DLL associated with the On/Off Transition Trace Capture Tool, but this
tool was not used so the procedure completed satisfactorily. Figure 13-51 shows a portion of
Lesson 2: Configuring Performance Settings CHAPTER 13 721
the text file that was created. Figure 13-52 shows the combined trace (Single.eti) displayed in
the Performance Analyzer.
FIGURE 13-50 Xperf commands used to capture and merge traces
FIGURE 13-51 Trace information captured in a text file
Lesson Summary
n
You can write WMI scripts to customize the system information you retrieve from
a computer and generate your own performance-measuring tools.
n
The System Configuration Tool modifies which programs run at startup, edits
configuration files, and enables you to control Windows services and access Windows
Performance and Troubleshooting tools. The Services console lets you manage and
configure services and gives you more options than either the Services tab of Task
Manager or the Services tab of the System Configuration tool.
7 2 2 CHAPTER 13 Monitoring and Performance
FIGURE 13-52 Captured trace displayed in Performance Analyzer
n
The Performance Options tool lets you configure visual effects and specify whether the
system is adjusted for best performance of applications or background services. It lets
you configure page file (virtual memory) settings and DEP.
n
The Windows Performance Analysis tools, downloaded as part of the Windows Server
2008 SDK, analyze a wide range of performance problems including application start
times, boot issues, DPCs, ISRs, system responsiveness issues, application resource
usage, and interrupt storms.
Lesson Review
You can use the following questions to test your knowledge of the information in Lesson 2,
“Configuring Performance Settings.” The questions are also available on the companion DVD
if you prefer to review them in electronic form.
note ANSWERS
Answers to these questions and explanations of why each answer choice is correct or incorrect
are located in the “Answers” section at the end of the book.