Candlestick charting explained Part 3 doc
Bạn đang xem bản rút gọn của tài liệu. Xem và tải ngay bản đầy đủ của tài liệu tại đây (2.63 MB, 18 trang )
Chapter 4
Additional Note
You may wonder why there are three continuation patterns that are derived
from a failure to complete a Piercing Line. The On Neck Line, In Neck
Line, and Thrusting patterns all represent failed attempts to reverse the
downward trend.
Why, then, are there not similar patterns that represent failed Dark
Cloud Cover patterns? This can be answered by most students of the
market who are familiar with normal topping and bottoming tendencies.
Bottoms (market lows) tend to be sharp and with more emotion. Tops
usually take longer to play out, and cannot be as easily identified.
Japanese history, and Japanese financial trading history, in particular, is
rich with accounts of success, usually dominated by only a few individu-
als. One such success was a man named Munehisa (Sohkyu) Honma.
Some references use Sohkyu and some use Munehisa.
Honma stepped into Japanese futures trading history in the mid-eigh-
teenth century. When Honma was given control of the wealthy family
business in 1750, he began trading at the local rice exchange in the port
city of Sakata in Dewa Province, now Yamagata Prefecture, on the west
coast of northern Honshu (about 220 miles north of Tokyo). Sakata was a
collection and distribution port for rice and today is still one of the most
important ports on the Sea of Japan.
Stories have it that Honma established a personal communications net-
work that consisted of men on rooftops spaced every four kilometers from
Osaka to Sakata. The distance between Osaka and Sakata is about 380
miles, which would have required well over 100 men. This allowed
Honma the edge he needed to accumulate great wealth in rice trading.
Honma kept many records in order to learn about the psychology of
investors. His studies helped him understand that the initial entry into a
trade must not be rushed. According to Honma, if you feel compelled to
rush into a trade because you believe that you just can't lose, wait three
Chapter 5
Sakata's Method and candle Formations
days to see if you still feel the same way. If you do, you can enter the
trade, probably quite successfully.
The Honma family owned a great rice field near Sakata and they were
considered extremely wealthy in both fact and song. One folk song said
that no man can be as wealthy as a Honma: one can merely hope to be as
rich as a daimyo. A daimyo is the early Japanese term for a feudal lord.
Honma died in 1803. During this period of time a book was published.
"If all other people are bullish, be foolish and sell rice" is some of the
advice contained in San-en Kinsen Horoku. This book was published in
1755 and is known today as the basis of Japan's market philosophy.
Today, in Sakata, a house which once belonged to the Honma family, is
the Honma Museum of Art.
All of the patterns and formations based upon Sakata's Method are
taken from 160 rules that Honma wrote when he was 51 years old.
Sakata's Method, in turn, is what is now considered as the beginnings of
candle pattern recognition. Candlestick charting was not actually devel-
oped by Honma, only the pattern philosophy that goes with it. His ap-
proach has been credited as the origin of current candlestick analysis.
Since Honma came from Sakata, you may see reference to: Sakata's
Law, the Sakata Method, Sakata's Five Methods, Honma Constitution, and
similar names. While the labels may differ, the analysis technique remains
the same. This book will refer to this approach as Sakata's Method.
Sakata's Method
Sakata's Method, as originated and used by Honma for basic chart analy-
sis, deals with the basic yin (inn) and yang (yon) candle lines along with
two additional lines. The concept is centered around the number 3. The
number 3 appears often in traditional analysis as well as in Japanese chart-
ing techniques. Sakata's Method is a technique of chart analysis using the
number 3 at different points and times in the market. Sakata's Method can
be summarized as:
San-zan (three mountains)
San-sen (three rivers)
San-ku (three gaps)
San-pei (three soldiers)
San-poh (three methods)
From this list it is should be obvious that san refers to the ubiquitous
number 3.
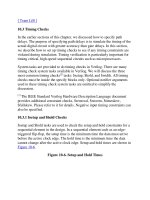
San-zan (three mountains)
Three Mountains forms a line that makes a major top in the market. This
is similar to the traditional Western triple top formation in which the price
Figure
5-1A
rises and falls three times, forming a top. This formation is also similar to
the Three Buddha Top (san-son) formation which is the equivalent of the
traditional head and shoulders formation. It comes from the positioning of
three Buddhist images lined up, with a large Buddha in the center and a
smaller one on each side. San-zan also includes the typical Western triple
top where three upmoves are made with comparable corrections that fol-
low. The three tops may be the same height or may be trending in one
direction, most probably down.
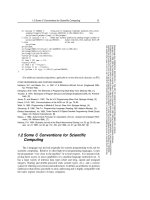
San-sen (three rivers)
Three Rivers is the opposite of Three Mountains. It is often used like the
traditional triple bottom or inverted head and shoulders bottom, but this is
sakata's Method and candle Formations
Figure
5-2A
^ MV7OT Cll
not necessarily correct. The Three Rivers method is based on the theory of
using three lines to forecast the turning point of the market. This can be
seen in a number of bullish candle patterns using three lines, such as the
Morning Star and Three White Soldiers. In Japanese literature, the Morn-
ing Star is often called the Three Rivers Morning Star in reference to this
Sakata Method.
There is some confusion about whether Sakata's Method uses Three
Rivers for a bottom formation technique or whether it refers to the use of
three lines for identifying tops and bottoms. There is considerable refer-
ence in Japanese literature to Three Rivers Evening Stars (a bearish pat-
tern) and the Three Rivers Upside Gap Two Crows (also a bearish pattern).
Also recall from Chapter 3 that there was a bullish reversal pattern called
the Unique Three Rivers Bottom.
Chapter 5
Figure 5-2B
San-ku (three gaps)
This method uses gaps in price action as a means to time entry and exit
points in the market. The saying goes that after a market bottom, sell on
the third gap. The first gap (ku) demonstrates the appearance of new buy-
ing with great force. The second gap represents additional buying and
possibly some covering by the sophisticated bears. The third gap is the
result of short covering by the reluctant bears and any delayed market
Sakata's Method and Candle Formations
orders for buying. Here, on the third gap, Sakata's Method recommends
selling because of the conflict of orders and the possibility of reaching
overbought conditions too soon. This same technique works in reverse for
downward gaps in the market after a top. The Japanese term for filling a
gap is anaume. Gaps (ku) are also called windows (madd) by the Japanese.
San-pei (three soldiers)
San-pei means "three soldiers who are marching in the same direction."
This is typified by the bullish Three White Soldiers candle pattern, which
indicates a steady rise in the market. This steady type of price rise shows
promise as a major move to the upside. Sakata's Method also shows how
this pattern deteriorates and shows weakness in the market rise. These
bearish variations to the bullish Three White Soldiers pattern are discussed
next. The first variation of the Three White Soldiers pattern is the Advance
Block pattern, which is quite similar, except that the second and third
Sakata's Method and Candle Formations
white days have long upper shadows. The second variation of the Three
White Soldiers pattern is the Deliberation (stalled) pattern, which also has
a long upper shadow on the second day. However, the third day is a
Spinning Top, and most likely a star. This suggests that a turnaround in the
market is near.
Other patterns that make up the san-pei method are the Three Black
Crows and the Identical Three Crows patterns. Each of these candle pat-
terns is bearish and indicates a weak market (Chapter 3).
Sakata's Method and candle Formations
San-poh (three methods)
San-poh means "a rest or cease-fire in market action." A popular Japanese
saying is "Buy, sell, and rest." Most traditional books on market psychol-
ogy and trading suggest taking a break from the markets. This is necessary
for many reasons, not the least of which is to get a perspective on the
market while not having any money involved. San-poh involves the con-
tinuation patterns called the Rising Three Methods and the Falling Three
Methods (Chapter 4). Some sources also refer to two other patterns, the
Upside Gap Three Methods and Downside Gap Three Methods, all dis-
cussed in Chapter 4.
The Rising and Falling Three Methods continuation patterns are rest-
ing patterns. The trend of the market is not broken, only pausing while
preparing for another advance or decline.
Sakata's Method is intended to present a clear and confident way of
looking at charts. Often Sakata's Method is presented along with the fol-
lowing simple philosophy:
1. In an up or a down market, prices will continue to move in the
established direction. This fact was instrumental in the develop-
ment of candle pattern identification with a computer (Chapter 6).
2. It takes more force to cause a market to rise than to cause it to fall.
This is related directly to the traditional saying that a market can
fall due to its own weight.
3. A market that has risen will eventually fall, and a market that has
fallen will eventually rise. As an article in the September 1991 /
issue of Forbes observed, in bear markets, it's smart to remind
Figure 5-7
Chapter 5
Figure 5-8
yourself that the world isn't coming to an end, and in bull markets,
it's smart to remind yourself that trees don't grow to the sky. A
similar and more common analogy is that all good things must
come to an end.
4. Market prices sometimes just stop moving completely. This refers
to lateral trading, a time for all but the most nimble traders to stand
aside.
Sakata's Method, while focusing on the number 3, also involves the
use of broader formations in which numerous candle patterns may exist.
Sakata's Method and candle Formations
Candle Formations
There are many Japanese candle formations that resemble price formations
used in traditional technical analysis. Steve Nison coined many of the
names commonly used in the West today. These formations can consist of
many days of data. These formations are used as general market indicators
and lack the precise timing that many investors and traders require. When
a formation does evolve, look for additional evidence of price reversal,
such as a reversal candle pattern. Some interference may occur when a
formation takes shape over a long period of time. Remember that most
candle patterns, and certainly almost all reversal candle patterns, require
that they have a relationship with the current or previous trend. These
trends are greatly influenced by the following candle formations.
Eight New Price Lines (shinne hatte)
Figure
5-9
Chapter 5
This is a formation of continually rising prices in the market. After eight
new price highs are set, one should take profits, or at least protect positions
with stops. Action based on ten new price highs, twelve new price highs,
and thirteen new price highs is also mentioned in some literature, but not
recommended here. The previous market action should be taken into con-
sideration before using this technique.
Tweezers (kenukl)
Tweezers is a relatively simple formation using the components of two or
more daily candle lines to determine tops and bottoms. If the high of two
days is equal, the formation is called a Tweezer Top (kenukitenjo). Like-
wise, if the low of two days is equal, it is called a Tweezer Bottom
(kenukizoko). The high or low of these days may also coincide with the
open or close. This means that one day could have a long upper shadow
and the next day could be an Opening Marubozu with the open (also the
high) equal to the high of the previous day. The Tweezer Top or Tweezer
Bottom is not limited to just two days. Days of erratic movement could
occur between the two days that make up the tweezer formation.
Tweezer Tops and Tweezer Bottoms are formations that will give short
term support and resistance. The terms support and resistance refer to
prices that have previously turned the market. Support is a price base that
stops market declines, and resistance is a level of prices that usually halts
market rises. A good indication that tweezer tops and bottoms have suc-
ceeded occurs when they are also part of a reversal pattern. An example of
this would be a Harami Cross in which the two highs (or lows) are equal.
sakata's Method and candle Formations
Figure 5-10
Similar in concept to the Tweezers is the Matching Low and Stick
Sandwich patterns discussed in Chapter 3. These two bullish reversal pat-
terns are derivatives of the tweezer concept, except that the close price is
used exclusively, whereas the Tweezer may use any data component, such
as high or low.
Chapter 5
High waves (takane nochlal)
The High Waves formation can be seen in the upper shadows on a series
of candle lines. After an uptrend, a series of days such as a Shooting Star,
Spinning Tops, or Gravestone Doji can produce topping tendencies. This
failure to close higher shows a loss of direction and can indicate a reversal
in market direction. An Advance Block pattern could also be the beginning
of a High Waves formation.
sakata's Method and candle Formations
Tower Top and Tower Bottom (ohtenjyou}
Tower Tops and Tower Bottoms are made of many long days which
slowly change color and indicate a possible reversal. Tower Bottoms occur
when the market is in a downtrend, along with many long black days, but
not necessarily setting significantly lower prices as in the Three Black
Crows pattern. These long black days eventually become white days, and
even though a turnaround isn't obvious, new closing highs are eventually
made. There is nothing to say that an occasional short day cannot be part
of this reversal pattern. These short days usually happen during the transi-
tion from black to white days. Of course, the Tower Top is the exact
opposite. The term Tower refers to the long days which help define this
pattern. Some Japanese literature refers to this type of formation as a
Turret Top when it occurs at peaks.
Figure 5-12
sakata's Method and Candle Formations
Fry Pan Bottom (nabezoko)
The Fry Pan Bottom is similar to the Tower Bottom, except that the days
are all small or short body days. The bottom formation is rounded and the
colors are not as important. After a number of days of slowly rounding out
the bottom, a gap is made with a white day. This confirms the reversal and
an uptrend should begin. The name is derived from the scooping bottom of
a frying pan with a long handle.
Chapter 5
Dumpling Top
The Dumpling Top is the counterpart of the Fry Pan Bottom formation. It
is a rounded top similar to the rounded top in traditional technical jargon.
The downtrend is confirmed by a gap to a black body. If the black day
after the gap is a Belt Hold Line, the ability of this formation to predict
future price movement is even better.
Figure
5-15
sakata's Method and Candle Formations
High Price Gapping Play and Low Price Capping Play
(bohtoh and bohraku)
High and Low Price Gapping Plays are the Japanese equivalents of break
outs. As prices begin to consolidate near a support or resistance level, the
indecision in the market becomes greater as time goes by. Once this range
is broken, market direction is quickly resumed. If the break out is caused
by a gap in the same direction as the prices were trending before the
consolidation, a further move in that direction is certain. Because of the
subjective nature of these formations, the textbook cases will rarely be
seen. Basically, they are the same as the Rising and Falling Three Methods
and the Mat Hold, except that no clear arrangement of candlesticks can be
used to define them.
Chapter 5
Figure 5-17
Data Requirements, caps, and Rules
Only daily price data, which consists of open, high, low, and close prices
on a stock or commodity, is being used when explaining these concepts.
Many times, the open price is not available on stocks. In such cases the
previous day's closing price has been substituted. The exception to this is
when the previous day's close is higher than today's high, today's high is
used for the open. Similarly, when the previous day's close is lower than
today's low, today's low is used as the open price. This allows the visibil-
ity of gaps from one day's close to the next day's range.
Gaps are an important part of candlestick analysis. To demonstrate that
there is not much difference, the S&P 100 stocks with and without open
price were tested and analyzed. Comprehensive testing was also accom-
plished on vast amounts of data that contained the open price to see if there
was any statistical information about gaps that could be used when the
open price was not available. Whenever a day's high and low prices were
greater than the high price of the preceding day, a gap-up analysis was
performed. Likewise, whenever a day's high and low price were less than
the previous day's low price, a gap-down analysis was done. Once a "gap
day" was identified, the following formula was used to determine the
location of the open price relative to the day's range:
• Inverted Hammer
• Dark Cloud Cover
• Piercing Line
• Meeting Lines
• Upside Gap Two Crows
• Two Crows
• Unique Three River Bottom
• Kicking
• Matching Low
• Side-by-Side White Lines
• Three Line Strike
• in Neck Line
There are techniques that can be used in computerized candle pattern
identification that will still allow these patterns to be used. For example,
one could set some parameters that relate the data components from
"greater than" to "greater than or equal to." As a result a requirement that
the open of one day to be less than the close of the previous day could be
modified so that the open could also be equal. Although this may stretch
the philosophy of candle pattern recognition too far, it at least permits the
use of data that do not contain the open price.
Today's electronic capabilities let traders watch intraday price move-
ments from single trade ticks, one minute bars, and almost any other
conceivable increment in between. It is not the purpose here to decide
which type is better, but sometimes the trees do get in the way of the
forest. One must also keep in mind that candle patterns reflect the short
term psychology of trading, including the decision process that occurs after
a market is closed. This is why open and close prices are so important.
Chapter 6
Using intraday day data without the benefit of a break is questionable at
the very least.
The Idea
Pattern recognition has been around for many years. A computer can check
and scan vast amounts of data and compile unlimited statistics on patterns
and their ability to forecast prices. This approach never remains popular
for very long because it is based solely on statistics and overlooks an
important explanation of why some patterns are more successful than oth-
ers—human psychology.
Enter Human Psychology
In the first few minutes of the trading day, a great deal of overnight
emotion is captured. Sometimes special events will even cause chaos. For
example, on the New York Exchange, it may take several minutes for the
specialists to open a stock for trading because of a large order imbalance.
However, once a stock or commodity does open, a point of reference has
been established. From this reference point, trading decisions are made
throughout the day.
As the trading day progresses, extremes are reached as speculator emo-
tion is tossed around. These extremes of emotion are recorded as the high
and low of the trading day. Finally, the trading day ends and the last trade
is recorded as the closing price. This is the price that many will use to help
make decisions about their positions and the tactics they will use at the
open of the next trading day.
Aside from intraday data, four prices are normally available for the
trader to analyze. One certainly knows the exact open and close prices for
any trading day, but at what times during the day the high and low were
reached, and in what order, are not known.
How does one determine the existence of a candlestick pattern?
The Philosophy Behind candle Pattern Identification
Most candle patterns require the identification of, not only the data
relationship making the pattern, but also the trend immediately preceding
the pattern. The trend is what sets up the psychology of traders for the
candle pattern to develop. Most of the current literature somehow evades
this essential ingredient to candle pattern recognition.
It must also be stated here that Japanese candlestick analysis is short
term (one to ten days) analysis. Any patterns that give longer term results
are surely just coincidental.
Trend Determination
What is a trend? This question, if it could be answered in depth, could
reveal the secrets of the marketplace and maybe even the universe. For this
discussion, only a simple and highly reliable short term answer is sought.
Trend analysis is a primary part of technical analysis. To some, trend
identification is as important as the timing of reversal points in the market.
Technical analysis books deal with the subject of trend quite thoroughly
and define it in numerous ways. One of the most common approaches is
the moving average.
Moving Averages and Smoothing
One of the simplest market systems created, the moving average, works
almost as well as the best of the complicated smoothing techniques. A
moving average is exactly the same as a regular average except that it
"moves" because it is continuously updated as new data become available.
Each data point in a moving average is given equal weight in the compu-
tation, hence the term arithmetic or simple is sometimes used when refer-
ring to a moving average.
A moving average smooths a sequence of numbers so that the effects
of short term fluctuations are reduced, while those of longer term fluctua-
tions remain relatively unchanged. Obviously, the time span of the moving
average will alter its characteristics.
Chapter 6
J. M. Hurst in The Profit Magic of Stock Transaction Timing (1970)
explained these alterations with three general rules:
1. A moving average of any given time span exactly reduces the
magnitude of the fluctuations of duration equal to that time span to
zero.
2. The same moving average also greatly reduces (but does not elim-
inate) the magnitude of all fluctuations of duration less than the
time span of the moving average.
3. All fluctuations are greater than the time span of the average "come
through," or are also present in the resulting moving average line.
Those with durations just a little greater than the span of the aver-
age are greatly reduced in magnitude, but the effect lessens as
periodicity duration increases. Very long duration periodicities
come through nearly unscathed.
A somewhat more advanced smoothing technique is the exponential
moving average. In principle, it accomplishes the same thing as the simple
(arithmetic) moving average. Exponential smoothing was developed to
assist in radar tracking and flight path projection. A quicker projection of
trend was needed with more influence from the most recent data. The
formula for exponential smoothing appears complex, but it is only another
way of weighting the data components so that the most recent data receive
the greatest weight. Even though only two data points are required to get
an exponentially smoothed value, the more data used the better. All of the
data are used and are a part of the new result.
A simple explanation of exponential smoothing is therefore given here.
An exponential average utilizes a smoothing constant that approximates
the number of days for a simple moving average. This constant is multi-
plied by the difference between today's closing price and the previous
day's moving average value. This new value is then added to the previous
day's moving average value. The smoothing constant is equivalent to
2/(n+l) where n is the number of days used for a simple moving average.
The Philosophy Behind Candle Pattern identification
The Trend Method used
After conducting numerous tests, a short term exponential smoothing of
the data was determined to best identify the short term trend. It gives the
best, easiest, and quickest determination of the short term trend and is
certainly a concept which one can understand. Simple concepts are usually
more reliable and certainly more creditable.
Numerous tests were performed on vast amounts of data with the find-
ing that a exponential period of ten days seemed to work as well as any,
especially when you recall that candlesticks have a short term orientation.
Identifying the Candle Patterns
Previous chapters presented detailed descriptions of the exact relationships
among the open, high, low, and close. Those chapters also dealt with the
concept of trend use, while this chapter focused on trend determination. In
addition, a method of determining long days, short days, doji days, etc. is
needed, including the relationship between the body and the shadows. The
latter is essential for proper identification of patterns such as the Hanging
Man and Hammer. The following sections will show the multitude of
methods used to accomplish these and similar tasks.
Long Days
Any of three different methods are available, where each, or any combina-
tion, of the three can be used to determine long days. The term minimum
in these formulas refers to the minimum acceptable percentage for a long
day. Any day whose body is greater than this minimum value will be
considered a long day.
1. Long Body / Price - Minimum (0 to 100%)
This method will relate the day in question with the actual value of
the prices for a stock or commodity. If the value is set at 5% and
the price is at 100, then a long day will be any day whose range
patterns. Patterns such as the Shooting Star and Inverted Hammer use just
the inverse of these settings.
Doji Days
Doji occurs when the open and close prices are equal. This is an exception-
ally restrictive rule for most types of data and should have some leeway
when identifying candle patterns. The formula lets you set a percentage
difference between the two prices that will be acceptable.
Doji Body / High to Low Range - Maximum (0 to 100%)
This value is a percentage maximum of the prices relative to the range
of prices on the Doji day. A value in the neighborhood of 1 to 3% seems
to work quite well.
Equal Values
Equal values occur when prices are required to be equal. This is used for
patterns like Meeting Lines and Separating Lines. Meeting Lines require
that the close price of each day be equal; while Separating Lines require
the open prices to be equal. The same concept used in determining a Doji
day can be used here as well. There are a few instances when setting the
parameters to the literal definition will restrict, rather than enhance, the
pattern concept.
Computerized Analysis and Anomalies
The candle pattern statistics in Table 6-1 shows the amount of data used in
this analysis, the type of data used, and various other pertinent statistics.
Data were obtained from stocks with and without open price, CSI's perpet-
ual futures contracts, and leading market indexes.
A total pattern frequency of slightly less than 11% equates to one
candle pattern about every nine trading days. This represents a good fre-
quency for daily analysis of stocks and futures. Reversal patterns occur
The Philosophy Behind candle Pattern identification
Table 6-1
about 30 times more often than continuation patterns. This too is impor-
tant, as it indicates the reversal of a trend caused by changed positions in
trading. In this analysis, there were 48 reversal patterns and 14 continua-
tion patterns, which makes reversal patterns account for about 77% of all
patterns.
It is also interesting to note that 6 patterns account for almost 9% of all
patterns. Of this, the Harami pattern accounts for 32% of those 6 patterns
and almost 3% of all patterns. Finally, please note that some patterns
occurred quite infrequently. To assess whether or not they have any value,
you should refer to the scoring statistics in Chapter 7. When a pattern
occurs, you must understand that, statistically, the success or failure does
not mean much. Success and/or failure of candle patterns is dealt with
extensively in Chapter 7.
When a particular pattern appears only a few times in a large amount
of data, you should realize that its success and/or failure is subject to the
time period under study. Do not let statistics interfere with common sense,
and certainly be alert for inaccuracies in the data.
The Philosophy Behind Candle Pattern Identification
Remember, candle patterns were used as a visual charting technique
for hundreds of years. With computers there is no way to handle the
subjectivity that classic chart reading offers. Another factor to consider
when using computers is the quality of the graphics screen: its resolution.
The screen consists of small dots of light known as pixel elements. If too
much data is used, or if the range of the data is too great, then what might
appear as equal on the screen would not be so numerically. The smallest
size (width) horizontal line could have a price range within itself, not
visible to the eye. Not only computer screens, but also computer generated
chart books could have this problem. This is why some flexibility must be
built into the identification of, and definition of, the classic patterns.
Another computer anomaly arises in handling candle patterns that are
within, or part of, another candle pattern. A computer will look at the data
in chronological order, that is, old data first. As each day is added, a candle
pattern may or may not be noted. When a pattern is identified, the results
are stored and the process continues. If a bullish Engulfing Day is identi-
fied and the next day has a white body with a close greater than the first
day of the Engulfing Day, a Three Outside Up pattern is noted and re-
corded. The data for statistics and testing has been acquired for both pat-
terns. However, only the Three Outside Up pattern will be identified as a
candle pattern if it is given higher priority.