Optical Networks: A Practical Perspective - Part 11 ppsx
Bạn đang xem bản rút gọn của tài liệu. Xem và tải ngay bản đầy đủ của tài liệu tại đây (526.22 KB, 10 trang )
70
PROPAGATION OF SIGNALS IN OPTICAL FIBER
I
Figure
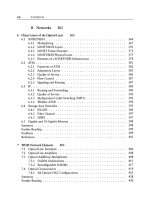
2.8 A (negatively) chirped Gaussian pulse. Here, and in all such figures, we show
the shape of the pulse as a function of time.
unchirped pulses to acquire a chirp. It then becomes important to study the effect of
chromatic dispersion on such pulses. The third reason is that the best transmission
performance is achieved today by the use of Gaussian pulses that are deliberately
chirped. (We will discuss these systems in Section 2.5.1 and in Chapter 5.)
Pulses with a Gaussian envelope are used in high-performance systems employing
RZ modulation (see Section 4.1). For most other systems, the pulses used tend to be
rectangular rather than Gaussian. However, the results we derive will be qualitatively
valid for most pulse envelopes. In Appendix E, we describe mathematically how
chirped Gaussian pulses propagate in optical fiber. The key result that we will use in
subsequent discussions here is that after a pulse with initial width To has propagated
a distance z, its width
Tz
is given by
1(
)2(
_ _ Ki32z I32z ] 2
rz ]+ +
(2.13)
Here K is called the
chirp factor
of the pulse and is proportional to the rate of change
of the pulse frequency with time. (A related parameter, which depends on both the
chirp and the pulse rise-time, is called the
source frequency chirp factor, c~,
in the
Telcordia SONET standard GR.253.)
Broadening of Chirped Gaussian Pulses
Figure 2.9 shows the pulse-broadening effect of chromatic dispersion graphically. In
these figures, the center or carrier frequency of the pulse, coo, has deliberately been
shown greatly diminished for the purposes of illustration. We assume/32 is negative;
this is true for standard single-mode fiber in the
1.55
lzm band. Figure 2.9(a) shows
an unchirped (K = 0) Gaussian pulse, and Figure 2.9(b) shows the same pulse after
2.3 Chromatic Dispersion 71
After distance 2 L D
(a) (b)
4
After distance 0.4
L D
(c) (d)
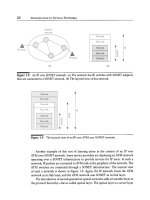
Figure
2.9 Illustration of the pulse-broadening effect of chromatic dispersion on
unchirped and chirped Gaussian pulses (for/~2 < 0). (a) An unchirped Gaussian pulse at
z = 0. (b) The pulse in (a) at z =
2Lb.
(c) A chirped Gaussian pulse with x = -3 at z = 0.
(d) The pulse in (c) at z = 0.4Lb. For systems operating over standard single-mode fiber
at 1.55/,m,
LD ,~
1800 km at 2.5 Gb/s, whereas
LD ,~
115 km at 10 Gb/s.
it has propagated a distance
2T2/1,821
along the fiber. Figure 2.9(c) shows a chirped
Gaussian pulse with K = -3, and Figure 2.9(d) shows the same pulse after it has
propagated a distance of only
0.4T2/j,821
along the fiber. The amount of broadening
can be seen to be about the same as that of the unchirped Gaussian pulse, but the
distance traveled is only a fifth. This shows that the presence of chirp significantly
exacerbates the pulse broadening due to chromatic dispersion (when the product Kfl2
is positive).
The quantity T2/I/~21 is called the
dispersion length
and is denoted by
LD.
It
serves as a convenient normalizing measure for the distance z in discussing the
effects of chromatic dispersion. For example, the effects of chromatic dispersion can
be neglected if z << LD since in that case, from (2.13),
Tz/To
~ 1. It also has the
interpretation that the width of an unchirped pulse at the 1/e-intensity point increases
by a factor of C~ after it has propagated a distance equal to the dispersion length.
72
PROPAGATION OF SIGNALS IN OPTICAL FIBER
(a)
(b)
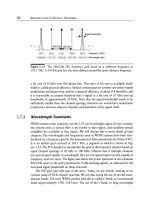
Figure
2.10 Illustration of the pulse compression effect of chromatic dispersion when
K/32 < 0. (a) A chirped Gaussian pulse with k: = -3 at z = 0. (b) The pulse in (a) at
z = 0.4LD.
The dispersion length for a 2.5 Gb/s system operating over standard single-mode
fiber at 1.55 #m is approximately 1800 km, assuming To = 0.2 ns, which is half the
bit interval. If the bit rate of the system is increased to 10 Gb/s with To = 0.05 ns,
again half the bit interval, the dispersion length decreases to approximately 115 km.
This indicates that the limitations on systems due to chromatic dispersion are much
more severe at 10 Gb/s than at 2.5 Gb/s. We will discuss the system limitations of
chromatic dispersion in Section 5.7.2. (The chromatic dispersion limit at 2.5 Gb/s is
considerably shorter, about 600 km, than the dispersion length of 1800 km because
NRZ pulses are used.)
For I( = 0 and z = 2LD, (2.13) yields Tz/To = ~/5 ~ 2.24. For a: = -3 and
z = 0.4LD, (2.13) yields Tz/To = ~/5 ~ 2.24. Thus both pulses broaden to the same
extent, and these values are in agreement with Figure 2.9.
An interesting phenomenon occurs when the product Kfl2 is negative. The pulse
initially undergoes compression up to a certain distance and then undergoes broaden-
ing. This is illustrated in Figure 2.10. The pulse in Figure 2.10(a) is the same chirped
Gaussian pulse shown in Figure 2.9(c) and has the chirp parameter K = -3. But the
sign of/~2 is now positive (which is the case, for example, in the lower portion of the
1.3 lzm band), and the pulse, after it has propagated a distance z = 0.4Ln, is shown
in Figure 2.10(b). The pulse has now undergone compression rather than broad-
ening. This can also be seen from (2.13) since we now get Tz/To = 1/~/5 ~ 0.45.
However, as z increases further, the pulse will start to broaden quite rapidly. This
can be seen from Figure 2.11, where we plot the pulse width evolution as a function
of distance for different chirp parameters. (Also see Problem 2.11.) We will discuss
this phenomenon further in Sections 2.4.5 and 2.4.6.
2.5
K= I
~"~ 1.5
0.5
2.3 Chromatic Dispersion
73
i i i i i
i
i , , ,
0.2 0.4 0.6 0.8 1 1.2 1.4
z/L D
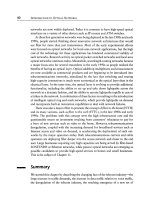
Figure 2.11 Evolution of pulse width as a function of distance
(z/LD)
for chirped and
unchirped pulses in the presence of chromatic dispersion. We assume f12 < 0, which is
the case for 1.55 #m systems operating over standard single-mode fiber. Note that for
positive chirp the pulse width initially decreases but subsequently broadens more rapidly.
For systems operating over standard single-mode fiber at 1.55/~m,
L D ~
1800 km at
2.5 Gb/s, whereas L D ~'~ 115 km at 10 Gb/s.
An intuitive explanation of pulse compression and broadening due to chromatic
dispersion is as follows. For a negatively chirped pulse, the instantaneous frequency
decreases with increasing time, as illustrated in Figures 2.9(c) and 2.10(a). When
/32 > 0, higher-frequency (components of) pulses travel faster than lower-frequency
(components of) pulses, and vice versa. Thus, when f12 > 0, the tail of the pulse,
which has higher-frequency components, travels faster than the head of the pulse,
which has lower-frequency components, resulting in pulse compression. This is the
situation illustrated in Figure 2.10. When/32 < 0, the situation is reversed: the tail
of the pulse travels slower than the head of the pulse, and the pulse broadens. This
is the situation illustrated in Figure 2.9(c) and (d).
The pulse compression phenomenon can be used to increase the transmission
distance before chromatic dispersion becomes significant, if the sign of Kfl2 can
be made negative. Since the output of directly modulated semiconductor lasers is
negatively chirped, the fiber must have a positive/32 for pulse compression to occur.
While standard single-mode fiber cannot be used because it has negative/32 in the
1.55
#m band, Corning's Metrocor fiber has positive/32 in this band. This fiber has
been designed specifically to take advantage of this pulse compression effect in the
design of metropolitan systems.
74
PROPAGATION OF SIGNALS IN OPTICAL FIBER
A careful observation of Figure 2.9(b) shows that the unchirped Gaussian pulse
acquires chirp when it has propagated some distance along the fiber. Furthermore, the
acquired chirp is negative since the frequency of the pulse decreases with increasing
time, t. The derivation of an expression for the acquired chirp is left as an exercise
(Problem 2.9).
2.3.2
Controlling the Dispersion Profile
Group velocity dispersion is commonly expressed in terms of the
chromatic disper-
sion parameter D
that is related to/32 as D = - (27rc/)~2)f12. The chromatic dispersion
parameter is measured in units of ps/nm-km since it expresses the temporal spread
(ps) per unit propagation distance (km), per unit pulse spectral width (nm). D can
be written as D -
DM + Dw,
where
DM
is the material dispersion and
Dw
is the
waveguide dispersion, both of which we have discussed earlier. Figure 2.12 shows
DM, Dw,
and D for standard single-mode fiber.
DM
increases monotonically with
~. and equals 0 for ~. = 1.276/zm. On the other hand,
Dw
decreases monotonically
with )~ and is always negative. The total chromatic dispersion D is zero around
~. = 1.31 ~m; thus the waveguide dispersion shifts the zero-dispersion wavelength
30
~. 20
10
r~
&
~ 0
0
~ -10
r~
,, ~
-20
1.1
Material
disp~
. _ll~___~J____ ~.dispersion
~~
',
x dispersion
l~2 > u dispersion dispersion tJ2 < u
, , , | i , | | , l | , , , i i i , , , , I
1.2 1.3 1.4 1.5 1.6 1.7
Wavelength, ~ (~tm)
Figure
2.12 Material, waveguide, and total dispersion in standard single-mode optical
fiber. Recall that chromatic dispersion is measured in units of ps/nm-km since it expresses
the temporal spread (ps) per unit propagation distance (km), per unit pulse spectral width
(nm). (After [Agr97].)
2.3 Chromatic Dispersion 75
by a few tens of nanometers. Around the zero-dispersion wavelength, D may be
approximated by a straight line whose slope is called the
chromatic dispersion slope
of the fiber.
For standard single-mode fiber, the chromatic dispersion effects are small in the
1.3 #m band, and systems operating in this wavelength range are loss limited. On
the other hand, most optical communication systems operate in the 1.55 #m band
today because of the low loss in this region and the well-developed erbium-doped
fiber amplifier technology. But as we have already seen, optical communication
systems in this band are chromatic dispersion limited. This limitation can be reduced
if somehow the zero-dispersion wavelength were shifted to the
1.55 #m band.
We do not have much control over the material dispersion
DM
though it can
be varied slightly by doping the core and cladding regions of the fiber. How-
ever, we can vary the waveguide dispersion Dw considerably so as to shift the
zero-dispersion wavelength into the
1.55 #m band. Fibers with this property are
called
dispersion-shifted fibers (DSF). Such fibers have a chromatic dispersion of at
most 3.3 ps/nm-km in the
1.55 #m wavelength range and typically zero dispersion
at
1550 nm. A large fraction of the installed base in Japan is DSE
Recall that when/32 > 0, the chromatic dispersion is said to be
normal, and when
/32 < 0, the chromatic dispersion is said to be
anomalous. Pulses in silica fiber expe-
rience normal chromatic dispersion below the zero-dispersion wavelength, which is
around 1.3 #m for standard single-mode fiber. Pulses experience anomalous disper-
sion in the entire
1.55 #m band in standard single-mode fiber. For dispersion-shifted
fiber, the dispersion zero lies in the
1.55 #m band. As a result, pulses in one part of
the
1.55 #m band experience normal chromatic dispersion, and pulses in the other
part of the band experience anomalous chromatic dispersion.
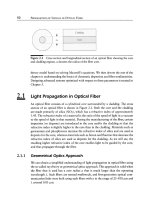
The waveguide dispersion can be varied by varying the
refractive index profile
of the fiber, that is, the variation of refractive index in the fiber core and cladding. A
typical refractive index profile of a dispersion-shifted fiber is shown in Figure 2.13(b).
Comparing this with the refractive index profile of a step-index fiber shown in Fig-
ure 2.13(a), we see that, in addition to a trapezoidal variation of the refractive index
in the fiber core, there is step variation of the refractive index in the cladding. Such
a variation leads to a single-mode fiber with a dispersion zero in the
1.55 #m band.
As we will see in Section 5.7.3, fibers with very large chromatic dispersions
(but with the opposite sign) are used to compensate for the accumulated chromatic
dispersion on a lengthy link. The refractive index profile of such a fiber is shown
in Figure 2.13(c). The core radius of such a fiber is considerably smaller than that
of standard single-mode fiber but has a higher refractive index.This leads to a large
negative chromatic dispersion. This core is surrounded by a ring of lower refractive
index, which is in turn surrounded by a ring of higher refractive index. Such a
76
PROPAGATION OF SIGNALS IN OPTICAL FIBER
Di~
,tance from core center
(a)
Distance from core center Distance from core center
(b) (c)
Figure 2.13 Typical refractive index profile of (a) step-index fiber, (b) dispersion-shifted
fiber, and (c) dispersion-compensating fiber. (After [KK97, Chapter 4].)
variation leads to a negative chromatic dispersion slope, an important characteristic
for chromatic dispersion compensation, as we will see in Section 5.7.3.
2.4
Nonlinear Effects
Our description of optical communication systems under the linearity assumption
we made in Section 2.1.2 is adequate to understand the behavior of these systems
when they are operated at moderate power (a few milliwatts) and at bit rates up to
about 2.5 Gb/s. However, at higher bit rates such as 10 Gb/s and above and/or at
higher transmitted powers, it is important to consider the effect of nonlinearities. In
the case of WDM systems, nonlinear effects can become important even at moderate
powers and bit rates.
There are two categories of nonlinear effects. The first arises due to the interaction
of light waves with phonons (molecular vibrations) in the silica medium one of
several types of scattering effects, of which we have already met one, namely, Rayleigh
scattering (Section 2.2). The two main effects in this category are
stimulated Brillouin
scattering
(SBS) and
stimulated Raman scattering
(SRS).
The second set of nonlinear effects arises due to the dependence of the refractive
index on the
intensity
of the applied electric field, which in turn is proportional to the
square of the field amplitude. The most important nonlinear effects in this category
are
self-phase modulation
(SPM) and
four-wave mixing
(FWM).
In scattering effects, energy gets transferred from one light wave to another
wave at a longer wavelength (or lower energy). The lost energy is absorbed by the
molecular vibrations, or phonons, in the medium. (The type of phonon involved is
different for SBS and SRS.) This second wave is called the
Stokes wave.
The first
wave can be thought of as being a "pump" wave that causes amplification of the
2.4 Nonlinear Effects 77
2.4.1
Stokes wave. As the pump propagates in the fiber, it loses power and the Stokes wave
gains power. In the case of SBS, the pump wave is the signal wave, and the Stokes
wave is the unwanted wave that is generated due to the scattering process. In the
case of SRS, the pump wave is a high-power wave, and the Stokes wave is the signal
wave that gets amplified at the expense of the pump wave.
In general, scattering effects are characterized by a gain coefficient g, measured
in meters per watt, and spectral width Af over which the gain is present. The gain
coefficient is a measure of the strength of the nonlinear effect.
In the case of self-phase modulation, the transmitted pulses undergo chirping.
This induced chirp factor becomes significant at high power levels. We have al-
ready seen in Section 2.3 that the pulse-broadening effects of chromatic dispersion
can be enhanced in the presence of chirp. Thus the SPM-induced chirp can signif-
icantly increase the pulse spreading due to chromatic dispersion in these systems.
For high-bit-rate systems, the SPM-induced chirp can significantly increase the pulse
spreading due to chromatic dispersion even at moderate power levels. The precise
effects of SPM are critically dependent not only on the sign of the GVD parameter
/32 but also on the length of the system.
In a WDM system with multiple channels, the induced chirp in one channel
depends on the variation of the refractive index with the intensity on the other
channels. This effect is called cross-phase modulation (CPM). When we discuss the
induced chirp in a channel due to the variation of the refractive index with the
intensity on the
same channel, we call the effect SPM.
In the case of WDM systems, another important nonlinear effect is that of
four-wave mixing. If the WDM system consists of frequencies fl, , fn, four-wave
mixing gives rise to new signals at frequencies such as 2fi
-
fj
and fi +
fj
fk.
These signals appear as crosstalk to the existing signals in the system. These crosstalk
effects are particularly severe when the channel spacing is tight. Reduced chromatic
dispersion enhances the crosstalk induced by four-wave mixing. Thus systems using
dispersion-shifted fibers are much more affected by four-wave mixing effects than
systems using standard single-mode fiber.
We will devote the rest of this section to a detailed understanding of the various
types of fiber nonlinearities.
Effective Length and Area
The nonlinear interaction depends on the transmission length and the cross-sectional
area of the fiber. The longer the link length, the more the interaction and the worse
the effect of the nonlinearity. However, as the signal propagates along the link, its
power decreases because of fiber attenuation. Thus, most of the nonlinear effects
occur early in the fiber span and diminish as the signal propagates.
78
PROPAGATION OF SIGNALS IN OPTICAL FIBER
Po
Power
Po
Power
Link length L Le
(a) (b)
Link length
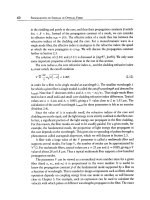
Figure
2.14 Effective transmission length calculation. (a) A typical distribution of the
power along the length L of a link. The peak power is
Po.
(b) A hypothetical uniform
distribution of the power along a link up to the effective length
Le.
This length
Le
is
chosen such that the area under the curve in (a) is equal to the area of the rectangle in
(b).
Modeling this effect can be quite complicated, but in practice, a simple model that
assumes that the power is constant over a certain
effective length
Le
has proved to be
quite sufficient in understanding the effect of nonlinearities. Suppose
Po
denotes the
power transmitted into the fiber and P (z) =
Poe -~z
denotes the power at distance z
along the link, with a being the fiber attenuation. Let L denote the actual link length.
Then the effective length (see Figure 2.14) is defined as the length
Le
such that
PoLe P(z)dz.
Z=0
This yields
1
- e -aL
Le ~ ~o
Ol
Typically, a = 0.22 dB/km at 1.55/zm wavelength, and for long links where L >> 1/a,
we have
Le ~
20 km.
In addition to the link length, the effect of a nonlinearity also grows with the
intensity in the fiber. For a given power, the intensity is inversely proportional to
the area of the core. Since the power is not uniformly distributed within the cross
section of the fiber, it is convenient to use an
effective cross-sectional
area Ae
(see
Figure 2.15), related to the actual area A and the cross-sectional distribution of the
fundamental mode F(r, 0), as
[ fr fo
IF(r,
0)12
rdrdO] 2
Ae - fr fo IF(r,
0)14
rdrdO '
2.4 Nonlinear Effects
79
Intensity
Intensity
Radius
fain) 1/2 Radius
(a) (b)
Figure 2.15 Effective cross-sectional area. (a) A typical distribution of the signal inten-
sity along the radius of optical fiber. (b) A hypothetical intensity distribution, equivalent
to that in (a) for many purposes, showing an intensity distribution that is nonzero only
for an
area
Ae
around the center of the fiber.
where r and 0 denote the polar coordinates. The effective area, as defined above,
has the significance that the dependence of most nonlinear effects can be expressed
in terms of the effective area for the fundamental mode propagating in the given
type of fiber. For example, the effective intensity of the pulse can be taken to be
Ie = P/Ae, where P is the pulse power, in order to calculate the impact of certain
nonlinear effects such as SPM, as we will see below. The effective area of SMF is
around 85/zm 2 and that of DSF around 50/zm 2. The dispersion compensating fibers
that we will study in Section 5.7.3 have even smaller effective areas and hence exhibit
higher nonlinearities.
2.4.2
Stimulated Brillouin Scattering
In the case of SBS, the phonons involved in the scattering interaction are acoustic
phonons, and the interaction occurs over a very narrow line width of AfB = 20 MHz
at
1.55/zm. Also the Stokes and pump waves propagate in opposite directions. Thus
SBS does not cause any interaction between different wavelengths, as long as the
wavelength spacing is much greater than 20 MHz, which is typically the case. SBS
can, however, create significant distortion within a single channel. SBS produces gain
in the direction opposite to the direction of propagation of the signal, in other words,
back toward the source. Thus it depletes the transmitted signal as well as generates a
potentially strong signal back toward the transmitter, which must be shielded by an
isolator. The SBS gain coefficient gB is approximately 4 x 10 -11 m/W, independent
of the wavelength.