Optical Networks: A Practical Perspective - Part 29 potx
Bạn đang xem bản rút gọn của tài liệu. Xem và tải ngay bản đầy đủ của tài liệu tại đây (596.4 KB, 10 trang )
250
MODULATION AND DEMODULATION
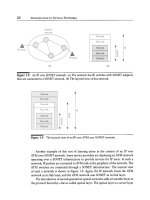
Figure 4.5 Block diagram showing the various functions involved in a receiver.
additional noise, which increases as the transmitted power is increased. Therefore
they in turn impose additional limits on channel capacity. Recent work to quantify
the spectral efficiency, taking into account mostly cross-phase modulation [Sta99,
MS00], shows that the achievable efficiencies are of the order of 3-5 b/s/Hz. Other
nonlinearities such as four-wave mixing and Raman scattering may place further
limitations. At the same time, we are seeing techniques to reduce the effects of these
nonlinearities.
Another way to increase the channel capacity is by reducing the noise level in
the system. The noise figure in today's amplifiers is limited primarily by random
spontaneous emission, and these are already close to theoretically achievable limits.
Advances in quantum mechanics [Gla00] may ultimately succeed in reducing these
noise limits.
4.4
Demodulation
The modulated signals are transmitted over the optical fiber where they undergo
attenuation and dispersion, have noise added to them from optical amplifiers, and
sustain a variety of other impairments that we will discuss in Chapter 5. At the
receiver, the transmitted data must be recovered with an acceptable
bit error rate
(BER). The required BER for high-speed optical communication systems tod~iy is in
the range of 10 -9 to 10 -15, with a typical value of 10 -12. A BER of 10 -12 corresponds
to one allowed bit error for every terabit of data transmitted, on average.
Recovering the transmitted data involves a number of steps, which we will discuss
in this section. Our focus will be on the demodulation of OOK signals. Figure 4.5
shows the block diagram of a receiver. The optical signal is first converted to an
electrical current by a
photodetector.
This electrical current is quite weak and thus
we use a
front-end amplifier
to amplify it. The photodetector and front-end amplifier
were discussed in Sections 3.6.1 and 3.6.2, respectively.
4.4 Demodulation 251
Bit boundaries Horizontal Vertical
~ opening opening
(a) (b)
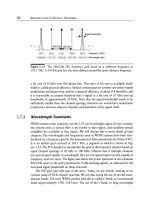
Figure
4.6 Eye diagram. (a) A typical received waveform along with the bit boundaries.
(b) The received waveform of (a), wrapped around itself, on the bit boundaries to generate
an eye diagram. For clarity, the waveform has been magnified by a factor of 2 relative to
(a).
The amplified electrical current is then filtered to minimize the noise outside
the bandwidth occupied by the signal. This filter is also designed to suitably shape
the pulses so that the bit error rate is minimized. This filter may also incorporate
additional functionality, such as minimizing the intersymbol interference due to pulse
spreading. If the filter performs this function, it is termed an
equalizer.
The name
denotes that the filter equalizes, or cancels, the distortion suffered by the signal.
Equalization is discussed in Section 4.4.9.
The signal must then be sampled at the midpoints of the bit intervals to decide
whether the transmitted bit in each bit interval was a 1 or a 0. This requires that the
bit boundaries be recovered at the receiver. A waveform that is periodic with period
equal to the bit interval is called a
clock.
This function is termed
clock recovery,
or
timing recovery,
and is discussed in Section 4.4.8.
A widely used experimental technique to determine the goodness of the received
signal is the
eye diagram.
Consider the received waveform shown in Figure 4.6(a).
This is a typical shape of the received signal for NRZ modulation, after it has been
filtered by the receive filter and is about to be sampled (see Figure 4.5). The bit
boundaries are also shown on the figure. If the waveform is cut along at the bit
boundaries and the resulting pieces are superimposed on each other, we get the
resulting diagram shown in Figure 4.6(b). Such a diagram is called an
eye diagram
because of its resemblance to the shape of the human eye. An eye diagram can be
easily generated experimentally using an oscilloscope to display the received signal
while it is being triggered by the (recovered) clock. The vertical opening of the eye
indicates the margin for bit errors due to noise. The horizontal opening of the eye
indicates the margin for timing errors due to an imperfectly recovered clock.
252 MODULATION AND DEMODULATION
4.4.1
In Section 1.5, we saw that there could be different types of repeaters, specifically
2R (regeneration with reshaping) and 3R (regeneration with reshaping and retiming).
The difference between these primarily lies in the type of receiver used. A 2R receiver
does not have the timing recovery circuit shown in Figure 4.5, whereas a 3R does.
Also a 3R receiver may use a multirate timing recovery circuit, which is capable of
recovering the clock at a variety of data rates.
An Ideal Receiver
In principle, the demodulation process can be quite simple. Ideally, it can be viewed as
"photon counting," which is the viewpoint we will take in this section. In practice,
there are various impairments that are not accounted for by this model, and we
discuss them in the next section.
The receiver looks for the presence or absence of light during a bit interval. If no
light is seen, it infers that a 0 bit was transmitted, and if any light is seen, it infers
that a 1 bit was transmitted. This is called
direct detection. Unfortunately, even in the
absence of other forms of noise, this will not lead to an ideal error-free system because
of the random nature of photon arrivals at the receiver. A light signal arriving with
power P can be thought of as a stream of photons arriving at average rate
P/hfr
Here, h is Planck's constant (6.63 x 10 -34 J/I-Iz), fc is the carrier frequency, and hfc
is the energy of a single photon. This stream can be thought of as a Poisson random
process.
Note that our simple receiver does not make any errors when a 0 bit is transmit-
ted. However, when a 1 bit is transmitted, the receiver may decide that a 0 bit was
transmitted if no photons were received during that bit interval. If B denotes the bit
rate, then the probability that n photons are received during a bit interval
1/B is
given by
e_(P/hfcB) (h-~cB ) n "
n!
Thus the probability of not receiving any photons is e -(P/hfcS). Assuming equally
likely ls and 0s, the bit error rate of this ideal receiver would be given as
1 P
BER- -e hies.
2
Let
M - P/hfcB. The parameter M represents the average number of photons
received during a 1 bit. Then the bit error rate can be expressed as
BER _ _1
e_M.
2
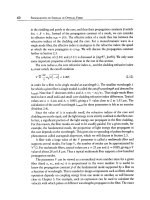
4.4 Demodulation 253
This expression represents the error rate of an ideal receiver and is called the quantum
limit.
To get a bit error rate of 10 -12, note that we would need an average of M - 27
photons per 1 bit.
In practice, most receivers are not ideal, and their performance is not as good
as that of the ideal receiver because they must contend with various other forms of
noise, as we shall soon see.
4.4.2
A Practical Direct Detection Receiver
As we have seen in Section 3.6 (see Figure 3.61), the optical signal at the receiver is
first photodetected to convert it into an electrical current. The main complication in
recovering the transmitted bit is that in addition to the photocurrent due to the signal
there are usually three other additional noise currents. The first is the thermal noise
current due to the random motion of electrons that is always present at any finite
temperature. The second is the shot noise current due to the random distribution
of the electrons generated by the photodetection process even when the input light
intensity is constant. The shot noise current, unlike the thermal noise current, is not
added to the generated photocurrent but is merely a convenient representation of
the variability in the generated photocurrent as a separate component. The third
source of noise is the spontaneous emission due to optical amplifiers that may be
used between the source and the photodetector. The amplifier noise currents are
treated in Section 4.4.5 and Appendix I. In this section, we will consider only the
thermal noise and shot noise currents.
The thermal noise current in a resistor R at temperature T can be mod-
eled as a Gaussian random process with zero mean and autocorrelation function
(4ksT/R)6(r). Here k8 is Boltzmann's constant and has the value 1.38 x 10 -23 J/~
and 6(r) is the Dirac delta function, defined as 6(r) - 0, r -r 0 and f_~ 6(r)dr - 1.
Thus the noise is white, and in a bandwidth or frequency range Be, the thermal noise
current has the variance
2
O'iherma 1
(4kBT/R)Be.
This value can be expressed as I2Be, where/t is the parameter used to specify the
current standard deviation in units of pA/qFH-z. Typical values are of the order of
i pA/,/~.
The electrical bandwidth of the receiver, Be, is chosen based on the bit rate of the
signal. In practice, Be varies from 1/2T to 1/T, where T is the bit period. We will
also be using the parameter Bo to denote the optical bandwidth seen by the receiver.
The optical bandwidth of the receiver itself is very large, but the value of Bo is usually
determined by filters placed in the optical path between the transmitter and receiver.
254
MODULATION AND DEMODULATION
4.4.3
By convention, we will
measure
Be
in baseband units and Bo in passband units.
Therefore, the minimum possible value of
Bo
- 2Be,
to
prevent signal distortion.
As we saw in the previous section, the photon arrivals are accurately modeled
by a Poisson random process. The photocurrent can thus be modeled as a stream
of electronic charge impulses, each generated whenever a photon arrives at the pho-
todetector. For signal powers that are usually encountered in optical communication
systems, the photocurrent can be modeled as
I = [+is,
where [ is a constant current, and is is a Gaussian random process with mean zero and
autocorrelation O-s2hot~(r). For
pin diodes, O-shot2 - 2el. This is derived in Appendix I.
The constant current [ - 7EP, where 7E is the responsivity of the photodetector,
which was discussed in Section 3.6. Here, we are assuming that the dark current,
which is the photocurrent that is present in the absence of an input optical signal, is
negligible. Thus the shot noise current is also white and in a bandwidth
Be has the
variance
2 = 2e[Be.
(4.2)
O'shot
If we denote the load resistor of the photodetector by RL, the total current in
this resistor can be written as
I - I +is +it,
where it has the variance
O-ihermal2 =
(4kBT/RL)Be. The shot noise and thermal noise
currents are assumed to be independent so that, if
Be is the bandwidth of the receiver,
this current can be modeled as a Gaussian random process with mean [ and variance
O-2 2 2
O-shot -t-O-thermal"
Note that both the shot noise and thermal noise variances are proportional to
the bandwidth
Be of the receiver. Thus there is a trade-off between the bandwidth
of a receiver and its noise performance. A receiver is usually designed so as to
have just sufficient bandwidth to accommodate the desired bit rate so that its noise
performance is optimized. In most practical direct detection receivers, the variance
of the thermal noise component is much larger than the variance of the shot noise
and determines the performance of the receiver.
Front-End Amplifier Noise
We saw in Chapter 3 (Figure 3.61) that the photodetector is followed by a front-end
amplifier. Components within the front-end amplifier, such as the transistor, also
4.4 Demodulation 255
contribute to the thermal noise. This noise contribution is usually stated by giving
the
noise figure
of the front-end amplifier. The noise figure Fn is the ratio of the input
signal-to-noise ratio (SNRi) to the output signal-to-noise ratio (SNRo). Equivalently,
the noise figure Fn of a front-end amplifier specifies the factor by which the thermal
noise present at the input of the amplifier is enhanced at its output. Thus the thermal
noise contribution of the receiver has variance
2
4kBT
O'therma 1 ~
Fn
Be
(4.3)
RL
when the front-end amplifier noise contribution is included. Typical values of F~ are
3-5 dB.
4.4.4
APD Noise
As we remarked in Section 3.6.1, the avalanche gain process in APDs has the effect
of increasing the noise current at its output. This increased noise contribution arises
from the random nature of the avalanche multiplicative gain,
Gm(t).
This noise
contribution is modeled as an increase in the shot noise component at the output
of the photodetector. If we denote the responsivity of the APD by 7~APD, and the
average avalanche multiplication gain by
Gm,
the average photocurrent is given by
[ - 7~APDP
Gm~P,
and the shot noise current at the APD output has variance
2 =
2e
2
O'shot
G
m FA ( G m )
~ P Be.
(4.4)
The quantity
FA (Gm)
is called the
excess noise factor
of the APD and is an increasing
function of the gain
Gm.
It is given by
FA(Gm) = kAGm
+ (l kA)(2 1/Gm).
The quantity
kA
is called the ionization coefficient ratio and is a property of the
semiconductor material used to make up the APD. It takes values in the range (0-1).
The excess noise factor is an increasing function of
kA,
and thus it is desirable to
keep
ka
small. The value of
kz
for silicon (which is used at 0.8 #m wavelength) is
<< 1, and for InGaAs (which is used at 1.3 and 1.55/~m wavelength bands) is 0.7.
Note that
FA
(1) = 1, and thus (4.4) also yields the shot noise variance for a
pin
receiver if we set
Gm = 1.
4.4.5
Optical Preamplifiers
As we have seen in the previous sections, the performance of simple direct detection
receivers is limited primarily by thermal noise generated inside the receiver. The
256
MODULATION AND DEMODULATION
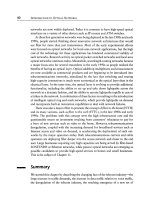
performance can be improved significantly by using an optical (pre)amplifier after
the receiver, as shown in Figure 4.7. The amplifier provides added gain to the input
signal. Unfortunately, as we saw in Section 3.4.2, the spontaneous emission present
in the amplifier appears as noise at its output. The amplified spontaneous (ASE)
noise power at the output of the amplifier for each polarization mode is given by
PN = nsphfc(G - 1)Bo,
(4.5)
where nsp is a constant called the spontaneous emission factor, G is the amplifier
gain, and
Bo
is the optical bandwidth. Two fundamental polarization modes are
present in a single-mode fiber, as we saw in Chapter 2. Hence the total noise power
at the output of the amplifier is
2PN.
The value of nsp depends on the level of population inversion within the amplifier.
With complete inversion nsp = 1, but it is typically higher, around 2-5 for most
amplifiers.
For convenience in the discussions to follow, we define
Pn nsphfc.
To understand the impact of amplifier noise on the detection of the received
signal, consider the optical preamplifier system shown in Figure 4.7, used in front of
a standard
pin
direct detection receiver. The photodetector produces a current that
is proportional to the incident power. The signal current is given by
I =~GP, (4.6)
where P is the received optical power.
The photodetector produces a current that is proportional to the optical power.
The optical power is proportional to the square of the electric field. Thus the noise
field beats against the signal and against itself, giving rise to noise components
referred to as the
signal-spontaneous
beat noise and
spontaneous-spontaneous
beat
noise, respectively. In addition, shot noise and thermal noise components are also
present.
Figure 4.7 A receiver with an optical preamplifier.
4.4 Demodulation 257
The variances of the thermal noise, shot noise, signal-spontaneous noise, and
spontaneous-spontaneous noise currents at the receiver are, respectively,
2
Crtherma 1
I2Be,
(4.7)
2 _ 2eT~[GP 4- Pn(G- 1)Bo]Be,
(4.8)
{}'shot
2 - 4~2GPPn(G - 1)Be
(4.9)
O'sig_spon t ~
and
2 2Tg2[pn(G-
1)]2(2Bo-
Be)Be
O'spont_spon t -
(4.10)
These variances are derived in Appendix I. Here
It
is the receiver thermal noise
current. Provided the amplifier gain is reasonably large (> 10 dB), which is usu-
ally the case, the shot noise and thermal noise are negligible compared to the
signal-spontaneous and spontaneous-spontaneous beat noise. In the bit error rate
regime of interest to us (10 -9 to 10-15), these noise processes can be modeled ade-
quately as Gaussian processes. The spontaneous-spontaneous beat noise can be made
very small by reducing the optical bandwidth
Bo.
This can be done by filtering the
amplifier noise before it reaches the receiver. In the limit,
Bo
can be made as small as
2Be.
So the dominant noise component is usually signal-spontaneous beat noise.
The amplifier noise is commonly specified by the easily measurable parameter
known as the noise figure. Recall from Section 4.4.3 that the noise figure Fn is the
ratio of the input signal-to-noise ratio (SNRi) to the output signal-to-noise ratio
(SNRo). At the amplifier input, assuming that only signal shot noise is present, using
(4.2) and (4.6), the SNR is given by
(7~.P) 2
SNRi
= 27~e P Be
At the amplifier output, assuming that the dominant noise term is the
signal-spontaneous beat noise, using (4.6) and (4.9), the SNR is given by
SNRo
(TCGP) 2
4~2pG(G- 1)nsphfcBe
The noise figure of the amplifier is then
SNRi
- ~ 2nsp (4 11)
Fn - SNRo
In the best case, with full population inversion, nsp - 1. Thus the best-case noise
figure is 3 dB. Practical amplifiers have a somewhat higher noise figure, typically in
258 MODULATION AND DEMODULATION
4.4.6
the 4-7 dB range. This derivation assumed that there are no coupling losses between
the amplifier and the input and output fibers. Having an input coupling loss degrades
the noise figure of the amplifier (see Problem 4.5).
Bit Error Rates
Earlier, we calculated the bit error rate of an ideal direct detection receiver. Next, we
will calculate the bit error rate of the practical receivers already considered, which
must deal with a variety of different noise impairments.
The receiver makes decisions as to which bit (0 or 1) was transmitted in each
bit interval by sampling the photocurrent. Because of the presence of noise currents,
the receiver could make a wrong decision resulting in an erroneous bit. In order to
compute this bit error rate, we must understand the process by which the receiver
makes a decision regarding the transmitted bit.
First, consider a
pin
receiver without an optical preamplifier. For a transmitted
1 bit, let the received optical power P P1, and let the mean photocurrent [ = I1.
Then I1 = 7EP1, and the variance of the photocurrent is
cr~ 2eI1Be + 4kBTBe/RL.
If P0 and I0 are the corresponding quantities for a 0 bit, I0 - 7EP0, and the variance
of the photocurrent is
ag 2eloBe -+-4kBTBe/RL.
For ideal OOK, P0 and I0 are zero, but we will see later (Section 5.3) that this is not
always the case in practice.
Let I1 and I0 denote the photocurrent sampled by the receiver during a i bit and
a 0 bit, respectively, and let a12 and or02 represent the corresponding noise variances.
The noise signals are assumed to be Gaussian. The actual variances will depend
on the type of receiver, as we saw earlier. So the bit decision problem faced by the
receiver has the following mathematical formulation. The photocurrent for a i bit is
a sample of a Gaussian random variable with mean I1 and variance or1 (and similarly
for the 0 bit as well). The receiver must look at this sample and decide whether the
transmitted bit is a 0 or a 1. The possible probability density functions of the sampled
photocurrent are sketched in Figure 4.8. There are many possible
decision rules
that
the receiver can use; the receiver's objective is to choose the one that minimizes the
bit error rate. This
optimum decision rule
can be shown to be the one that, given
the observed photocurrent I, chooses the bit (0 or 1) that was
most likely
to have
been transmitted. Furthermore, this optimum decision rule can be implemented as
follows. Compare the observed photocurrent to a decision threshold Ith. If I >__ Ith,
decide that a 1 bit was transmitted; otherwise, decide that a 0 bit was transmitted.
4.4 Demodulation
259
Figure
4.8 Probability density functions for the observed photocurrent.
For the case when 1 and 0 bits are equally likely (which is the only case we
consider in this book), the threshold photocurrent is given approximately by
ooll + o1 Io
Ith 9 (4.12)
o-o+o1
This value is very close but not exactly equal to the optimal value of the threshold.
The proof of this result is left as an exercise (Problem 4.7). Geometrically, Ith is the
value of I for which the two densities sketched in Figure 4.8 cross. The probability
of error when a 1 was transmitted is the probability that I < Ith and is denoted by
P[011]. Likewise, P[110] is the probability of deciding that a I was transmitted when
actually a 0 was transmitted and is the probability that I > Ith. Both probabilities
are indicated in Figure 4.8.
Let
Q(x)
denote the probability that a zero mean, unit variance Gaussian random
variable exceeds the value x. Thus
1 f~
/2
Q(x) = ~
x 8-y2
dy.
(4.13)
It now follows that
P[OI1]-
Q(II-Ith)o.1
and