Label free and reagentless electrochemical detection of microRNAs using a conducting polymer nanostructured by carbon nanotubes application to prostate cancer biomarker mir 141
Bạn đang xem bản rút gọn của tài liệu. Xem và tải ngay bản đầy đủ của tài liệu tại đây (748.09 KB, 6 trang )
Label-free and reagentless electrochemical detection of microRNAs
using a conducting polymer nanostructured by carbon nanotubes:
Application to prostate cancer biomarker miR-141
H.V. Tran
a,b
, B. Piro
a
, S. Reisberg
a
, L.D. Tran
c
, H.T. Duc
d
, M.C. Pham
a,
n
a
Université Paris Diderot, Sorbonne Paris Cité, ITODYS, UMR 7086 CNRS, 15 rue J-A de Baïf, 75205 Paris Cedex 13, France
b
USTH, University of Science and Technology of Hanoi, 18 Hoang Quoc Viet, Hanoi, Viet Nam
c
Institute of Material Sciences (IMS), Vietnamese Academy of Science and Technology, 18 Hoang Quoc Viet, Hanoi, Viet Nam
d
Université Paris XI, INSERM U-1014, Groupe Hospitalier Paul Brousse, 94800 Villejuif, France
article info
Article history:
Received 4 February 2013
Received in revised form
12 April 2013
Accepted 2 May 2013
Available online 14 May 2013
Keywords:
Conducting polymer
Square wave voltammetry
Oligonucleotides
Electrochemical biosensor
Label-free detection
MicroRNA
abstract
In this paper, a label-free and reagentless microRNA sensor based on an interpenetrated network of
carbon nanotubes and electroactive polymer is described. The nanostructured polymer film presents
very well-defined electroactivity in neutral aqueous medium in the cathodic potential domain from the
quinone group embedded in the polymer backbone. Addition of microRNA miR-141 target (prostate
cancer biomarker) gives a “signal-on” response, i.e. a current increase due to enhancement of the polymer
electroactivity. On the contrary, non-complementary miRNAs such as miR-103 and miR-29b-1 do not
lead to any significant current change. A very low detection limit of ca. 8 fM is achieved with this sensor.
& 2013 Elsevier B.V. All rights reserved.
1. Introduction
The biology of the late 20th century was marked by the
discovery in 1993 of a new class of small non-coding ribonucleic
acids (RNAs) which play major roles in regulating the translation
and degradation of messenger RNAs (Lee et al., 1993; Wightman
et al., 1993). These small RNAs (18–25 nucleotides), called micro-
RNAs (miRNAs), are implied in several biological processes such as
differentiation, metabolic homeostasis, cellular apoptosis and
proliferation (Iorio and Croce, 2009; Brase et al., 2010).
The discovery in 2008 that the presence of miRNAs in body
fluid is in correlation with cancer (prostate, breast, colon, lung,
etc.) or other diseases (diabetes, heart diseases, etc.) has made
them new key players as biomarkers (Lawrie et al., 2008;
Catuogno et al., 2011; Chen et al., 2008). Actually, more than
1200 miRNAs have been identified (Liu et al., 2012), among which
miR-141 is detected at elevated level in blood of patients having
metastatic prostate cancer (Mitchell et al., 2008).
Current standard methods for identification and quantification
of miRNAs are based on traditional molecular biology techniques
(Northern blot, microarray, qRT-PCR). These approaches although
very sensitive and reliable are often expensive, time consuming,
and need highly trained technicians (Hunt et al., 2009; Planell-
Saguer and Rodicio, 2011). That is why a real challenge is to
develop devices able to detect and quantify easily and simulta-
neously different miRNA sequences at sub-picomolar levels (Wang
et al., 2012). Ideally, these new bioanalytical tools should be easy
to manufacture, need low power, and allow reagentless and label-
free detection. Few work deal with such strategy, and particularly
very few when electrochemical transduction is involved. Electro-
chemical biosensors offer the advantages of mass fabrication, low
cost and potential decentralized analysis (Paleček and Bartošík,
2012).
Lusi et al. (2009) reported amperometric detection based on
oxidation of RNA nucleobases. This system allows detection at sub-
picomolar level (0.1 pM), but the current depends on the number
of guanine and needs high oxidation potentials, which may
generate side-oxidations. Using enzyme-labeled detection probes,
Kilic et al. (2012) reported detection for miR-21 with a detection
limit of 1 μM. Gao and Peng (2011) achieved a detection limit of
10 fM. Allosteric molecular beacons able to bind HRP enzyme were
used by Cai et al. (2003), with a detection limit of 44 amol in a
volume of 4 μL, i.e. 11 pM. Yin et al. (2012) have shown a detection
limit of 60 fM for miR-21 with gold NPs bearing HRP. Using a
Contents lists available at SciVerse ScienceDirect
journal homepage: www.elsevier.com/locate/bios
Biosensors and Bioelectronics
0956-5663/$ -see front matter & 2013 Elsevier B.V. All rights reserved.
/>n
Corresponding author. Tel.: +33 1 57277223.
E-mail address: (M.C. Pham).
Biosensors and Bioelectronics 49 (2013) 164–169
polymerase-labeled DNA probe and impedance measurements,
Shen et al. (2013) reported a LOD of 2 fM for a S/N of 3. Very high
sensitivity (0.1 fM) was obtained using peptide nucleic acid (PNA)
probes (Zhang et al., 2009). Qavi et al. (2010) proposed an
excellent review on miRNA analysis.
Conducting polymers constitute a powerful platform to immo-
bilize short DNA or RNA sequences while maintaining their
stability, accessibility and activity (Gerard et al., 2002; Cosnier,
2003, 1999). Unfortunately, label-free electrochemical biosensors
based on polymer-modified electrodes are known to suffer from
lack of sensitivity (Cosnier and Holzinger, 2011). To enhance
sensitivity, carbon nanotubes (CNTs) were frequently reported
(Wohlstadter et al., 2003; Wang, 2005) to increase the electro-
active area and decrease the electrical resistance of the working
electrodes, leading to 3D conductive materials (Peigney et al.,
2001; Kulesza et al., 2006; Acevedo et al., 2008). Qi et al. (2007)
fabricated an electrochemical DNA biosensor based on electro-
polymerised polypyrrole and carbon nanotubes, using ethidium
bromide as redox indicator with high sensitivity, ca. 85 pM. Very
few works were related to label-free and reagentless biosensors.
Okuno et al. (2007) described a label-free and reagentless
immunosensor for prostate-specific antigen based on single-
walled CNT-modified microelectrodes with low detection limit
(0.25 ng mL
−1
). The current being derived from oxidation of amino
acid residues (tyrosine and tryptophan), it is then dependent on
the presence of these residues in the target sequence. Zhang et al.
(2011) described a strategy for label-free and reagentless electro-
chemical DNA sensing based on SWNTs and an immobilized redox
probe. This system allows very specifi c detection of DNA but the
limit of detection is only 0.1 mM. 3D structures obtained using
CNTs may induce high capacitance which may introduce distortion
on cyclic voltammograms (Peng et al., 2007). In order to minimize
this effect, pulsed methods such as differential pulse voltammetry
(DPV) or square wave voltammetry (SWV) are currently used.
Impedance methods combining polymer and carbon nanotubes
have also been widely used in reagentless formats (Xu et al., 2004,
2006; Cai et al., 2003). In this paper, we describe a label-free and
reagentless miRNA sensor based on an interpenetrated network of
carbon nanotubes and electroactive polymer. The nanostructured
polymer film presents very well-defined electroactivity in neutral
aqueous medium from the quinone group embedded in the
polymer backbone. When the miRNA-141 target is added (miR-
141, a prostate biomarker) a “signal-on” response, i.e. a current
increase, is observed while no current change occurs with non-
complementary miRNAs such as miR-103 (a colorectal cancer
biomarker; Chen et al., 2012) or miR-29b-1 (a lung cancer
biomarker; Fabbri et al., 2007). The biosensor presents a very
low detection limit of ca. 8 fM.
2. Experimental
2.1. Chemicals
Phosphate buffer saline (PBS, 0.137 M NaCl; 0.0027 M KCl;
0.0081 M Na
2
HPO
4
; 0.00147 M KH
2
PO
4
, pH 7.4) was provided by
Sigma. Aqueous solutions were made with ultrapure (18 MΩ cm)
water. Glassy carbon (GC) working electrodes (3 mm diameter,
S¼0.07 cm
2
) were purchased from BASInc. 3-(5-Hydroxy-1,
4-dioxo-1,4-dihydronaphthalen-2(3)-yl) propanoic acid (JUGA)
was synthesized from 5-hydroxy-1,4-naphthoquinone (JUG) and
succinic acid (Piro et al., 2011). All oligonucleotides were provided
by Eurogentec (Belgium). All sequences are detailed in Table 1.
DNA strands were used as capture probes for the corresponding
miRNAs. Human sera were provided by Paul Brousse Hospital (H.T.
Duc). Multi-walled carbon nanotubes (MWCNTs, purity 90%;
diameter of 110–170 nm and length of 5–9 mm), lithium perchlo-
rate (purity≥95%) and 5-hydroxy-1,4-naphthoquinone (JUG, purity
97%) were purchased from Sigma Aldrich. 1-(3-Dimethylamino-
propyl)-3-ethylcarbodiimide hydrochloride (EDC, purity 98%) and
N-hydroxysuccinimide (NHS, purity 98%) were from Alfa Aesar
(Ward Hill, MA). Alumina slurry is from ESCIL, Chassieu, France. All
other reagents used (H
2
SO
4
, HNO
3
) and solvents, acetonitrile
(ACN), ethanol (EtOH), were PA grade.
2.2. CNTs preparation
MWCNTs were purified and oxidized in a 1:1 mixture of HNO
3
and H
2
SO
4
at 90 1C for 1 h, then washed with distilled water until
pH 7 and separated by centrifugation. The solid residue was then
dried at 80 1C for 12 h before use. These oxidized MWCNTs are
referred as o-MWCNTs in the following.
2.3. Electrochemical procedures
The three-electrodes cell consists of a GC working electrode
(3 mm in diameter), a platinum (Pt) grid counter electrode and a
commercial calomel electrode (SCE, supplied from Radiometer
Analytical). Cyclic voltammetry was used for polymer electro-
synthesis, using an Autolab PGSTAT30. Electrochemical Impedance
Spectroscopy (EIS) was used for characterization of the modified
electrodes. Impedance spectra were recorded using the FRA
module associated with the PGSTAT30 for frequencies between
100 kHz and 100 mHz and a perturbation amplitude of 10 mV.
Solutions were systematically deaerated with argon before and
during experiments. Field Emission Scanning Electron Microscopy
(FESEM) photographs were taken on a Hitachi S4800 system.
2.4. Electrode preparation
GC electrodes were polished by 1 μm alumina slurry on
polishing cloth then washed with water, ethanol and ACN in
ultrasonic bath for 2 min. 1 mg o-MWCNTs was dispersed in
1mL H
2
O then 5 mL of this solution was dropped onto a freshly
polished GC electrode and let to dry. This procedure gives CNT-
modified electrodes (noted o-MWCNT/GCE) for which the CNT
density is controlled by the quantity initially contained in the
droplet. GC or o-MWCNT/GCE electrodes were modified by co-
electrooxidation of the two monomers JUG and JUGA in ACN
solution containing 5 Â 10
−2
M JUG, 3.75 Â 10
−3
M JUGA, 0.1 M
LiClO
4
and 10
−3
M 1-naphthol (the JUGA:JUG ratio is 0.075). This
procedure leads to poly(JUG-co-JUGA)-modified electrodes or poly
(JUG-co-JUGA)/o-MWCNT-modified electrodes.
Table 1
ODN probes and miRNA target sequences.
ODN name Function (type) Bases T
m
(1C) Sequences
ODN-141-P Probe (DNA) 22 46.0 5′ NH
2
–CCATCTTTACCAGACAGTGTTA 3′
miR-141 Target (RNA) 22 46 3′ GGUAGAAAUGGUCUGUCACAAU 5′
miR-29b-1 Target (RNA) 23 44.8 3′ UUGUGACUAAAGUUUACCACGAU 5′
miR-103 Target (RNA) 23 50.2 3′AGUAUC GGGACAUGUUACGACGA 5′
H.V. Tran et al. / Biosensors and Bioelectronics 49 (2013) 164–169 165
2.5. Grafting ODN capture probes
Poly(JUG-co-JUGA)-modified electrodes or poly(JUG-co-JUGA)/
o-MWCNT-modified electrodes were immersed into 500 μLofa
solution containing 150 mM EDC+300 mM NHS at 37 1C for 2 h to
activate the carboxyl group. Then, electrodes were washed with
distilled water and immersed into 500 μL of an aqueous solution
containing 0.1 μM ODN probe for 2 h at 37 1C. Electrodes were
then washed with MilliQ water and PBS at room temperature and
immersed into PBS at 37 1C under stirring for 2 h to remove
physisorbed ODN. After that, the electroactivity of poly(JUG-co-
JUGA)/ODN- or poly(JUG-co-JUGA)/o-MWCNT/ODN-modified elec-
trodes was investigated by SWV curves.
2.6. Hybridization assays
Hybridization solutions containing various concentrations of
miRNA target (from 10
−15
Mto10
−8
M) were prepared and heated
for 5 min above the melting temperature of the corresponding
duplex to avoid cross hybridization (Gortner et al., 1996; Válóczi
et al., 2004). Probe-modified electrodes were then dipped into this
solution at 45 1C for 1 h. After hybridization, electrodes were
washed with 1 Â SSC (saline sodium citrate) buffer for 1 min at
45 1C then dipped into 1 Â PBS at 37 1C for 30 min in order to wash
out physisorbed targets. SWVs were then recorded in 1 Â PBS, at
25 1C, several times consecutively until the signal is perfectly
stable. The main peak (situated between −0.5 and −0.4 V vs. SCE)
was used to calculate the relative current change (%ΔI/I) before and
after hybridization, using the following equation:
%
ΔI
I
¼
I
Hyb
−I
P robe
I
P robe
 100
where I
Probe
and I
Hyb
are currents corresponding to the main SWV
peak before and after hybridization, respectively.
The sample standard deviation was calculated as follows:
S ¼
ffiffiffiffiffiffiffiffiffiffiffiffiffiffiffiffiffiffiffiffiffiffiffiffiffiffiffiffiffiffiffiffiffiffiffiffiffiffiffiffiffiffiffiffiffiffiffiffiffiffiffiffiffiffiffiffiffiffiffi
1
ðN−1Þ
∑
N
i ¼ 1
ΔI
I
i
−
ΔI
I
"#
2
v
u
u
t
ð1Þ
with ðΔI=IÞ
i
corresponding to the observed value of the relative
current change for each measurement i and ðΔI=I Þ the mean value
for N measurements.
The relative limit of detection ðΔI=IÞ
LOD
was derived from the
relative current change obtained with blank samples
ΔI
I
LOD
¼
ΔI
I
Blank
þ 3S
Blank
ð2Þ
with
ðΔI=IÞ
Blank
corresponding to the mean value of the relative
current change observed for blank samples and S
Blank
the sample
standard deviation for blank samples.
To obtain a calibration curve, at least three independent measure-
ments were performed for each concentration. The limit of detection
(LOD) w as obtained from five independent blank samples.
3. Results and discussion
3.1. Electrode modifications and characterizations
The first step c onsists of the ph y sisorp tion of a well-defined
quan tity of o-MW CNTs on the GC electrode surface. The procedure is
detailed in Section 2. Several surface densities of o-MWCNT were
inve stigat ed: 0, 7, 14.3
,
28.6, 36.7 and 142 μgcm
−2
(see Fig. SI5). After
that, poly(JUG-co-JUGA) was deposited by potential scans (20 scans)
from0.4to1.1V(vs.SCE)atascanrateof0.05Vs
−1
.Theredoxpeaks
situated at +0.9 1/+0.85 V vs. SCE develop continuously under
scanning, which indicates formation of conducting poly(JUG-co-
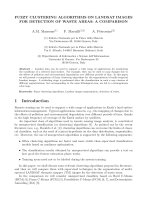
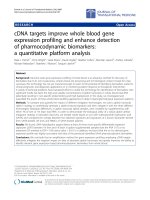
JUGA) film on the electr ode surface. Fig. 1 shows CVs for a bare GC
electrode (a) and for a o-MWCNT -modified electr ode using
14.3 μgcm
−2
(b). As expected, the currents measured on the o-
MWCNT-modified electrode are higher than that on the bare GC one.
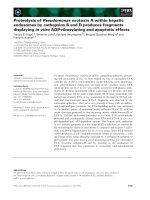
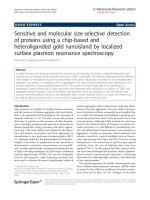
Fig. 2 shows FESEM pictures of (a) bare GC; (b) o-MWCNT/GC at
low magnification; (c) o-MWCNT/GC at high magnification and
(d) poly(JUG-co-JUGA)/o-MWCNT/GC. As shown, o-MWCNT-
modified electrodes present much higher specific area than bare
GC and, as expected, poly(JUG-co-JUGA) is deposited preferentially
on the o-MWCNTs.
3.2. Electroactivity of the poly(JUG-co-JUGA)/o-MWCNT-modified
electrodes
CVs of different polymer/o-MWCNT-modified electrodes are
presented in Supplementary information, Fig. SI1A. The higher the
o-MWCNT density, the higher the current intensity, with a quasi-
reversible signal observed in the cathodic potential domain
between −1 and 0.1 V vs. SCE, attributed to quinone electroactivity.
0.4 0.6 0.8 1.0 1.2
0
20
40
60
80
100
I/ μA
0.4 0.6 0.8 1.0 1.2
-20
0
20
40
60
80
100
120
I/ μ
A
E/ V vs. SCE
E / V vs. SCE
Fig. 1. Cyclic voltammograms during film growth. Medium: 5.10
−2
M JUG+5.10
−3
M
JUGA+10
−3
M naphthol in ACN, a—on bare GC electrode; b—on o-MWCNT/GC
using 14.3 μgcm
−2
o-MWCNT.
H.V. Tran et al. / Biosensors and Bioelectronics 49 (2013) 164–169166
Two typical redox couples for quinone in PBS can be identified: a
main couple is situated at −0.50/−0.65 V and a secondary one at
−0.8/−0.85 V. Electrochemical impedance spectroscopy has been
performed as well; results are given in Fig. SI1B.
Square wave voltammograms (SWVs), which evidence the
faradic peaks more clearly than CVs, are given in Fig. SI2. The o-
MWCNT-modified electrode shows one small peak at −0.2 V vs.
SCE, whereas the poly(JUG-co-JUGA)-modified electrode shows
two well-defined peaks at −0.56 V vs. SCE (peak ♯1) and −082 V vs.
SCE (peak ♯2) which correspond to the two quinone redox couples
observed on the CVs. For the poly(JUG-co-JUGA)/o-MWCNT-mod-
ified electrode, peak ♯2 remains weak whereas peak ♯1 becomes
predominant, along with a new shoulder ( ♯3) at −0.32 V. Peak ♯3
increases with the o-MWCNT density (data not shown).
3.3. Detection of miRNA
ODN probes (ODN-141-P) were immobilized on poly(JUG-co-
JUGA)/o-MWCNT -modified electrodes as described in Section 2.The
surface concentration Γ
ODN
of ODN probe has been estimated around
10 75pmolcm
−2
via fluor escence experiments after h ybridization
with fluorescent compl ementary target. Details are gi ven in Supple-
mentary information. The maximum density Γ
max
can be deriv ed
from the gyration radius R
G
(R
G
¼1.8 nm
2
for a single-stranded ODN
of 22 bases) (Pir o et al., 2007)whichgivesΓ
max
¼17 pmol cm
−2
.If
ODN probe strands are closely packed on the electrode surface, this
leads t o a significant steric hindrance which decreases t he appar ent
diffusion coefficient of counter-ions, therefore decreases the current
intensity of SWV. Conversely, hybridi zation leads to conformational
reorganization of the double strands which creates free space on the
electrode surface and induces a significant current increa se (Reisberg
et al., 2006; Piro et al., 2007).
miRNAofaboutthesamelengththantheprobeswereusedas
targets (conditions are detailed in Section 2 and sequences are given
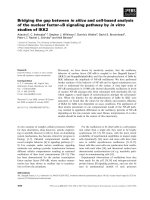
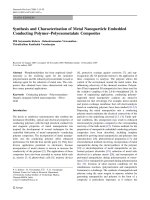
in Table 1). Fig. 3 ashowsSWVsafterhybridization with increasing
concentrations of complementary m iR -141 (1 0 fM, 1 pM, 100 pM).
More curves are given in Fig. SI6. A complete calibration curve is
given in Fig. 3b, wher e the r elati v e current increase upon h ybridiza-
tion (%ΔI/I) is plotted vs. the target concentration, in the range 10
−15
–
10
−8
M. Saturation occurs beyond a concentration of 1 0
−10
M; the
limit of detection (LOD) is estimated around 8 fM (see Section 2). The
linear part of the calibrati on curve corre sponds to an ex tr emel y high
sensitivity of +7.5% per decade, which gives ΔI/I¼ 30% for 10 pM miR-
14 1. This is one of the lowest LOD reported for a reagentless and
label-free electr ochemical miRNA biosensor.
3.4. Selectivity of the sensor
To check the selectivity of the sensor, hybridization experiments
were performed with two other non-complementary miRNAs: miR-
103 and miR-29b-1 (see Table 1). Two concentrations were inves-
tigated, 1 pM and 10 pM (within the linear range determined from
Fig. 3). As shown in Fig. SI3, the complementary target miR-141
leads to a current increase which is approximately three times
higher than that for the two non-complementary targets miR-103
and miR-29b-1. These results indicate that the biosensor is suffi-
ciently selective to discriminate non-complementary miRNAs from
the complementary one.
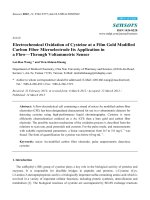
3.5. Detection of miRNA in diluted serum
The last set of experiments was conducted using human sera. A
human normal serum (which does not contain miRNA in detect-
able quantity) was diluted 50 times and used as a blank; it is
referred as 2% serum (−). From this solution samples were
prepared in which known quantities of miR-141 were added,
giving 2% serum (+) samples. A calibration curve is given in
Fig. 4. Corresponding SWVs are given in Fig. SI4.
SWV performed on a 2% serum (−) solution led to a negative
current change (decrease of the peak intensity) of about 10%,
Fig. 2. FESEM photographs on: (a) bare GC electrode; (b) o-MWCNT/GC at low magnification; (c) o-MWCNT/GC at high magnification (o-MWCNT density is 14.3 mgcm
−2
);
(d) poly(JUG-co-JUGA)/o-MWCNT/GC. Conditions: poly(JUG-co-JUGA) was deposited by 20 scans; CNT's density is 14.3 mgcm
−2
.
H.V. Tran et al. / Biosensors and Bioelectronics 49 (2013) 164–169 167
which can probably be attributed to unspecific physisorption of
serum proteins on the electrode surface (such solution contains
around 1.5 mg mL
−1
of various proteins). The current change is still
negative for 10 fM (but yet significantly different from negative
serum), which probably means that unspecific physisorption of
proteins is predominant over the specific miRNA hybridization. For
higher concentrations, the current change becomes positive, the
LOD being significantly higher and the sensitivity lower than for
experiments conducted in PBS instead of diluted serum.
4. Conclusion
A nanostructured poly(JUG-co-JUGA)/o-MWCNT composite was
designed onto which oligonucleotide probes were grafted. The
system was applied for direct electrochemical detection of miR-
141, a miRNA biomarker. It is shown that the copolymer electro-
activity is enhanced by the presence of o-MWCNTs, which prob-
ably participate to the low detection limit and high sensitivity. The
sensor can work in complex samples such as diluted human
serum. It is noteworthy to point out the interest to use signal-on
transduction, which makes the sensor much less sensitive to
unspecific adsorption of proteins or nucleic acids than in case of
signal-off transduction.
Work is now in progress to extent this detection system to use
as probes peptide nucleic acids (PNA) or locked nucleic acids
(LNA). These probes, having a higher affinity for RNA than DNA, are
expected to attain even lower LOD and higher sensitivity.
Acknowledgments
H.V. Tran thanks the University of Sciences and Technology of
Hanoi (USTH) for a Ph.D. grant. The authors thank University Paris
Diderot for financial support through an interdisciplinary grant
between Chemistry and Odontology Departments.
Appendix A. Supporting information
Supplementary data associated with this article can be found in
the online version at />References
Acevedo, D.F., Reisberg, S., Piro, B., Peralta, D.O., Miras, M.C., Pham, M.C., Barbero, C.A.,
2008. Electrochimica Acta 53, 4001–4006.
Brase, J.C., Wuttig, D., Kuner, R., Sültmann, H., 2010. Molecular Cancer 9, 306–313.
Cai, H., Xu, Y., He, P.G., Fang, Y.Z., 2003. Electroanalysis 15, 1864–1870.
Catuogno, S., Esposito, C.L., Quintavalle, C., Cerchia, L., Condorelli, G., De Franciscis,
V., 2011. Cancers 3, 1877–1898.
Chen, H.Y., Lin, Y.M., Chung, H.C., Lang, Y.D., Lin, C.J., Huang, J., Wang, W.C., Lin, F.M.,
Chen, Z., Huang, H.D., Shyy, J.Y., Liang, J.T., Chen, R.H., 2012. Cancer Research 72,
3631–3641.
Chen, X., Ba, Y., Ma, L., Cai, X., Yin, Y., Wang, K., Guo, J., Zhang, Y., Chen, J., Guo, X., Li,
Q., Li, X., Wang, W., Zhang, Y., Wang, J., Jiang, X., Xiang, Y., Xu, C., Zheng, P.,
Zhang, J., Li, R., Zhang, H., Shang, X., Gong, T., Ning, G., Wang, J., Zen, K., Zhang, J.,
Zhang, C.Y., 2008. Cell Research 18, 997–1006.
Cosnier, S., 1999. Biosensors and Bioelectronics 14, 443–456.
Cosnier, S., 2003. Analytical and Bioanalytical Chemistry 377, 507–520.
Cosnier, S., Holzinger, M., 2011. Chemical Society Reviews 40, 2146–21 56.
Fabbri, M., Garzon, R., Cimmino, A., Liu, Z., Zanesi, N, Callegari, E., Liu, S., Alder, H.,
Costinean, S., Fernandez-Cymering, C., Volinia, S., Guler, G., Morrison, C.D.,
Chan, K.K., Marcucci, G., Calin, G.A., Huebner, K., Croce, C.M., 2007. Proceedings
of National Academy of Sciences 104, 15805–15810.
Gao, Z., Peng, Y., 2011. Biosensors and Bioelectronics 26, 3768–3773.
Gerard, M., Chaubey, A., Malhotra, B.D., 2002. Biosensors and Bioelectronics 17,
345–359.
-1.0 -0.8 -0.6 -0.4 -0.2 0.0
30
40
50
60
I/μA
E/ V vs. SCE
After ODN grafting
1 fM
10 fM
1 pM
100 pM
1E-14
Concentration / mol L
1E-12 1E-10 1E-8
0
10
20
30
40
50
Δ
I/I (%)
-1
Fig. 3. a—SWVs recorded before adding miRNA-141 (lower green curve) then after
hybridization (upper red curves) with increasing concentrations of complementary
miRNA-141: 1 fM, 10 fM, 1 pM and 100 pM. b—Calibration curve giving relative
current increase (%ΔI/I) upon hybridization with concentrations of miRNA-141 in
the range 10
−15
–10
−8
M. (For interpretation of the references to color in this figure
legend, the reader is referred to the web version of this article.)
1E-3 0.01 0.1 1 10 100 1000
-10
0
10
20
30
ΔI/I (%)
Concentration of miR-141 in diluted serum / pM
Fig. 4. Calibration curve obtained from SWVs in 2% serum (−) and 2% serum (+), for
10 fM, 1 pM, 20 pM and 800 pM miR-141. Error bars were obtained by three
independent experiments.
H.V. Tran et al. / Biosensors and Bioelectronics 49 (2013) 164–169168
Gortner, G., Pfenninger, M., Kahl, G., Weising, K., 1996. Electrophoresis 17,
1183–118 9.
Hunt, A., Goulding, A .M., Deo, S.K., 2009. Analytical Biochemistry 387, 1–12.
Iorio, M.V., Croce, C.M., 2009. Journal of Clinical Oncology 27, 5848–5856.
Kilic, T., Topkaya, S.N., Ariksoysal, D.O., Ozsoz, M., Ballar, P., Erac, Y., Gozen, O., 2012.
Biosensors and Bioelectronics 38, 195–201.
Kulesza, P.J., Skunik, M., Baranowska, B., Miecznikowski, K., Chojak, M., Karnicka, K.,
Frackowiak, E., B´eguin, F., Kuhn, A., Delville, M.H., Starobrzynska, B., Ernst, A.,
2006. Electrochimica Acta 51, 2373–2379.
Lawrie, C.H., Gal, S., Dunlop, H.M., Pushkaran, B., Liggins, A.P., Pulford, K., Banham,
A.H., Pezzella, F., Boultwood, J., Wainscoat, J.S., Hatton, C.S.R., Harris, A.L., 2008.
British Journal of Haematology 141, 672–675.
Lee, R.C., Feinbaum, R.L., Ambros, V., 1993. Cell 75, 843–854.
Liu, X., He, S., Skogerbø, G., Gong, F., Chen, R., 2012. PLoS ONE 7, e32797.
Lusi, E.A., Passamano, M., Guarascio, P., Scarpa, A., Schiavo, L., 2009. Analytical
Chemistry 81, 2819–2822.
Mitchell, P.S., Parkin, R.K., Kroh, E.M., Fritz, B.R., Wyman, S.K., Pogosova-Agadjanyan,
E.L., Peterson, A., Noteboom, J., O'Briant, K.C., Allen, A., Lin, D.W., Urban, N.,
Drescher, C.W., Knudsen, B.S., Stirewalt, D.L., Gentleman, R., Vessella, R.L.,
Nelson, P.S., Martin, D.B., Tewari, M., 2008. Proceedings of National Academy
of Sciences 105, 10513–10518.
Okuno, J., Maehashi, K., Kerman, K., Takamura, Y., Matsumoto, K., Tamiya, E., 2007.
Biosens. Bioelectron. 22, 2377–2381.
Paleček, E., Bartošík, M., 2012. Chemical Reviews 112, 3427–3481.
Peigney, A., Laurent, C., Flahaut, E., Bacsa, R.R., Rousset, A., 2001. Carbon 39,
507–514.
Peng, C., Jin, J., Chen, G.Z., 2007. Electrochimica Acta 53, 525–537.
Piro, B., Kapella, A., Hai, L.V., Anquetin, G., Zhang, Q.D., Reisberg, S., Noel, V., Tran, L.
D., Duc, H.T., Pham, M.C., 2011. Electrochimica Acta 55, 6136–6146.
Piro, B., Reisberg, S., Noel, V., Pham, M.C., 2007. Biosensors and Bioelectronics 22,
3126–3131.
Planell-Saguer, M., Rodicio, M.C., 2011. Analytica Chimica Acta 699, 134–152.
Qavi, A.J., Kindt, J.T., Bailey, R.C., 2010. Analytical and Bioanalytical Chemistry 398,
2535–2549.
Qi, H., Li, X., Chen, P., Zhang, C., 2007. Talanta 72, 1030–1035.
Reisberg, S., Piro, B., Noel, V., Pham, M.C., 2006. Bioelectrochemistry 69, 172–179.
Shen, W., Deng, H., Ren, Y., Gao, Z., 2013. Biosensors and Bioelectronics, 171–176.
Válóczi, A., Hornyik, C., Varga, N., Burgyán, J., Kauppinen, S., Havelda, Z., 2004.
Nucleic Acids Research 32, e175.
Wang, J., 2005. Electroanalysis 17, 7–14.
Wang, J., Yi, X., Tang, H., Han, H., Wu, M., Zhou, F., 2012. Analytical Chemistry 84,
6400–6406.
Wightman, B., Ha, I., Ruvkun, G., 1993. Cell 75, 855–862.
Wohlstadter, J.N., Wilbur, J.L., Sigal, G.B., Biebuyck, H.A., Billadeau, M.A., Dong, L.,
Fischer, A.B., Gudibande, S.R., Jameison, S.H., Kenten, J.H., Leginus, J., Leland, J.K.,
Massey, R.J., Wohlstadter, S.J., 2003. Advanced Materials 15, 1184–1187.
Xu, Y., Jiang, Y., Cai, H., He, P.G., Fang, Y.Z., 2004. Analytica Chimica Acta 516, 19–27.
Xu, Y., Ye, X.Y., Yang, L., He, P.A., Fang, Y.Z., 2006. Electroanalysis 18, 1471–1478.
Yin, H., Zhou, Y., Zhang, H., Meng, X., Ai, S., 2012. Biosensors and Bioelectronics 33,
247–253.
Zhang, G.J., Chua, J.H., Chee, R.E., Agarwal, A., Wong, S.M., 2009. Biosensors and
Bioelectronics 24, 2504–2508.
Zhang, Q.D., Piro, B., Noel, V., Reisberg, S., Pham, M.C., 2011. Analyst 136, 1023–1028.
H.V. Tran et al. / Biosensors and Bioelectronics 49 (2013) 164–169 169