Magnetic chitosan nanoparticles for removal of Cr(VI) from aqueous solution
Bạn đang xem bản rút gọn của tài liệu. Xem và tải ngay bản đầy đủ của tài liệu tại đây (728.13 KB, 5 trang )
Magnetic chitosan nanoparticles for removal of Cr(VI) from aqueous solution
Nguyen Ngoc Thinh
a
, Pham Thi Bich Hanh
b
, Le Thi Thanh Ha
a
, Le Ngoc Anh
c
, Tran Vinh Hoang
a
,
Vu Dinh Hoang
a
, Le Hai Dang
d
, Nguyen Van Khoi
b
, Tran Dai Lam
e,
⁎
a
School of Chemical Engineering, Hanoi University of Science and Technology, 1, Dai Co Viet Road, Hanoi, Viet Nam
b
Institute of Chemistry, Vietnam Academy of Science and Technology, 18, Hoang Quoc Viet Road, Hanoi, Viet Nam
c
Institute of Marine Geology and Geophysics, Vietnam Academy of Science and Technology, 18, Hoang Quoc Viet Road, Hanoi, Viet Nam
d
Hanoi National University of Education,136 Xuan Thuy, Hanoi, Viet Nam
e
Institute of Materials Science, Vietnam Academy of Science and Technology, 18, Hoang Quoc Viet Road, Hanoi, Viet Nam
abstractarticle info
Article history:
Received 28 April 2012
Received in revised form 29 August 2012
Accepted 3 December 2012
Available online 9 December 2012
Keywords:
Fe
3
O
4
Magnetic chitosan nanoparticles
Adsorption isotherm
Cr(VI)
A simple method was introduced to prepare magnetic chitosan nanoparticles by co-precipitation via epichlo-
rohydrin cross-linking reaction. The average size of magnetic chitosan nanoparticles is estimated at ca.
30 nm. It was found that the adsorption of Cr(VI) was highly pH-dependent and its kinetics follows the
pseudo-second-order model. Maximum adsorption capacity (at pH 3, room temperature) was calculated as
55.80 mg·g
−1
, according to Langmuir isotherm model. The nanoparticles were thoroughly characterized be-
fore and after Cr(VI) adsorption. From this result, it can be suggested that magnetic chitosan nanoparticles
could serve as a promising adsorbent for Cr(VI) in wastewater treatment technology.
© 2012 Elsevier B.V. All rights reserved.
1. Introduction
Contamination of water by toxic heavy metals through the dis-
charge of industrial wastewater is a worldwide environmental prob-
lem. Rapid industrialization has seriously contributed to the release
of toxic heavy metals to water streams. Among the various heavy
metals, chromium (Cr) is one of the most toxic pollutants generated
by the electroplating, leather tanning, metal finishing, steel fabrica-
tion, textile industries and chromate preparation. The most common
oxidation states of Cr in nature are Cr(III) and Cr(VI). Chromium(VI)
is more hazardous than Cr(III) as it can diffuse as CrO
4
2−
or HCrO
4
−
through cell membranes and o xidize biological molecules [1].Awide
range of physical and chemical processes are available for the removal
of chromium from wastewater such as filtratio n [2], electrochemical pre-
cipitation [3], adsorption [4,5],electrodeposition[6] and membrane sys-
tems or ion exchange process [7–9]. Among these methods, adsorption is
one of the most econo mically favorable while being t echnically easy
[10–12] . Chitosan has excellent propert ies for the adsorption of heavy
metal ions, principally due to the presence of amino groups (–NH
2
)in
the polymer matrix, which interact with metal ions in solution by ion ex-
change and complexation reactions [13–15 ]. Most of the chitosan-based
adsorbents are sub micron to micron-sized and need large internal poros-
ities to ensure adequate surface area for adsorption. However, the
diffusion limitation within the particles leads to the decrease in the
adsorption rate and a vailable capacity. C ompared to t he traditional
micron-sized supports used in separation process, nano-sized adsorben ts
display better performance due to high specific surface area and the ab-
sence of internal diffusion resistance. The nano-adsorbents cannot be sep-
arated easily from aqueous solution by filtration or centrifugation [16].
The application of magnetic adsorbent technology to solve environmental
problems has received considerable attention in recent years [16–18].
In this paper, magnetic chitosan nanoparticles were prepared, char-
acterized and applied for the removal of Cr(VI) in the water solution. Af-
terwards, thermodynamic and kinetic aspects of the adsorption process
were considered. The improved magnetic and high adsorption uptake
properties are two main features of the synthesized nanoparticles that
can be advantageously used in water treatment.
2. Experimental
2.1. Chemicals
FeCl
3
·6H
2
O, FeSO
4
·7H
2
O, K
2
Cr
2
O
7
,CH
3
COOH, NaOH and NH
3
were
of analytical grade. Chitosan (MW=400,000, DA=70%) was purchased
from Nha Trang Aquatic Institute (Vietnam) and re-characterized by
viscometry and IR measureme nts at our laboratory [18]. Double distilled
water was used in the preparation of all solutions.
2.2. Preparation of magnetic chitosan nanoparticles
Magnetic chitosa n nanoparticles were prepared by co-precipitation
method [18–20], with several modifications. Experiments were carried
Materials Science and Engineering C 33 (2013) 1214–1218
⁎ Corresponding author. Tel.: +84 4 37564129; fax: +84 438360705.
E-mail address: (T.D. Lam).
0928-4931/$ – see front matter © 2012 Elsevier B.V. All rights reserved.
/>Contents lists available at SciVerse ScienceDirect
Materials Science and Engineering C
journal homepage: www.elsevier.com/locate/msec
out in inert gas (N
2
). Fe
3
O
4
nanoparticles were synthesized by
co-precipitation of ferric and ferrous salts. The am ount 6.4795 g of
FeCl
3
·6H
2
O and 3.3339 g of FeSO
4
·7H
2
O were dissolved into 150 mL
of deoxygenated distilled water. After stirring for 30 min, chemical pre-
cipitation was achieved at 30 °C under vigorous stirring by adding
20 mL of NH
3
·H
2
O solution (28%, v/v). During the reaction process, pH
was maintained at about 10. The reaction system was kept at 70 °C for
1h.1gchitosanflake was dissolved in a 150 mL CH
3
COOH solution
2% (w/v). The chitosan solution was then dropped into the obtained
magnetic fluid in t he flask through a dropper. Afterwards, 2 mL of
pure e pichlorohydrin was added into reaction flask and stirred at
85 °C for 3 h, before the flask was cooled down to room temperature.
The precipitate was washed with distilled water to remove all existing
in the e ffluents. Silver nitrate (AgNO
3
) was used to detect residue of
Cl
−
. The precipitate was then washed with ethanol and dried at 50 °C,
in the vacuum oven.
2.3. Adsorption experiments
The sorption experiments were performed by batch method. Sam-
ples of 0.1 g of magnetic chitosan nanoparticles were equilibrated with
50 mL of solution containing various amount of Cr(VI). The pH value
of solutions was adjusted by using diluted solution of NaOH and HCl.
The temperature of the solutions (25 °C, 35 °C, 45 °C) was controlled
with the thermostatic bath. The adsorbed amount of Cr(VI) per unit
weight of magn etic ch itosan n anoparticle s, q
t
(mg·g
−1
), was calculated
from the mass balance equation as:
q
t
¼
C
0
−C
t
ðÞ⋅V
m
ð1Þ
where C
0
and C
t
(mg/L) are the initial Cr(VI) concentration and the Cr(VI)
concentrations at any time t,respectively;V (L)isthevolumeofthe
Cr(VI) solution; and m (g)isthemassofthemagneticchitosan
nanoparticles. Samples o f t he Cr(VI) solution were collected at pre-
determined time intervals and analyzed using a UV–Vis Spectrophotom-
eter (model UV-PC1600, Shimadzu), at λ
max
=540 nm, according to the
1,5-diphenyl-carbazide method [21]. All measuremen ts were conducted
triplicate.
2.4. Characterization methods
X-ray diffraction (XRD) patterns were obtained at room tempera-
ture by D8 Advance, Bruker ASX, using CuKα radiation (λ=1.5406 Å)
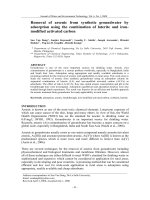
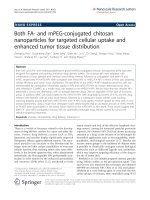
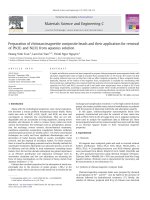
Fig. 1. Camera pictures (a, b); FE-SEM images (c, d) and TEM images (e, f) of magnetic chitosan nanoparticles.
1215N.N. Thinh et al. / Materials Science and Engineering C 33 (2013) 1214–1218
in the range of 2θ=10°–60°, and a scanning rate of 0.02°·s
−1
. Mor-
phology of magnetic chitosan nanoparticles was analyzed by Field
Emission Hitachi S-4500 Scanning Electron Microscope (FE-SEM) and
Transmission Electron Microscope (TEM, JEOL, Voltage: 80 kV). Absor-
bance measurements were carried out using Shimadzu UV-PC1600
spectrophotometer in the range of 400–800 nm.
The magnetic properties were measured with home-made vibrat-
ing sample magnetometer (VSM) and evaluated in terms of satura-
tion magnetization and coercivity. Chemical composition of samples
was determined by JEOL Scanning Electron Microscope and Energy
Dispersive Spectroscopy (SEM/EDS) JSM-5410 Spectrometer.
3. Results and discussion
3.1. Characterization of magnetic chitosan nanoparticles
TEM and SEM micrograph of magnetic chitosan particles provides in-
formation on their size and morphology. It can be observed from Fig. 1
that the magnetic particles have a spherical shape with a diameter of
about 30 nm.
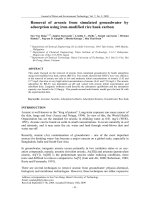
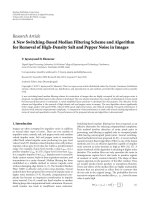
XRD pattern of magnetic chitosan nanoparticles shows six charac-
teristic peaks for Fe
3
O
4
corresponding to (220), (311), (400), (422),
(511) and (440) (JCPDS file, PDF No. 65-3107) (Fig. 2). Quite w eak dif-
fraction lines of composite indicated that Fe
3
O
4
particles have been coat-
ed by amorphous chitosan, which did not affect the phase and structure
of Fe
3
O
4
. Particle size of magnetic chitosan nanoparticles can be estimat-
ed approximately as 30 nm, via line broadening in the pattern, using
Debye–Scherrer equation (d=kλ/βcos θ).
Typical magnetization loops were recorded by VSM and shown on
Fig. S1 (supporting information). From the plot of magnetization vs.
magnetic field and its enlargement near the origin, the saturation
magnetization, remanence magnetization, coercivity and squareness
could be calculated. Because of no remanence and coercivity, it can be
suggested that the beads are superparamagnetic. It can also be observed
from this figure that magnetization moment of Fe
3
O
4
nanoparticles
decreases very little after chitosan surface coating, meaning that chito-
san does not affect magnetic properties of these magnetic chitosan
nanoparticles. Therefore, maintaining such a hi gh saturation magne tiza-
tion value (M
s
)aftercoatingthesenanoparticlesisadvantageousand
susceptible to the external magnetic field for magnetic separation.
3.2. Effect of initial pH on the adsorption process
It is well known that some metals are preferentially adsorbed in acid-
ic media while chitosan can dissolve under this acidic condition. In this
regard, the chemical modification of chitosan by using crosslinkingreac-
tion offers an important pathway for producing chemically more stable
chitosan derivatives, extending the potential applications of this bio-
polymer. In our study, the crosslinking approach with epichlorohydrin
to block/crosslink via hydroxyl (OH) group is expected to improve
chemical stability, mechanical resistance and adsorption/desorption
properties, c ompared to that with g lutaraldehyde (to blo ck amino
(NH
2
) group respectively), when keeping reactive amino groups intact
for complexing reaction with heavy metal ions [14,16,19].
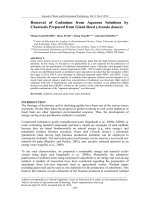
Next, selecting an optimum pH is very important for the adsorp-
tion process, since pH affects not only the surface charge of adsorbent,
but also the degree of ionization and the speciation of the adsorbate
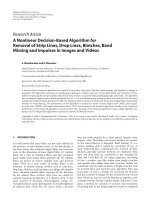
during the reaction. The effect of pH on the adsorption process was
investigated over the range from 2 to 6. As indicated in Fig. 3, the
maximum capacity of Cr(VI) absorption occurred at pH of 3. The ex-
planation would be addressed as the pH of the aqueous solution af-
fects to stability of chromium speciation and the surface charge of
the adsorbent. At pH 1, the chromium ions exists in the form of
H
2
CrO
4
, while in the pH range of 1–6, different forms of chromium
such asCr
2
O
7
2−
,HCrO
4
−
,andCr
3
O
10
2−
coexist while HCrO
4
−
predominates.
As the pH increases, those form shifts to Cr
2
O
4
2−
and Cr
2
O
7
2−
[11].Cr(VI)
exists predominantly a s HCrO
4
−
in aqueous solution below pH 4 and the
amino groups (–NH
2
) of magnetic chitosan nanoparticles would be in
protonated cationic form (–NH
3
+
) to a higher extent in acidic solution.
This results in the stronger attraction for negatively charged ions.
Electrostatic interaction between the sorbent and HCrO
4
−
ions also con-
tributes to the high chromium removal. However, at the pH lower than
3, decrease in uptake capacity is observed as the predomination of
H
2
CrO
4
and the stro ng competition for adsorption sites betw een
H
2
CrO
4
and protons. The decreasing of the adsorption capacity at higher
pH values may be explained by the dual competition of CrO
4
2−
and OH
−
for adsorption [11]. Thus, pH 3 was selected as the optimum pH value for
the following adsorption experiment.
3.3. Adsorption isotherms
Equilibrium experimental data were successfully fitted to the
Langmuir isotherm whose equation can be expressed as
q ¼
q
m
⋅K
L
⋅C
e
1 þ K
L
⋅C
e
ð2Þ
where q
m
(mg·g
−1
) is the maximum sorption capacity (corresponding
to complete monolayer coverage), C
e
is the equilibrium concentration
in the solution (mg/L), q
e
is the equilibrium Cr(VI) concentration in
20 30 40 50 60 70
(440)
(511)
(422)
(400)
(311)
(220)
Intensity
2θ
Fig. 2. XRD pattern of magnetic chitosan nanoparticles.
23456
50
55
60
65
70
75
80
85
R(%)
pH
Fig. 3. The influence of initial pH value on the adsorption of the Cr(VI) on magnetic
chitosan nanoparticles.
1216 N.N. Thinh et al. / Materials Science and Engineering C 33 (2013) 1214–1218
the sorbent (mg·g
−1
), and K
L
is the sorption affinity constant related to
the binding energy of sorption (L·mg
−1
). The experimental data
(Table 1) fitted well with Langmuir model (R
2
>0.99), confirming that
the adsorption process is monolayer adsorption. The results of adsorp-
tion studies by Langmuir model, indicating improved Cr(VI) uptake
properties of magnetic chitosan nanoparticles (55.80 mg·g
−1
,pH3,
room temperature, compared to the other adsorben ts (Table 2)), proba-
bly relates to the smaller loss of amine groups of chitosan, involved in
the cross-linking reaction wh en using epic hlorohydrin as a cross-linker.
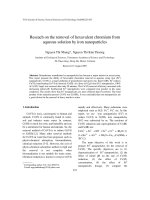
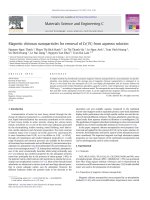
Cr(VI) removal by adsorbent as a function of contact time with
different initial concentrations (40, 80 and 180 mg·L
−1
) of Cr(VI) is
shown in Fig. 4, where the adsorption rate of metal uptake was
quite slow and the maximum uptake was observed within 100 min.
3.4. Thermodynamic and kinetic studies
In this section, thermodynamic and kinetic aspects of the adsorp-
tion process will be considered. The experimental data obtained at
different temperatures were used in calculating the thermodynamic
parameters such as Gibbs free energy (ΔG), enthalpy (ΔH) and entro-
py (ΔS) according to the following equations:
ΔG ¼ ΔH−T Â ΔS ð3Þ
lnK ¼ ln q
e
=C
e
ðÞ¼−ΔH=RT þ ΔS=R: ð4Þ
Where K is the equilibrium constant, obtained from Langmuir iso-
therms at different temperature and R is the universal gas constant.
ΔH and ΔS were obtained from the slope and intercept of the plot
log (q
e
/C
e
) vs. 1/T (Fig. 5), namely:
ΔH ¼ −0:6853 kJ⋅mol
−1
and ΔS ¼ −115:7366 J⋅mol
−1
⋅K
−1
:
Table 1
Adsorption equilibrium constants obtained from Langmuir isotherm in the adsorption
of Cr(VI) onto magnetic chitosan nanoparticles (volume: 50 mL; absorbent dose: 0.1 g;
initial concentrations: 60, 80 and 180 mg·L
−1
; pH value: 3.0; temperature: 298,308,
318 K).
Temperature (K) q
max
(mg·g
−1
) K
L
R
2
298 55.80 0.366 0.993
308 46.71 0.119 0.997
318 43.29 0.138 0.994
Table 2
Comparison of adsorption capacities of Cr(VI) with other adsorbents.
Adsorbents Adsorption capacity
(mg·g
−1
)
pH Ref.
Tires activated carbon 58.50 2.0 [23]
Rubberwood activated carbon 44.05 2.0 [3]
Coconut shell activated carbon 20.00 2.0 [24]
Hazelnut shell activated carbon 17.70 2.0 [25]
Beech sawdust 16.10 1.0 [26]
Sugarcane bagasse 13.40 2.0 [27]
Coconut shell charcoal 10.88 4.0 [28]
Coconut tree sawdust 3.60 3.0 [29]
Chitosan 22.09 3.0 [30]
Non-cross linked chitosan 78.00 5 [31]
Cross linked chitosan 50.00 5 [31]
Magnetic chitosan nanoparticles (this
study)
55.80 3
0 50 100 150 200 250 300 350
400
10
15
20
25
30
35
40
45
50
55
60
65
70
q(mg/g)
t(min)
40mg/L
80mg/L
180mg/L
Fig. 4. Effect of contact time on Cr(VI) adsorption (volume: 50 mL; absorbent dose: 0.1 g;
initial concentrations: 40, 80 and 180 mg·L
−1
; pH value: 3.0; temperature: 298 K).
3.20 3.22 3.24 3.26 3.28 3.30 3.32 3.34 3.36
0.1
0.2
0.3
0.4
0.5
0.6
0.7
0.8
y=-13.92069+4.38115x,R=0.99017
Ln(q
e
/C
e
)
1/T*10
-3
(1/K)
C=80 mg/L
Fig. 5. Thermodynamic plot of ln (q
e
/C
e
) vs. 1/T.
Table 3
Thermodynamic data of Cr(VI) adsorption process.
T (K) ΔG (kJ·mol
−1
) ΔH (kJ·mol
−1
) ΔS (J·mol
−1
·K
−1
)
298 −35.164 −0.6853 −115.7366
303 −35.742
307 −36.205
312 −36.784
-50 0 50 100 150 200 250 300 350
-7
-6
-5
-4
-3
-2
-1
0
1
2
3
4
t(min)
40mg/L
80mg/L
180mg/L
ln(q
e
-q
t
)
Fig. 6. Kinet ic pseudo-first order sorption kinetics of Cr(VI) (volume: 50 mL; abso rbent dose:
0.1 g; initial concentrations: 40, 80 and 180 mg·L
−1
;pHvalue:3.0;temperature:298K).
1217N.N. Thinh et al. / Materials Science and Engineering C 33 (2013) 1214–1218
The negative value of ΔGobtainedfromEq.(3) reflects a spontane-
ous (favorable) adsorption process of Cr(VI) (Table 3), while the nega-
tive value of ΔH indicates that the a dsorption reaction i s exoth ermic
and the adsorption of Cr(VI) is more effective at lower temperatures.
Kinetically, in order to understand the behavior of the adsorbent and
to examine the controlling mechanism of the adsorption process, the
pseudo-first-order an d the pseudo-second-order were applied to the ex-
perimental data (Figs. 6 and 7). The pseudo-first-order rate expression of
Lagergren is given as: ln(q
e
− q
t
)=ln(q
e
)− k
1
⋅ t where q
e
and q
t
are the
amountsofCr(VI)(mg·g
− 1
) adsorbed on the adsorbent at equilibrium
and at time t, respectively and k
1
is the rate constant of first-order adsorp-
tion (min
−1
). The slopes and intercepts of plots of ln(q
e
−q
t
)vs.t were
used to determine the first-o rder rate constant k
1
. The pseudo-
second-order kinetic model is expressed as:
t
q
t
¼
1
k
2
⋅q
e
2
þ
1
q
e
 t where k
2
(g·mg
− 1
·min
−1
) i s the rate constant of seco nd order a dsorption. The
slopes and intercepts of plots of t/qt vs. t were used to calculate the
second-order rate constant k
2
and q
e
[22]. A dsorption rate constants
were summarized in Ta ble 4. The values of regression coefficient for
pseudo-second-order model were close to 1 for all initial Cr(VI) concen-
trations. The calculated values q
e,cal
were very close to obtained q
e,exp
values. Hence, the adsorption of Cr(VI) on to magnetic chitosan na no-
particles could obey the pseudo-second-order kinetic model.
4. Conclusion
In this work, cross-linked with epichlorohydrin magnetic chitosan
nanoparticles were prepared and characterized. The Cr(VI) adsorption
behavior on the prepared ma gnetic c hitosan nanoparti cles has been
studied under various conditions of different solution pH values and ad-
sorption contact times. Optimal adsorption conditions of Cr(VI) were
found at pH 3, and contact time of 100 min, with maximum adsorption
capacity of 55.80 mg·g
− 1
. Th e Langmuir model was found to fit
well with the experimental data (correlation coefficient R
2
>0.99),
indicating the occurrence of monolayer adsorption proce ss. Ther-
modynamically, the adso rpti on of Cr(VI) is spontaneous (in term
of ΔG) and exotherm ic (in term of ΔH) process. Kinetically, the
ads orption of Cr(VI) onto magnetic chitosan nanopa rticles obeyed
the pseudo-second-order model. Compared to the other adsor-
bents, magnetic chitosan nanoparticles shows greatly improved
uptake properties of Cr(VI), probably due to high concentr ation of
remaining active sites on the surface of magnetic chitosan nano-
particles. The improved magnetic and ad sorption uptake properties
are two main features o f the synthesized nanopart icles that can be
advantageously used in water treatment.
Acknowledgments
Funding of this work was provided by Vietnam Ministry of Science
and Technology (grant 08/2011/HÐ-NÐT).
Appendix A. Supplementary data
Supplementary data to this article can be found online at http://
dx.doi.org/10.1016/j.msec.2012.12.013.
References
[1] P.G. Krishna, J.M. Gladis, U. Rambabu, T.P. Rao, G.R.K. Naidu, Talanta 63 (2004)
541–546.
[2] C. Das, P. Patel, S. De, S. DasGupta, Sep. Purif. Technol. 50 (2006) 291–299.
[3] N. Kongsricharoern, C. Polprasert, Water Sci. Technol. 34 (9) (1996) 109–116.
[4] E.S. Abdel-Halim, S.S. Al-Deyab, Carbohydr. Polym. 86 (2011) 1306–1312.
[5] Q. Li, Y. Qian, H. Cui, Q. Zhang, R. Tang, J. Zhai, Chem. Eng. J. 173 (2011) 715–721.
[6] Junxi Liu, Chuan Wang, Jianying Shi, Hong Liu, Yexiang Tong, J. Hazard. Mater. 163
(1) (2009) 370–375.
[7] R. Güell, E. Anticó, V. Salvadó, C. Fontàs, Sep. Purif. Technol. 62 (2008) 389–393.
[8] F. Gode, E. Pehlivan, J. Hazard. Mater. B119 (2005) 175–182.
[9] T. Sardohan, E. Kir, A. Gulec, Y. Cengeloglu, Sep. Purif. Technol. 74 (2010) 14–20.
[10] Lulu Fan, Chuannan Luo, Zhen Lv, Lu. Fuguang, Huamin Qiu, Colloids Surf. B:
Biointerfaces 88 (2011) 574–581.
[11] T. Karthikeyan, S. Rajgopal, L.R. Miranda, J. Hazard. Mater. B124 (2005) 192–199.
[12] K.C. Justi, V.T. Fávere, M.C.M. Laranjeira, A. Neves, R.A. Peralta, J. Colloid Interface
Sci. 291 (2005) 369–374.
[13] W.S. Wan Ngah, L.C. Teong, M.A.K.M. Hanafiah, Carbohydr. Polym. 83 (4) (2011)
1446–1456.
[14] Feng-Chin Wu, Ru-Ling Tseng, Ruey-Shin Juang, J. Environ. Manage. 91 (4) (2010)
798–806.
[15] Choong Jeon, Wolfgang H. Höll, Hydrometallurgy 71 (3–4) (2004) 421–428.
[16] Y.C. Chang, S.W. Chang, D.H. Chen, React. Funct. Polym. 66 (2006) 335–341.
[17] A.A. Atia, A.M. Donia, A.E. Shahin, Sep. Purif. Technol. 46 (2005) 208–213.
[18] H.V. Tran, L.D. Tran, T.N. Nguyen, Mater. Sci. Eng. C 30 (2010) 304–310.
[19] Guolin Huang, Hongyan Zhang, Jeffrey X. Shi, Tim A.G. Langrish, Ind. Eng. Chem.
Res. 48 (5) (2009) 2646–2651.
[20] Jingmiao Qu, Guang Liu, Yiming Wang, Ruoyu Hong, Adv. Powder Technol. 21 (4)
(2010) 461–467.
[21] APHA AWWA WPCF, S tandar d Methods for the Examination of Water and
Wastewater, 21st ed., American Public Health Association, Washington, DC,
2005.
[22] Y.S. Ho, Scientometrics 59 (2004) 171–177.
[23] N.K. Hamadi, X.D. Chen, M.M. Farid, M.G.Q. Lu, Chem. Eng. J. 84 (2001) 95–105.
[24] G.J. Alaerts, V. Jitjaturant, P. Kelderman, Water Sci. Technol. 21 (1989) 1701–1704.
[25] G. Cimino, A. Passerini, G. Toscano, Water Res. 34 (2000) 2955–2962.
[26] F.N. Acar, E. Malkoc, Bioresour. Technol. 94 (2004) 13–15.
[27] D.C. Sharma, C.F. Forster, Bioresour. Technol. 47 (1994) 257–264.
[28] S. Babel, T.A. Kurniawan, Chemosphere 54 (2000) 951–967.
[29] K. Selvi, S. Pattabhi, K. Kadirvelu, Bioresour. Technol. 80 (2001) 87–89.
[30] Y.A. Aydin, N.D. Aksoy, Chem. Eng. J. 151 (2009) 188–
194.
[31] R. Schmuhl, H.M. Krieg, K. Keizer, Water SA 27 (2001) 1–7.
0 50 100 150 200 250 300 350
0
2
4
6
8
10
12
14
16
18
40mg/L
80mg/L
180mg/L
t/q
t
(min.g/mg)
t(min)
Fig. 7. Kinetic pseudo-second order sorption kinetics of Cr(VI) (volume: 50 mL; absor-
bent dose: 0.1 g; initial concen trations: 40, 80 and 180 mg·L
− 1
;pHvalue:3.0;
temperature: 298 K).
Table 4
Comparison of the first-order and second-order adsorption rate constants, calculated q
e,cal
and experimental q
e,exp
values for different initial Cr(VI) concentrations.
C
0
(mg·L
−1
) q
e,exp
(mg/g) First-order kinetic model Second-order kinetic model
k
1
(min
−1
) q
e,cal
(mg·g
−1
)R
2
k
2
(g·mg
−1
·min
−1
) q
e,cal
(mg·g
−1
)R
2
40 19.42 0.029 5.59 0.946 8.38×10
−3
19.94 0.994
80 37.05 0.030 25.43 0.876 2.08×10
−3
38.46 0.992
180 53.8 0.025 22.04 0.956 2.16×10
−3
55.55 0.996
1218 N.N. Thinh et al. / Materials Science and Engineering C 33 (2013) 1214–1218