Charting Made Easy Part 3 docx
Bạn đang xem bản rút gọn của tài liệu. Xem và tải ngay bản đầy đủ của tài liệu tại đây (88.13 KB, 9 trang )
THE KEY REVERSAL DAY
A
nother price formation is the key reversal day. This
minor pattern often warns of an impending change in
trend. In an uptrend, prices usually open higher, then
break sharply to the downside and close below the previous
day’s closing price. (A bottom reversal day opens lower and
closes higher.)
Chapter 7
Charting Made Easy 25
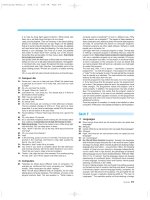
Figure 7-1. KEY REVERSAL DAYS IBM
Examples of key reversal days. The two downside reversal days are identified by
higher openings and lower closings on heavy volume. The bigger the price range, the
more significant is the reversal signal.
Downside reversal day
Downside
reversal day
Volume
Heavy
volume
Heavy
volume
Charts powered by MetaStock
26 Trade Secrets
The wider the day’s range and the heavier the volume, the
more significant the warning becomes and the more authority
it carries. Outside reversal days (where the high and low of the
current day’s range are both wider than the previous day’s
range) are considered more potent.The key reversal day is a rel-
atively minor pattern taken on its own merits, but can assume
major importance if other technical factors suggest that an
important change in trend is imminent (See Figure 7-1).
PERCENTAGE
RETRACEMENTS
M
arket trends seldom take place in straight lines. Most
trend pictures show a series of zig-zags with sever-
al corrections against the existing trend.These cor-
rections usually fall into certain predictable percentage para-
meters. The best-known example of this is the fifty-percent
retracement.That is to say, a secondary, or intermediate, cor-
rection against a major uptrend often retraces about half of
the prior uptrend before the bull trend is again resumed. Bear
market bounces often recover about half of the prior down-
trend.
A minimum retracement is usually about a third of the prior
trend. The two-thirds point is considered the maximum re-
tracement that is allowed if the prior trend is going to resume.
A retracement beyond the two-thirds point usually warns of a
trend reversal in progress. Chartists also place importance on
retracements of 38% and 62% which are called Fibonacci
retracements.
Chapter 8
Charting Made Easy 27
THE INTERPRETATION
OF VOLUME
C
hartists employ a two-dimensional approach to market
analysis that includes a study of price and volume. Of
the two,price is the more important.However,volume
provides important secondary confirmation of the price action
on the chart and often gives advance warning of an impending
shift in trend (See Figure 9-1).
Volume is the number of units traded during a given time
period,which is usually a day.It is the number of common stock
shares traded each day in the stock market.Volume can also be
monitored on a weekly basis for longer-range analysis.
When used in conjunction with the price action, volume tells
us something about the strength or weakness of the current
price trend.Volume measures the pressure behind a given price
move. As a rule, heavier volume (marked by larger vertical
bars at the bottom of the chart) should be present in the direc-
tion of the prevailing price trend. During an uptrend, heavier
volume should be seen during rallies, with lighter volume
(smaller volume bars) during downside corrections. In down-
trends, the heavier volume should occur on price selloffs. Bear
market bounces should take place on a lighter volume.
Chapter 9
Charting Made Easy 29
An example of price and volume moving in harmony during an uptrend. The price
advance during January 2000 saw heavy trading. The February correction was on light
volume. The resumption of the uptrend was on heavier volume again. That’s what
should happen during an uptrend.
Volume
Figure 9-1. PRICE AND VOLUME JDS Uniphase (JDSU)
30 Trade Secrets
Volume Is an Important Part of Price Patterns
Volume also plays an important role in the formation and res-
olution of price patterns. Each of the price patterns described
previously has its own volume pattern.As a rule, volume tends
to diminish as price patterns form.The subsequent breakout that
resolves the pattern takes on added significance if the price
breakout is accompanied by heavier volume. Heavier volume
accompanying the breaking of trendlines and support or resis-
tance levels lends greater weight to price activity (See Figure 9-2).
On-Balance Volume (OBV)
Market analysts have several indicators to measure trading
volume.One of the simplest, and most effect,is on-balance vol-
ume (OBV).OBV plots a running cumulative total of upside ver-
Charts powered by MetaStock
sus downside volume.Each day that a market closes higher,that
day’s volume is added to the previous total. On each down day,
the volume is subtracted from the total. Over time, the on-bal-
ance volume will start to trend upward or downward. If it
trends upward, that tells the trader that there’s more upside
than downside volume, which is a good sign.A falling OBV line
is usually a bearish sign.
Plotting OBV
The OBV line is usually plotted along the bottom of the price
chart. The idea is to make sure the price line and the OBV line
are trending in the same direction. If prices are rising, but the
OBV line is flat or falling, that means there may not be enough
volume to support higher prices. In that case, the divergence
between a rising price line and a flat or falling OBV line is a neg-
ative warning (See Figure 9-3).
Charting Made Easy 31
An example of volume used in a price pattern. The chart shows AOL breaking a “neck-
line” of a head and shoulders top. The breaking of the neckline coincided with a burst
in trading activity — which is usually a negative sign for the stock.
Volume
Figure 9-2. VOLUME USED IN A PRICE PATTERN America Online (AOL)
Heavy volume during
the price breakdown
Broken neckline
Charts powered by MetaStock
An example of price and OBV lines not confirming each other. The March 2000 move
to new highs by JDS Uniphase was accompanied by a flat OBV line. That was an early
warning of a possible top.
Figure 9-3. PRICE AND OBV LINES JDS Uniphase (JDSU)
OBV Breakouts
During periods of sideways price movement, when the mar-
ket trend is in doubt, the OBV line will sometimes break out
first and give an early hint of future price direction.An upside
breakout in the OBV line should catch the trader’s eye and
cause him or her to take a closer look at the market or stock in
question.At market bottoms, an upside breakout in on-balance
volume is sometimes an early warning of an emerging uptrend
(See Figure 9-4).
Other Volume Indicators
There are many other indicators that measure the trend of
volume — with names like Accumulation Distribution, Chaikin
Oscillator, Market Facilitation Index, and Money Flow. While
32 Trade Secrets
Flat OBV line
Rise in price
Charts powered by MetaStock
An example of the OBV line giving a bullish warning. During the decline in the price
of GE during the 1st quarter of 2000, the rising On-Balance Volume line hinted at the
bottom.
Figure 9-4. ON-BALANCE VOLUME (OBV) LINE General Electric (GE)
Charting Made Easy 33
Decline in price
Rising OBV line
On-Balance Volume (OBV) Line
they’re more complex in their calculations, they all have the
same intent — to determine if the volume trend is confirming,
or diverging from, the price trend.
Charts powered by MetaStock