Charting Made Easy Part 4 docx
Bạn đang xem bản rút gọn của tài liệu. Xem và tải ngay bản đầy đủ của tài liệu tại đây (96.45 KB, 12 trang )
USING DIFFERENT TIME
FRAMES FOR SHORT- AND
LONG-TERM VIEWS
B
ar chart analysis is not limited to daily bar charts.Weekly
and monthly charts provide a valuable long-term per-
spective on market history that cannot be obtained by
using daily charts alone.The daily bar chart usually shows up to
twelve months of price history for each market. Weekly charts
show almost five years of data, while the monthly charts go
back over 20 years (See Figure 10-1).
By studying these charts,the chartist gets a better idea of long-
term trends, where historic support and resistance levels are lo-
cated,and is able to obtain a clearer perspective on the more re-
cent action revealed in the daily charts. These weekly and
monthly charts lend themselves quite well to standard chart
analysis described in the preceding pages. The view held by
some market observers that chart analysis is useful only for
short-term analysis and timing is simply not true.The principles
of chart analysis can be used in any time dimension.
Using Intraday Charts
Daily and weekly charts are useful for intermediate- and long-
term analysis. For short-term trading, however, intraday charts
Chapter 10
Charting Made Easy 35
36 Trade Secrets
are extremely valuable. Intraday charts usually show only a few
days of trading activity. A 15-minute bar chart, for example,
might show only three or four days of trading.A 1-minute or a
5-minute chart usually shows only one or two days of trading
respectively, and is generally used for day-trading purposes.
Fortunately,all of the chart principles described herein can also
be applied to intraday charts (See Figure 10-2).
Going From the Long Term to the Short Term
As indispensable as the daily bar charts are to market timing
and analysis, a thorough chart analysis should begin with the
monthly and weekly charts — and in that order.The purpose of
that approach is to provide the analyst with the necessary long-
term view as a starting point. Once that is obtained on the 20-
year monthly chart, the 5-year weekly chart should be consult-
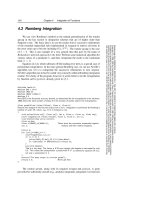
A demonstration of the importance of long-term perspective achieved by a weekly chart
going back almost two years. The triple top provides the first clue that a major reversal
may have begun. The reversal is later confirmed by a break in the trend begun in early
2000, followed by a second break of the longer term up trend.
Figure 10-1. WEEKLY BAR CHART Intel Corporation (INTC)
2nd broken trendline
Downward
trend
Triple top
1
2
3
1st broken
trendline
Charts powered by MetaStock
Example of a 15-minute bar chart showing only four days of trading. Charting principles
can be seen on these intraday charts and are extremely helpful for short-term trading.
Figure 10-2. INTRADAY CHART Intel Corporation (INTC)
Charting Made Easy 37
Head
Left shoulder
Right shoulder
Broken neckline
Neckline
15-Minute Bar Chart
ed. Only then should the daily chart be studied. In other words,
the proper order to follow is to begin with a solid overview and
then gradually shorten the time horizon. (For even more micro-
scopic market analysis, the study of the daily chart can be fol-
lowed by the scrutiny of intraday charts.)
Charts powered by MetaStock
USING A TOP-DOWN
MARKET APPROACH
T
he idea of beginning one’s analysis with a broader view
and gradually narrowing one’s focus has another impor-
tant application in the field of market analysis.That has
to do with utilizing a “top-down” approach to analyzing the
stock market. This approach utilizes a three-step approach to
finding winning stocks. It starts with an overall market view to
determine whether the stock market is moving up or down,
and whether this is a good time to be investing in the market.
It then breaks the stock market down into market sectors and
industry groups to determine which parts of the stock market
look the strongest. Finally, it seeks out leading stocks in those
leading sectors and groups.
THE FIRST STEP: The Major Market Averages
The intent of the first step in the “top-down” approach is to
determine the trend of the overall market. The presence of a
bull market (a rising trend) is considered a good time to invest
funds in the stock market. The presence of a bear market (a
falling trend) might suggest a more cautious approach to the
stock market. In the past, it was possible to look at one of sev-
eral major market averages to gauge the market’s trend. That
Chapter 11
Charting Made Easy 39
40 Trade Secrets
was because most major averages usually trended in the same
direction. That hasn’t always been the case in recent history
however. For that reason, it’s important to have some familiari-
ty with the major market averages, and to know what each one
actually measures.
Different Averages Measure Different Things
The traditional blue chip averages — like the Dow Jones
Industrial Average, the NYSE Composite Index, and the S&P
500 — generally give the best measure of the major market
trend.The Nasdaq Composite Index,by contrast,is heavily influ-
enced by technology stocks.While the Nasdaq is a good barom-
eter of trends in the technology sector, it’s less useful as a mea-
sure of the overall market trend.The Russell 2000 Index mea-
sures the performance of smaller stocks. For that reason, it’s
used mainly to gauge the performance of that sector of the mar-
ket.The Russell is less useful as a measure of the broader mar-
ket which is comprised of larger stocks.
Since most of these market averages are readily available in the
financial press and on the Internet,it’s usually a good idea to keep
an eye on all of them.The strongest signals about market direc-
tions are given when all or most of the major market averages are
trending in the same direction (See Figure 11-1).
THE SECOND STEP: Sectors and Industry Groups
The stock market is divided into market sectors which are
subdivided further into industry groups. There are ten market
sectors, which include Basic Materials, Consumer Cyclicals,
Consumer Non-Cyclicals, Energy, Financial, Healthcare, Indus-
trial, Technology, Telecommunications, and Utilities. Each of
those sectors can have as many as a dozen or more industry
groups. For example, some groups in the Technology sector are
Computers, the Internet, Networkers, Office Equipment, and
Semiconductors. The Financial sector includes Banks, Insur-
ance, and Securities Brokers.
The recommended way to approach this group is to start
with the smaller number of market sectors. Look for the ones
that seem to be the strongest. During most of 1999 and into the
early part of 2000, for example, technology stocks represented
the strongest market sector. Once you’ve isolated the preferred
sector, you can then look for the strongest industry groups in
that sector. Two leading candidates during the period of time
just described were Internet and Semiconductor stocks. The
idea is to be in the strongest industry groups within the
strongest market sectors (See Figure 11-2).
For many investors, the search can stop there.The choice to
be in a market sector or industry group can easily be imple-
Charting Made Easy 41
The best way to determine the trend of the stock market is to chart one of the major mar-
ket averages. This example shows that the NYSE Composite Index has been rising for
several years.
Figure 11-1. MAJOR MARKET AVERAGE NYSE Composite Index (Weekly)
Charts powered by MetaStock
42 Trade Secrets
mented through the use of mutual funds that specialize in spe-
cific market sectors or industry groups.
THE THIRD STEP: Individual Stocks
For those investors who deal in individual stocks, this is the
third step in the “top-down”market approach.Having isolated an
industry group that has strong upside potential, the trader can
then look within that group for winning stocks. It’s been esti-
mated that as much as 50% of a stock’s direction is determined
by the direction of its industry group. If you’ve already found a
winning group, your work is half done.
Another advantage of limiting your stock search to winning
sectors and groups is that it narrows the search considerably.
There are as many as 5,000 stocks that an investor can choose
from. It’s pretty tough doing a market analysis of so many mar-
An example of a strong industry group. During the first quarter of 2000, semiconductor
stocks were the strongest group in a strong technology sector.
Figure 11-2. STRONG INDUSTRY GROUP PHLX Semiconductor (SOX) Index
Daily Bars
Charts powered by MetaStock
Charting Made Easy 43
Intel was one of the strongest semiconductor stocks during the first three months of
2000. Having started the search in a strong semiconductor group, the search for a
winning stock is made a lot easier.
Figure 11-3. INDIVIDUAL STOCKS Intel Corporation (INTC)
Daily Bars
Charts powered by MetaStock
kets.Some sort of screening process is required.That’s where the
three-step process comes in.By narrowing your stock search to a
small number of industry groups,the number of stocks you have
to study is dramatically reduced.You also have the added comfort
of knowing that each stock you look at is already part of a win-
ning group (See Figure 11-3).
MOVING AVERAGES
I
n the realm of technical indicators, moving averages are
extremely popular with market technicians and with good
reason.Moving averages smooth the price action and make
it easier to spot the underlying trends. Precise trend signals can
be obtained from the interaction between a price and an aver-
age or between two or more averages themselves. Since the
moving average is constructed by averaging several days’ clos-
ing prices, however, it tends to lag behind the price action.The
shorter the average (meaning the fewer days used in its calcu-
lation), the more sensitive it is to price changes and the closer
it trails the price action. A longer average (with more days
included in its calculation) tracks the price action from a
greater distance and is less responsive to trend changes. The
moving average is easily quantified and lends itself especially
well to historical testing.Mainly for those reasons,it is the main-
stay of most mechanical trend-following systems.
Popular Moving Averages
In stock market analysis, the most popular moving average
lengths are 50 and 200 days. [On weekly charts, those daily val-
ues are converted into 10 and 40-week averages.] During an
uptrend, prices should stay above the 50-day average. Minor
pullbacks often bounce off that average, which acts as a sup-
Chapter 12
Charting Made Easy 45
46 Trade Secrets
port level.A decisive close beneath the 50-day average is usual-
ly one of the first signs that a stock is entering a more severe
correction. In many cases, the breaking of the 50-day average
signals a further decline down to the 200-day average. If a mar-
ket is in a normal bull market correction,it should find new sup-
port around its 200-day average. [For short-term trading pur-
poses, traders will employ a 20-day average to spot short-term
trend changes].
Bollinger Bands
These are trading bands plotted two standard deviations
above and below a 20-day moving average. When a market
touches (or exceeds) one of the trading bands, the market is
considered to be over-extended. Prices will often pull back to
the moving average line.
Moving Average Convergence Divergence (MACD)
The MACD is a popular trading system. On your computer
screen, you’ll see two weighted moving averages (weighted
moving averages give greater weight to the more recent price
action).Trading signals are given when the two lines cross.