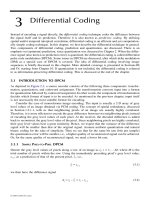
Hardware and Computer Organization- P3: pdf
Bạn đang xem bản rút gọn của tài liệu. Xem và tải ngay bản đầy đủ của tài liệu tại đây (1.05 MB, 30 trang )
Chapter 2
42
value around 10 ohms as the voltage on the gate, relative to the source increases. In real terms, the
amount that the voltage on the gate has to vary to cause this dramatic change is exactly the voltage
swing from logic 0 to logic 1. As far as our electrical circuit analogy of Figure 2.12 is concerned,
this is equivalent to closing the switch as we raise the voltage on the gate. As you can see, the
p-channel device behaves in a similar manner as the voltage on the gate becomes more negative
then the voltage of the source. In other words, it exhibits complementary behavior. Now, we can
finally put this all together and understand CMOS gates in general and Figure 2.13 in particular.
Refer back to Figure 2.13. Recall that this is a NOT gate. Let’s see why. Assume that the volt
-
age on the gate is a logic 0. The n-type transistor is essentially an open switch. The resistance
is extremely high (because V
GS
is nearly zero). However, the complementary device, the p-type
device has a very low resistance because the voltage on the gate is much lower then the voltage of
the source (–V
GS
is large). This is the closed switch of Figure 2.12.
Thus, at the output of the gate, we see a low resistance (closed switch) to logic 1 and a high resis-
tance (open switch to logic 0) and the output of the gate is logic 1. So, when the input to the gate is
logic 0, the output from the gate is logic 1. You should be able to analyze the complementary situ
-
ation for an input of logic level 1. So, we can summarize the behavior of the CMOS NOT gate as
follows. When the input is at logic 0, the output “sees” the power supply voltage, or logic 1. When
the input is logic 1, the output sees the ground reference voltage, or logic 0.
Figure 2.14 illustrates the electrical behavior of MOS transistors. Consider the N-channel device on
the right-hand side of the graph. As the voltage on the gate, measured relative to the source (Vgs)
becomes higher, or more positive, the electrical resistance between the drain and the source decreases
exponentially. Conversely, when Vgs approaches zero, or becomes negative, the resistance between
the drain and the source approaches infinity. Essentially, we have an open switch when Vgs is zero or
negative, and almost a closed switch when Vgs is a few volts. The behavior of the P-channel device is
identical to the N-channel device, except that the relative polarity of the voltages are reversed.
Before we leave this topic of the electrical
behavior of a CMOS gate, you might be asking
yourself, “What about the situation where the
voltage on the gate, relative to the source, isn’t all
one way or the other, but in the middle?” In other
words, what happens when the rising edge or the
falling edge of the logic input to the gate is tran
-
sitioning between the two logic states? According
to the graph in Figure 2.14, if the resistance is
too high, and it isn’t too low, it is kind of like the
temperature of the porridge in “Goldilocks and
the Three Bears.” At that point, there is a path
for the current to flow from the power supply to
ground, so we do waste some energy. Fortunately,
the transition between states is fast, so we don’t
waste a lot of energy, but nevertheless, there is
some power dissipation occurring.
Figure 2.15: Power dissipation versus clock rate
for various AMD processor families. From
www.tomshardware.com
3
.
Introduction to Digital Logic
43
Well how bad is it. Recall that a modern processor has tens of millions of CMOS gates and a large
fraction of these gates are switching a billion or more times per second. Figure 2.15 should give you
some idea of how bad it could be.
Notice two things. First, these modern processors really run hot. In fact, they are dissipating as
much heat as an ordinary 60–75 watt lightbulb. Also, in each case, as we turn up the clock and
make the processors run faster, we see the power dissipation going up as well.
You might also be asking another question, “Suppose we turn the clock down until it is really slow,
or even stop it, will that have the reverse effect?” Absolutely, by slowing the clock, or shutting
down portions of the chip, we can decrease the power requirements accordingly. This is a very
important strategy in laptop computers, which have to make their batteries last for the duration
of an airplane flight from New York to Los Angeles. This is also the strategy of how many other
microprocessors, the kind that are used in embedded applications, can be attached to a collar
around the neck of a moose and track the animal’s movements for over two years on no more
power than a AAA battery. No wonder CMOS is so popular.
OK, we’ve seen a NOT gate. That’s a pretty simple
gate. How about something a little more
complicated? Let’s do a NAND gate in
CMOS.
Recall that for a NAND gate, the output
is 0 if all the inputs are logic 1. In Figure
2.16, we see that if all of the inputs are at
logic 1, then all of the n-channel devices
are turned on to the low resistance state.
All of the p-channel devices are turned
off, so, looking back into the device from
the output, we see a low resistance path
to the ground reference point (logic 0).
Now, if any one of the four inputs
A, B, C
or D is in logic state 0, then its n-channel
MOSFET is in the high-resistance state
and its p-channel device is in the low-
resistance state. This will effectively
block the ground reference point from the
output and open a low resistance path to
the power supply through the corre
-
sponding p-channel device.
Hopefully, at this point you are getting
to be a little more comfortable with
your burgeoning hardware skills and
insights. Let’s analyze a circuit config
-
uration. Consider Figure 2.17. This is
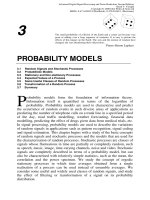
Figure 2.16: Schematic diagram of a CMOS, 4-input
NAND gate. From Fairchild Semiconductor.
4
V
CC
A B C D
X = ABCD
A
B
C
D
A
B
C
D
Figure 2.17: The Shakespeare circuit.
OR
2B
C =
?
NO
T
Chapter 2
44
often called the “Shakespeare Circuit.” You
may feel free to ponder the deeper signifi-
cance of the design. Note that I included
this example just to prove that all comput
-
er designers are NOT humorless geeks.
Truth Tables
The last concept that we’ll discuss in this
lesson is the idea of the truth table. You
had a brief introduction to the truth table
when we discussed the behavior of the
tri-state logic gate. However, it is appropri
-
ate at this point in our analysis to discuss
it more formally. The truth table is, as its
name implies a tabular form that repre
-
sents the TRUE/FALSE conditions of a
logical gate or system. For each of the logical gates we’ve studied so far, AND, OR, NAND, NOR
and XOR, we’ve used a verbal expression to describe the function of the gate.
For example, with an AND gate we say, “The output of an AND gate is 1 if and only if both inputs
are 1.” This does get the logic across, but we need a better way to manipulate these gates and to
design more complex systems. The method that we use is to create a truth table for the logic func
-
tion. Figure 2.18 shows the truth tables for the five logic gates we’ve studied so far. The NOT gate
is trivial so we won’t include it here, and we’ve already seen the truth table for the tri-state gate, so
it isn’t included in the figure.
The truth table shows us the value of the output variable, C, for every possible value of the input
variables, A and B. Since there are two independent input variables, the pair can take on any one of
four possible combinations. Referring to Figure 2.18, we see that the output of the AND gate, C, is a
logical 1 only when both A and B are 1. All other combinations result in C equal to 0. Likewise, the
OR gate has its output equal to 1, if any one of the input variables, or both, is equal to 1. The truth
table gives us a concise, graphical way to express the logical functions that we are working with.
Suppose that our AND gate has three inputs, or four inputs? What does the truth table look like for
that? If we have three independent input variables: A, B, and C, then the truth table would have
eight possible combinations, or rows, to represent all of the possible combinations of the input
variables. If we had a 3-input AND gate, only one condition out of the eight, (
A = 1, B = 1,
C = 1) would product a 1 on the gate’s output. For four input variables, we would need sixteen
possible entries in our truth table. Thus, in general, our truth table must have 2
N
entries for a sys-
tem of N independent input variables. There’s that pesky binary number system again. Figure 2.19
shows the truth tables and logic symbols for a 4-input AND gate and a 3-input OR gate. It is pos
-
sible to find commercially available AND, NAND, OR and NOR circuits with 5 or more inputs.
There are also versions of the NAND circuit that are designed to be able to expand the number of
inputs to arbitrarily large values, although there are probably not many reasons to do so.
Figure 2.18: Truth table representation for the logical
functions AND, OR, NAND, NOR and XOR.
A
B C
0
1
0
1
0
0
1
1
0
0
0
1
AN
D
A
B C
0
1
0
1
0
0
1
1
0
1
1
1
OR
A
B C
0
1
0
1
0
0
1
1
1
1
1
0
NAND
A
B C
0
1
0
1
0
0
1
1
1
0
0
0
NO
R
A
B C
0
1
0
1
0
0
1
1
0
1
1
0
XO
R
Introduction to Digital Logic
45
a
b
c
d
e
f
g
h
?
X
Y
Z
Figure 2.20: A digital system being
designed. Each of the output variables X,
Y, and Z is described in a separate truth
table in terms of the combinations of the
all possible states of the input variables.
The XOR gate is an exception because it is only
defined for two inputs. While we could certainly
design a circuit with, for example, 5 inputs, A
through E and 1 output, f, that has the property
that f = 0 if and only if all the inputs are the
same, it would not be an XOR gate. It would be
an arbitrary digital circuit.
Consider the gray box of Figure 2.20. This is an
arbitrary digital system that could be the control
circuits of an elevator, a home heating and air
conditioner, or fire alarm controller. Ultimately,
we will be designing the circuit that is inside
of the gray box as a circuit built from the logic
gates that we’ve just discussed. Whatever it is,
it is up to us to specify the logical relationships
that each output variable has with the appropriate
input variable or variables. Since the gray box
has eight input variables, our truth table would
have 256 entries to start with. In other words, we
would design the system by first specifying the
behavior of X, Y, and Z (output conditions) for
each possible state of its inputs (a through h).
Thus, if we were designing a heating system for
a building and one of our inputs is derived from a
temperature sensor that is telling us that the tem-
perature in the room is lower than the temperature that we set on the thermostat, then it would be
logical that this condition should trigger the appropriate output response (ignite burner in furnace).
Referring to Figure 2-20, we might start out our design
process by creating a spreadsheet with
256 rows in it and 11 columns. We would devote one
column for each of the eight input variables and a
separate column for each of the three output variables.
Next, we would painstakingly fill in the table with all
of the 256 possible combinations of the input variables,
00000000 through 11111111. Finally—and here’s where
the real engineering starts—for each row, we would have
to decide how to assign a value to the output variables.
We’ll go into the process of designing these systems in
much greater detail in Chapter 3. For now, let’s summa
-
rize this discussion by recognizing that we’ve used the
truth table in two different, but related contexts:
A B C D f
0 0 0 0
0
1 0 0 0
0
0 1 0 0
0
1 1 0 0
0
0 0 1 0
0
1 0 1 0
0
0 1 1 0
0
1 1 1 0 0
0 0 0 1
0
1 0 0 1
0
0 1 0 1
0
1 1 0 1
0
0 0 1 1 0
1 0 1 1
0
0 1 1 1 0
1 1 1 1
1
0 0 0 0
1 0 0 1
0 1 0 1
1 1 0 1
0 0 1 1
1 0 1 1
0 1 1 1
1 1 1 1
A B C
f
A
4-input
AND
B
f
C
D
A
3-input
OR
B
f
C
Figure 2.19: Truth table and gate diagrams for a
4-input AND gate and a 3-input OR gate.
Chapter 2
46
1. The truth table could be used as a tabular format for describing the logical behavior of one
of the standard gates (AND, OR, NAND, NOR, XOR or TS).
2. We can specify an arbitrarily complex digital system by using the truth table to describe
how we want the digital system to behave when we finally create it.
Summary of Chapter 2
Here’s what we’ve accomplished:
• Learned the basic logic gates, AND, OR and NOT and saw how more complex gates, such
as NAND, NOR and XOR could be derived from them, and
• Learned that logic values that are dynamic, or change with time, may be represented on a
graph of logic level or voltage versus time. This is called a
waveform.
• Learned how CMOS logic gates are derived from electronic switching elements, MOSFET
transistors.
• Learned how to describe the logical behavior of a gate or digital circuit as a truth table.
Chapter 2: Endnotes
1
/>2
J. Watson, An Introduction to Field Effect Transistors, published by Siliconix, Inc., Santa Clara, CA, 1970, p. 91.
3
.
4
Fairchild Semiconductor Corp., Application Note 77, CMOS, The Ideal Logic Family, January, 1983.
47
1. Consider the simple AND circuit of Figure 1.14 and the OR circuit of Figure 2.5. Change the
sense of the logic so that an open switch (no current flowing) is TRUE and a closed switch is
FALSE. Also, change the sense of the light bulb so that the output is TRUE if the light is not
shining and FALSE if it is turned on. Under these new conditions of negative logic, what logic
function does each circuit represent?
2. Draw the circuit for a 2-input AND gate using CMOS transistors. Hint: use the diagram in
Figure 2.16 as a starting point.
3. Construct the truth table for the following logical equations:
a. F = a *
b * c + b * a
b. F = a * b +
a * c + b * c
4. What is the effect on the signal
between points A and B when the
voltage at point X is raised to logic
level 1?
5. Construct a truth table for a
parity
detection circuit. The circuit takes as
its input 4 variables, a through d, and
has one output, X. Input d is a control input. If d = 1, then the circuit measures odd parity; if
d = 0, the circuit measures even parity. Parity is measured on inputs a, b and c. Parity is odd
if there are an odd number of 1’s and parity is even if there is an even number of 1’s. For
example, if d = 1 and (a, b, c) = (1, 0, 0), then X = 1 because the parity is odd.
6. Draw the truth table that
corresponds to the logic gate
circuit shown, right:
Exercises for Chapter 2
B
A
X
B
NOR
AND
AN
D
OR
XOR
A
B
C
X
NOT
Chapter 2
48
7. The gate circuit for the XOR function, equation a ⊕ b = X, is shown in Figure 2.8. Given that
you can also express the XOR function as:
a ⊕ b = ~ [~ (a * b) * ~(a * b)].
Redesign this circuit using only NAND gates.
8. Consider the circuit of Figure 2.3. Suppose that we replace the AND gate shown in the figure
with (a) an OR gate and (b) and XOR gate. What would the output waveform look like for the
case where input A = 0 and the case where input A = 1?
49
C H A P T E R
3
Introduction to
Asynchronous Logic
Objectives
Use the principles of Boolean algebra to simplify and manipulate logical equations and
turn them into logical gate designs;
Create truth tables to describe the behavior of a digital system;
Use the Karnaugh map to simplify your logical designs;
Describe the physical attribute of logic signals, such as rise time, fall time and pulse width;
Express system clock signals in terms of frequency and period;
Manipulate time and frequency in terms of commonly used engineering units such as Kilo,
Mega, Giga, milli, micro, and nano;
Understand the logical operation of the Type 'D' flip-flop (D-FF);
Describe how binary counters, frequency dividers, shift registers and storage registers can
be built from D-FF's.
Introduction
Before we immerse ourselves in the rigors of logical analysis and design, it’s fair to step back,
take a breath and reflect on where all of this came from. We’ve may have been given the erroneous
impression that logic sprang forth from Silicon Valley with the invention of the transistor switch.
We generally trace the birth of modern logical analysis to the Greek
philosopher, Aristotle, who was born in 384 B.C., is generally acknowledged
to be the father of modern logical thought. Thus, if we were to be com
-
pletely accurate (and perhaps a bit generous), we might say that Aristotle is
the father of the modern digital computer. However, if we were to look at
the mathematics of the gates we’ve just been introduced to, we may find it
difficult to make the leap to Aristolean Logic. However, one simple example
might give us a hint.
The basis of Aristotle’s logic revolves around the notion of
deduction. You
may be more familiar with this concept from watching old Sherlock Holmes
movies, but Sherlock didn’t invent the idea of deductive reasoning, Aristotle did.
Aristotle proposes that a deductive argument has “things supposed,” or a premise of the argument,
and what “results of necessity” is the conclusion.
1
Figure 3.1: Aristotle.
Chapter 3
50
One often cited example is:
1. Humans are mortal.
2. Greeks are human.
3. Therefore, Greeks are mortal.
We can convert this to a slightly different format:
1. Let A be the state of human mortality. It may be either TRUE or FALSE that human
beings are mortal.
2. Let B be the state of Greeks. It may be TRUE or FALSE that natives of Greece are human
beings.
3. Therefore, the only TRUE condition is that if A is TRUE AND B is TRUE then Greeks are
mortal. Or, C (Greek mortality) = A * B.
We can trace our ability to manipulate logical expressions to the English
mathematician and logician, George Boole (1816–1864).
“In 1854, Boole published an investigation into the Laws of Thought, on
Which are founded the Mathematical Theories of Logic and Probabilities.
Boole approached logic in a new way reducing it to a simple algebra,
incorporating logic into mathematics. He pointed out the analogy between
algebraic symbols and those that represent logical forms. It began the algebra
of logic called Boolean algebra, which now finds application in computer
construction, switching circuits etc.”
2
Boolean algebra provides us with the toolset that we need to design complex
logic systems with the certainty that the circuit will perform exactly as we
intended it that it should. Also, as you’ll soon see, the process of designing a digital circuit often
leads to designs that are quite redundant and in need of simplification. Boolean algebra gives us
the tools we need to simplify the circuit design and be confident that it will work as designed with
the absolute minimum of hardware. As engineers, this is exactly the kind of analytical tool we need
because we are most often tasked with producing the most cost-effective design possible.
In working with digital computing systems, there are two distinctly different binary systems with
which we’ll need to become familiar. Earlier in this course, we were introduced to the binary num
-
ber system. This is convenient, because we need for our computer to be able to operate on numbers
larger than one bit in width. The other component of this is the operation of the hardware as digital
system. In order to understand how the numbers are manipulated, we need to learn the principles
of binary logical algebra, or Boolean algebra.
Therefore, the first step in the process is to state some of the laws of Boolean algebra. In most
cases, the laws should be obvious to you. In other cases, you might have to scratch your head a
bit until you see that we’re dealing with logical operations on variables that can only have two
possible values, and not the addition and multiplication of variables that can take on a continuum
of values. Also, be aware that there is no fixed convention for representing a NOT condition, and
several variant representations may apply. This is partially historical because the basic ASCII set
Figure 3.2:
George Boole.
Introduction to Asynchronous Logic
51
of printable characters did not give us a simple way to represent a NOT variable, that is a variable
with a line over it, as shown in Chapter 2, Figure 2.4. Thus, you may see several different repre
-
sentations of the NOT condition. For example, /A , ~A , *A and A* are all commonly used ways
of representing the condition, NOT A. I will avoid using the *A and A* notations because it is too
easy to confuse this with the AND symbol. However, I will occasionally use ~A and /A inter
-
changeably in the text for the NOT A condition if it makes the equation easier to understand. Most
figures will continue to use the bar notation for the NOT condition. Sorry for the confusion.
Laws of Boolean Algebra
Laws of Complementation
• First law of complementation:
If A = 0 then A = 1 and if A = 1
then A = 0
• Second law of complementation:
A * A = 0
• Third law of complementation:
A + A = 1
• Law of double complementation:
/(A) = //A = A
Laws of Commutation
• Commutation law for AND:
A * B = B * A
• Commutation law for OR:
A + B = B + A
Associative Laws
• Associative law for AND:
A * (B * C ) = C * ( A * B )
• Associative law for OR:
A + (B + C ) = C + ( A + B )
The associative laws enable us to combine three or more variables. The law tells us that we may
combine the variables in any order without changing the result of the combinations. As we’ve
seen in Chapter 2, this is the law that allows us, for example, to combine two, 2-input OR gates
to obtain the logical equivalent of a single 3-input OR gate. It should be noted that when we say
the “logical equivalent” we are neglecting any electrical differences. As we have seen, the timing
behavior of a logic gate must be taken into account in any real system.
Distributive Laws
• First distributive law:
A * (B + C ) = ( A * B ) + ( A* C )
• Second distributive law:
A + (B * C ) = ( A + B ) * ( A + C )
The distributive laws look a lot like the algebraic operations of factoring and multiplying out.
Laws of Tautology
• First law of tautology:
A * A = A
If A = 1 then A * A = 1. If A = 0, then A * A = 0.
So the expression A * A reduced to A.
• Second law of tautology:
A + A = A
If A = 1, then 1 + 1 = 1 , If A = 0, then 0 + 0 = 0.
Again, the expression simply reduced to A.
Chapter 3
52
Law of Tautology with Constants
• A + 1 = 1
• A * 1 = A
• A * 0 = 0
• A + 0 = A
Laws of Absorption
• First law of absorption:
A * ( A + B ) = A
• Second law of absorption:
A + ( A * B ) = A
This one is a bit trickier to see. Consider the expression: A * (A + B).
If A = 1, then this becomes 1 * (1 + B). By the law of tautology with constants, 1 + B = 1 so we
are left with 1 + 1 = 1. If A = 0, the first expression now becomes 0 * (0 + B). Again, by the law of
tautology with constants, this reduces to 0 * B, which has to be 0. Thus, in both cases, the expres
-
sion reduced to the value of A, the value of B does not figure in the result.
DeMorgan’s Theorems
• Case 1: ( A * B ) = A + B
• Case 2: ( A + B ) = A * B
DeMorgan’s theorems are very important because they show the relationship between the AND
and OR functions and the concepts of positive and negative logic. Also, DeMorgan’s theorems
show us that any logic function using AND gates and inverters (NOT gates) may be duplicated
using OR gates and inverters. Also notice that the left side of both of the above equations are just
the compound logic functions NAND and NOR, respectively.
Before we move on, we should discuss the relationship between DeMorgan’s theorems and logic
polarity. Up to now, we’ve adopted the convention that the more positive, or higher voltage signal
was a 1, and the lower voltage, or more negative voltage was a 0. This is a good way to introduce
the topic of logic because it’s easier to think about TRUE/FALSE, 1/0 and HIGH/LOW in a con-
sistent manner. However, while TRUE and FALSE have a logical significance, from an electrical
circuit point of view it is rather arbitrary just how we define our logic.
This is not to say that the electrical circuit that is an AND gate would still be an AND gate if we
swapped 1 and 0 in the electrical sense. It wouldn’t. It would be an OR gate. Likewise, the OR gate
would become an AND gate if we swapped 1 and 0 so that the lower voltage became a 1 and the higher
voltage became a 0. You can verify this for yourself by reviewing the truth tables for the AND gate
and OR gate in Lesson 1. You can see that if you take the truth table for the AND gate and swap all of
the 1’s with 0’s and all of the 0’s with 1’s, you end up with the truth table for the OR gate (in negative
logic). Try it again for the OR gate and you’ll see that you now have an AND gate in negative logic.
An important point to keep in mind is that the same electronic circuit will give us the logical
behavior of an AND gate if we adopt the convention that logical 1 is the more positive voltage.
Thus, a logical 1 might be anything greater than about +3 volts and a logical 0 might be anything
less than about 0.5 V. We call this positive logic. However, if we reverse our definition of what
Introduction to Asynchronous Logic
53
voltage represents a 1 and what voltage represents a 0, the same circuit element now gives us the
logical OR function (negative logic).
Thus, in a digital system, we usually make TRUE and FALSE whatever we need it to be in order
to implement the most efficient circuit design. Since we can’t depend upon a consistent meaning
for TRUE and FALSE, we generally use the term
assert. When a signal is asserted, it becomes
active. It may become active by changing from a logic level LOW to a logic level HIGH, or vice
versa. As you’ll see shortly when we discuss memory systems, most of the memory control signals
are asserted LOW, even though the address of the memory cells and the data stored in them are
asserted HIGH. You saw this in Chapter 2 when we discussed the logical behavior of the tri-state
gate. Recall that the tri-state gate’s output goes into the low-Z state when the output enable (OE)
input is asserted low. This does not mean that the
OE signal is FALSE, or TRUE in the negative
logic sense, it simply means that the signal become active in the low state.
In Figure 2.20, we considered the most general case of a logical system design. Each of 3 output
variables is defined as a function of up to 8 input variables, i.e., X =
f ( a, b, c, d, e, f, g, h), and so
on. Note that output variables X, Y and Z may each be a separate function of some or all of the
input variables, a through h. The problem that we must now solve is in four parts:
1. How do we use the truth table to describe the intended behavior of our digital system?
This is just specifying your design.
2. Once we have the behavior we want (as defined by the truth table), how do we use the
laws of Boolean algebra to transform the truth table into a Boolean algebraic description
of the system?
3. When we can describe the design as a system of equations, can we use some of the rules
of Boolean algebra to simplify the equations?
4. Finally, when we can describe the equations of our system in the simplest algebraic form,
then how can we convert the equations to a real circuit design?
In a moment, we’ll see how to slog through this, and using the rules of Boolean algebra, reduce it
to a simpler form. However, if we knew beforehand that output Y only depended upon inputs c, d,
and g, then we could immediately simplify the design task by limiting the truth table for Y to one
with only 3 input variables instead of eight. As we’ll soon see, the general case can be reduced
to the simplified case, so either path gets you to the end point. It is often the case that you won’t
know beforehand that there is no dependence of an output variable on certain input variables; you
only learn this after you go through all of the algebraic simplifications.
Figure 3.3, is an example of some arbitrary truth table design. It doesn’t describe a real system, at
least not one that I’m aware of. I just made it up to go through the simplification process.
Outputs E and F are the two dependent variables that are functions of input variables A through
D. Since there are 4 input variables, there are 2
4
, or 16, possible combinations in the truth table,
representing all the possible combinations of the input variables. Also, note how each of the input
variables are written in each column. Using a method like this insures that there are no missing or
duplicate terms. Since this is a made-up example, there is no real relationship between the output
variables and the input variables. This means that I arbitrarily placed 1’s and 0’s in the E and F
columns to make the example look interesting. If this exercise was part of a real digital design prob-
Chapter 3
54
lem, you, the designer, would consider each row
of the truth table and then decide what should be
the response of each of the dependent outputs do in
response to that particular combination of inputs.
For example, suppose that we’re designing a
simple controller for a burglar alarm system. Let’s
say that output E controls a warning buzzer inside
the house and output F controls a loud siren that
can wake up the neighborhood if it goes off. Inputs
A, B, and C are sensors that detect an intruder
and input D is the button that controls whether or
not the burglar alarm is active or not. If D = 0, the
system is deactivated, if D = 1, the system is active
and the sirens can go off.
In this case, for all the conditions in the truth table
where D = 0, you don’t want to allow the outputs to
become asserted, no matter what the state of inputs
A, B, or C. If D = 1, then you need to consider the
effect of the other inputs. Thus, each row of the truth table gives you a new set of conditions for
which you need to independently evaluate the behavior of the outputs. Sometimes, you can make
some obvious decisions when certain variables (D = 0) have global effects on the system.
However, suppose for a moment that the example of Figure 3.3 actually represented something
real. Let’s consider output variable F. The logical equation,
F = A * B * C * D + A * B * C * D
term 1 term 2
tells us that F will be TRUE under two different set of input conditions. Either the condition that
all the inputs are FALSE (term 1) or A and D are FALSE, while B and C are TRUE (term 2) will
cause the output variable F to be TRUE. How did we know this to be the case? We designed it that
way! As the engineers responsible for this digital design, these are the two particular set of input
conditions that can cause output F to be TRUE.
We call this form of the logical equation the sum or products form, or minterm form. There is an
alternate form called the maxterm form, which could be described as a product of sums. The two
forms can be converted from one to the other through DeMorgan’s Theorems. For our purposes,
we’ll restrict ourselves to the minterm form.
Remember, this truth table is an example of some digital system design. In a way, it represents a
shorthand notation for the design specification for the system. At this point we don’t know why
the columns for the dependent variables,
E and F, have 1s or 0s in some rows and not others. That
came out of the design of the system. We’re engineers and that’s the engineering design phase.
What comes after the design phase is the implementation phase. So, let’s tackle the implementa
-
tion of the design.
Figure 3.3: Truth table for an example digital
system design. Outputs E and F are the SUM of
Products (minterm) representation of the truth
table.
A B C D E F
0 0 0 0 0 1
1 0 0 0 0 0
0 1 0 0 0 0
1 1 0 0 0 0
0 0 1 0 1 0
1 0 1 0 1 0
0 1 1 0 0 1
1 1 1 0 0 0
0 0 0 1 0 0
1 0 0 1 0 0
0 1 0 1 0 0
1 1 0 1 0 0
0 0 1 1 0 0
1 0 1 1 0 0
0 1 1 1 0 0
1 1 1 1 1 0
E = A*B*C*D + A*B*C*D + A*B*C*D
F = A*B*C*D + A*B*C*D
Introduction to Asynchronous Logic
55
Referring to Figure 3.3, we see that that output variable, E, is TRUE for three possible combina-
tions of the input variables, A through D:
1. A * B * C * D
2. A *
B * C * D
3. A * B * C * D
We can express this relationship as a logical equation:
E= A * B * C * D + A * B * C * D + A * B * C * D
The OR’ing of the three AND terms means that any one of the three AND terms will cause E to be
TRUE. Thus, for the
combination, we need to use AND. For the aggregation, we use OR. Like-
wise, we can express the value of
F as
F = A * B * C * D + A * B * C * D
At this point it would be relatively easy to translate these equations to logic gates and we would
have our digital logic system done. Right? Actually, we’re sort of right. We still don’t know if the
terms have any redundancies in them that we could possibly eliminate and make the circuit easier
to build. The redundancies are natural consequences of the way we build the system from the truth
table. Each row is considered independently of the other, so it is natural to assume that certain
duplications will creep into our equations.
Using the laws of Boolean algebra, we could manipulate the equations and do the simplifications.
However, the most common form of redundant term is A * B + A *
B.
It is easy to show that A * B + A *
B = A. How?
1. First Distributive Law: A * B + A *
B = A * (B + B)
2. Third Law of Complementation: B +
B = 1
3. Finally, A * 1 = A
Thus, if we can group the terms in a way that allows us to “factor out” a set of common AND
terms and be left with an OR term appearing with its complement, then that term drops out.
The Karnaugh Map
In a classic paper, Karnaugh
3
(pronounced CAR NO) described a graphical method of simplifying
the sum of products equation of the truth table without the need to resort to using Boolean algebra
directly. The Karnaugh map is a graphical solution to the Boolean algebraic simplification:
A * B + A *
B = A
This simplification is one of the most commonly occurring ones because of the redundancies that
are inherent in the construction of a truth table.
There are a few simple rules to follow in building the Karnaugh map (K-map). Figure 3.4 shows
the construction of 3, 4 and 5 variable K-maps.
Refer to the K-map for 4 input variables. Note the vertical dark gray edges and the horizontal light
gray edges. These edges are considered to be adjacent to each other. In other words, the map can
be considered to be a cylinder wrapped either horizontally or vertically.
Chapter 3
56
The method used to identify the columns may look strange to you but if you look carefully you’ll
see that as you move across the top of the map, the changes in the variables A and B are such that:
• Only one variable changes at a time,
• All possible combinations are represented,
• The variables in column 1 and column 4 are adjacent to each other.
The order for listing the variables shown in Figure 3.4 is not the only way to do it, it is just the way
that I am most comfortable using and, through experience, is the way that I know I am drawing the
map correctly. It is easy to have the correct set of variables listed, but to make a mistake in getting
the order correctly listed, which will thus yield erroneous results. In other words, “Garbage in,
garbage out.”
Another point that should be noted is that the K-map yields the most simple form of the equation
when the number of variables is 4 or less. For maps of 5 or more variables, the correct procedure
is to use a 3-dimension map comprised of planes of multiple 4 variable maps. However, for the
purposes of this discussion, we’ll make it a point to note whenever the 5 variable maps require
further simplification. In other words, it’s easier to do a little Boolean algebra than it is to draw a
3D K-map.
We can summarize the steps necessary to simplify a truth table using the K-map process as follows:
1. The number of cells in the K-map equals the number of possible combinations of input
variable states. For example,
a. 4 input variables: A, B, C, D = 16 cells
b. 3 input variables: A, B, C = 8 cells
c. 5 input variables: A, B, C, D, E = 32 cells
Thus, the number of cells = 2
(NUMBER OF INPUT VARIABLES)
Figure 3.4: Format for building a Karnaugh map in 3, 4 and 5 variables.
AB AB AB AB
C
C
K-
map for 3-input variables
AB AB AB AB
CD
CD
CD
CD
K-map for 4-
input variables
ABC ABC ABC ABC ABC ABC ABC ABC
DE
DE
DE
DE
K-
map for 5-input variables
Note
:
1-
The colored lines are actually
adjacent
to each other
2- The corner cells are adjacent
3- The variables are organized
so that only one variable changes
as
you go from cell to cell, including
the opposite
ends
4-
Diagonals are not adjacent
Note:
1.
The gray colored lines are actually
adjacent to each other
2.
The corner cells are adjacent
3.
The variables are organized
so that only one variable changes
as you go from cell to cell, including
the opposite ends
4. Diagonals are not ad
jacent
Introduction to Asynchronous Logic
57
2. Construct the K-map so that
as you move across the col
-
umns or down the column,
only one variable changes.
Referring to Figure 3.5,
note that the first and last
columns are adjacent and
the top and bottom rows are
also adjacent. It is as if the
map is actually wrapped
on a cylinder. Note that the
first and last cells along the
diagonals are not consid-
ered to be adjacent.
3. Construct a separate K-map
for every output variable.
4. Place a “1” in every cell of
the K-map that has a “1” in
the corresponding row of the truth table.
5. Draw a loop around the largest possible number of
adjacent cells that contain a 1. You
can form loops of 2, 4, 8, 16, 32 and so on in adjacent cells.
6. You may form multiple loops and a cell in one loop may be in another loop, but each loop
must contain at least one cell that is not contained in any other loop. Inspect the map for
any loop whose terms are all enclosed in other loops and remove those loops.
7. Finally, simplify the loop by removing any variable that appears within that loop in both
its complemented and un-complemented form. The simplified equation is now the ORing
of the loops of the K-map where each loop represents the simplified minterm form.
Perhaps an example would help. Figure 3.5 demonstrates the process. We have a truth table with
three independent input variables—A, B, and C—and one dependent output variable, x. Three
input variables imply eight rows for the truth table. In Figure 2.5, there are four rows that have a 1
in the “x” column. We can thus write down the unsimplified logic equation for x:
x = A * B * C + A * B * C + A * B * C + A * B * C
• Now, refer to Figure 3.5. The K-map corresponding to the truth table is shown on the
right. Four cells contain a ‘1’ term for the output variable ‘x’, in agreement with the truth
table. We can draw three loops as follows:
• Light-gray loop around the term A * B * C, and the term A * B * C
• Medium-gray loop around the term A * B * C, and the term A* B * C
• Dark-gray loop around the term A * B * C, and the term A * B * C
We can thus remove the variable A from the light-gray loop, B from the medium-gray loop and
C from the dark-gray loop, respectively. The resulting equation: x =
B * C + A * B + A * C is the
simplified version of our original equation.
Figure 3.5: Translating a truth table to a K-map. Each cell of the
K-map represents one combination of the independent variables.
A ‘1’ is placed in each cell that contains a 1 in the corresponding
row of the truth table.
AB AB AB AB
C
C
1 1 1
1
A B C
x
0 0 0
1
1 0 0
1
0 1 0
0
1 1 0 1
0 0 1
0
1 0 1
1
0 1 1 0
1 1 1 0
x = B*C + A*B + A*C
Simplified equation
Simplified equation
Chapter 3
58
Note that in this example, the cell corresponding to the state of the input variables A * B * C
is common to the three loops and it appears in each loop. However, each of the loops also contains
one variable not contained in any other loop, so we can draw these three loops.
Before we go any further, it is reasonable to see if we could have achieved the same simplified
logical equation by just doing the algebra the way George Boole intended us to. Below are the
algebraic steps to simplifying the logical equation:
Step 1 x = A * B * C + A * B * C + A * B * C + A * B * C From the truth table
Step 2 x = A * B * C + A * B * C + A * B * (C + C ) First Law of Distribution
Step 3 x = A * B * C + A * B * C + A * B First Law of Complementation
Step 4 x = A * B * C + A * (B * C + B) First Law of Distribution
Step 5 x = A * B * C + A * [(B + C ) * (B + B)] Second Law of Distribution
Step 6 x = A * B * C + A * (B + C ) Law of Complementation
Step 7 x = A * B * C + A * B + A * C First Law of Distribution
Step 8 x = B * (A * C + A ) + A * C First Law of Distribution
Step 9 x = B * [(A + A) * (C + A)] + A* C Second Law of Distribution
Step 10 x = B * (C + A) + A * C First Law of Distribution
Step 11 x = B * C + B * A + A * C First Law of Distribution
Let’s consider a slightly more involved
example. Figure 3.6 shows a 4-input variable
problem with two dependent variables for the
outputs. Again, this is a made-up example,
as far as I know it doesn’t represent a real
system. If we were actually trying to build a
digital system, then the systems requirements
would dictate the state of each output variable
for a given set of input variables.
If you consider the K-map for variable ‘
X’
you see that we are able to construct two
simplifying loops. The medium-gray loop
folds around the edges of the map because
those edges are adjacent. In a similar way, the
dark-gray loop folds around the top and bot-
tom edges of the map. You might wonder why
we couldn’t also make a loop with the terms
A * B *
C * D and A * B * C * D.
Figure 3.6: Simplifying a 4-variable truth table
with two dependent variables.
A B C D X Y
0 0 0 0 1 0
1 0 0 0 0 0
0 1 0 0 1 1
1 1 0 0 1 0
0 0 1 0 1 0
1 0 1 0 0 0
0 1 1 0 1 0
1 1 1 0 0 0
0 0 0 1 0 1
1 0 0 1 0 0
0 1 0 1 0 0
1 1 0 1 1 0
0 0 1 1 0 1
1 0 1 1 0 1
0 1 1 1 0 1
1 1 1 1 0 1
K-map for X
K-map for Y
X = A*D + A*B*C
Simplified equations
Y = C*D + A*B*D + A*B*C*D
1
1
1
1
1
1
1
1111
1
CD
CD
CD
CD
CD
CD
CD
CD
AB
AB
AB AB
AB
AB
AB AB
Introduction to Asynchronous Logic
59
We can’t make another loop because the both terms are already in other loops. In order to make a
third loop we would need to have one or more terms not contained in any other loop.
Using the K-map does not always result in the most simplification possible, but it comes pretty
close. This is particularly true of K-maps larger than four variables. In fact, the five variable
K-map should technically be represented as two four variable K-maps, one on top of the other.
Remember that you may always try to use Boolean algebra and DeMorgan’s Theorems to simplify
your equations to their final form.
As a final step, let’s convert our simplified logical equations to a real hardware gate implemen
-
tation. We’ll take the logical equation that we simplified in Figure 3.5 and convert it to its gate
equivalent circuit. Figure 3.7 shows the implementation of the design using NOT, AND and OR
gates. This is not the way that you “must” design it. It is just a convenient way to show the hard
-
ware design. The 3 input signals are shown along the top left of the figure. For each input variable,
we also add a NOT gate because it will be convenient to assume that we’ll need to use either the
variable or its complement in the circuit design.
Also note that we use a black dot to indicate a point where two separate wires are physically
connected together. We need to do this so we can differentiate wires that cross each other in our
drawing, but are not connected together, from those wires that are connected together. The black
dot serves that purpose for us.
The circuit in Figure 3.7 also shows the input variables, their complements, the combinatorial
terms in the AND gate and the aggregation of the combinatorial terms using the OR gate. Notice
that we needed three, 2-input AND gates and one, 3-input OR gate to implement the design. If
we had a more complex problem we might choose to use AND and OR gates with more available
inputs or use several levels of gates with fewer inputs. Thus, we could create an equivalent 7-input
AND gate from three, 3-input AND gates.
A A
OR
B B
C C
AND
AN
D
AN
D
NO
T
NO
T
NO
T
B*
C
A*
B
A*
C
x = B*C + A*B + A*C
x = B*C + A*B + A*C
X
Figure 3.7: Circuit implementation of the logical equation X = B * C + A * B + A * C.
Chapter 3
60
Does the circuit of Figure 3.7 actually agree with the original design of our truth table? It might be
a good idea to do a quick check, just to build our confidence for the complexities to come. Let’s do
the first three terms of the truth table and we’ll leave it as an exercise for you to do the remaining
five terms.
1. Term 1: A = 0, B = 0, C = 0. Here the NOT gates for the variables B and C invert the
inputs and feed the values B = 1 and C = 1 to the first AND gate. Since both inputs are ‘1’,
the output of this AND gate is 1. The output of this AND gate is the input to the OR gate.
Since one of the inputs is ‘1’, the output is also ‘1’ and x = 1, just as required by the truth
table.
2. Term 2: A = 1, B = 0, C = 0. According to the truth table, ‘x’ should also equal ‘1’ for this
situation. Since the first AND gate does not require variable A as an input, variable B and
C are unchanged, so we also get x = 1 for this situation.
3. Term 3: A = 0, B = 1, C = 0. The first AND gate now gives us a ‘0’ because the comple-
ment of B = 1 is B = 0. Thus, 0 AND 1 = 0. The second AND gate has A and B as its
inputs. Since this condition has A = 0 and
B = 0 as its inputs, it is also ‘0’. The third AND
gate has A = 0 and
C = 1 as its inputs. Again, it results in an output of ‘0’. Since all three
inputs to the OR gate are ‘0’, x = 0.
Before we leave the topic of logic gates and begin to consider systems that depend upon a synchro
-
nization or clock signal, let’s examine how else we might build a digital system. The truth table is
an interesting format because it looks very close in form to how a memory is formed. Figure 3.8
is the truth table example from Figure 3.3 but shown as if it was a memory device. We have four
independent variables and two dependent variables.
Figure 3.8: Converting a truth table to a memory image. The independent variables, A through D
provides the address to the memory. The two dependent variables, E and F, are represented by the
data in the memory cell corresponding to the address of the memory (row of the truth table).
A B C D E F
0 0 0 0 0 1
1 0 0 0 0 0
0 1 0 0 0 0
1 1 0 0 0 0
0 0 1 0 1 0
1 0 1 0 1 0
0 1 1 0 0 1
1 1 1 0 0 0
0 0 0 1 0 0
1 0 0 1 0 0
0 1 0 1 0 0
1 1 0 1 0 0
0 0 1 1 0 0
1 0 1 1 0 0
0 1 1 1 0 0
1 1 1 1 1 0
A
B
C
D
E
F
32 Bit
Memory
Let’s consider the implications of what we just did. Here we can imagine that we use a real
memory device and fill it so that when we give it the appropriate address bit values (in this case,
the appropriate combination of input variables A through D) the data out from the memory (the
Introduction to Asynchronous Logic
61
dependent variables E and F) is the circuit behavior that we have assigned to the truth table. Thus,
we can implement logical systems either by creating an electrical circuit design using logical
gates, or we can create a logically equivalent design by using a memory device to directly imple
-
ment the contents of the truth table. In the case of memory as logic, we don’t do any logical
simplification as we would with a gate circuit design. Also, we might not get the speed that we
need using one or the other method.
To make this point even
stronger, let’s redraw
Figure 3.8 as Figure 3.9.
The only difference is
that we’ll represent it as a
real memory device. The
independent variables (
A
through
D in Figure 3.3)
are represented as ad
-
dress bits, A0–A3, to the
memory device. The de
-
pendent variables (
E and
F in Figure 3.3) are now
the data bits stored in the
various pairs of memory
locations.
Thus, our memory needs
to be able to hold a total
of 32 bits, 16 bits for each
of the two dependent
variables. Each bit rep
-
resents the state of that
variable for the combina
-
tion of states of the input
variables forming the
address of the memory cell.
Figures 3.8 and 3.9 represent an alternative way of creating a hardware implementation of the
logical design. In the prior example, we used the laws of Boolean algebra and the K-maps to build
a simplified set of logical equations that we could then implement as a combination of logic gates
(also called combinatorial logic). Figure 3.8 shows that we could simply take the truth table, as is,
and fill up a memory chip with all the possibilities and be done with it. It turns out that both meth
-
ods are equally valid and are used where it’s most appropriate. The use of memory as logic, called
microcode, forms the basis for much of the control circuitry within a modern digital computer.
We’ll revisit this concept in a later chapter when we discuss state machines.
Figure 3.9: Converting a truth table to a memory image. The
independent variables, A through D provides the address to the memory.
The two dependent variables, E and F, are represented by the data in
the memory cell corresponding to the address of the memory (row of
the truth table).
0 0 0 0
0 0 0 1
0 0 1 0
0 0 1 1
0 1 0 0
0 1 0 1
0 1 1 0
0 1 1 1
1 0 0 0
1 0 0 1
1 0 1 0
1 0 1 1
1 1 0 0
1 1 0 1
1 1 1 0
1 1 1 1
A0
A1
A2
A3
DATA BIT 1
DATA BIT
0
0
0
0
0
1
1
0
0
0
0
0
0
0
0
0
1
1
0
0
0
0
0
1
0
0
0
0
0
0
0
0
0
Chapter 3
62
Clocks and Pulses
In Chapter 2, we first saw digital signals as waveforms. That is, we represented the logical signals
as values that change over time. The waveform is a strip chart recorder view of the digital signal.
The simplest digital signal that we might want to consider is the simple positive pulse of Figure
3.10, which schematically shows a single positive pulse with a pulse height of about 3 volts.
We might stop for a moment and ask, “What’s a pulse?” You probably know the medical term for
your “pulse.” You feel, or should feel a pressure surge in your veins every time your heart beats.
What you are feeling is the blood creating a pressure pulse as it flows because the pumping is dis
-
continuous, and happens in discrete pulses of blood. You also can see this when you get an EKG
done on your heart and you see the characteristic spikes of the electrical signals around your heart
(Figure 3.11).
What is characteristic of any
pulse is that the system goes
from a relaxed state, such as
low pressure, to an excited
state (blood surge) and then
back again. Electrically,
we can describe a pulse as
a signal going from low to
high and then back to low, or
vice versa. In other words,
we could have a pulse such
that the system goes from
asserted, to nonasserted, and then back to an asserted state. We call a pulse that goes from low to
high and back to low a
positive pulse a pulse that goes from high to low and back to high a nega-
tive pulse.
The pulse in Figure 3.10 is positive because
it starts from the LOW state, goes HIGH, and
then returns to the LOW state when it is com
-
pleted. In this example, the width of the pulse,
or pulse width, is a measure of the amount of
time that the pulse exists, might be something
like 50 nanoseconds (often abbreviated as
50 ns), or 50 billionths of a second. The pulse
width is measure at a point mid way between
the base level of the pulse and its nominal
height. Thus, for a pulse that is 3 volts high,
the pulse width would be measured at the 1.5
volts portion of the waveform.
Figure 3.12 shows a, more or less, “real pulse.”
The real pulse is what you might see if you had
Figure 3.10: Typical waveform for a positive pulse, approximately
3 volts high.
Voltage (volts)
Pulse Width
0
3
Time
(nsec)
Figure 3.11: Part of an EKG showing the
characteristics pulses of the electrical signals
around the heart.
Introduction to Asynchronous Logic
63
a really fast stopwatch, a really fast voltmeter and you could scribble like crazy (remember, this
is a thought experiment). Real people, use analytical equipment called
oscilloscopes to see this
waveform. We’ll look at some real oscilloscope waveforms later in the chapter. Notice how the
gray line, which represents the change in voltage of the pulse over time, has some slope to it as it
rises and falls. This is because the pulse can’t change state infinitely rapidly. It takes some time for
the voltage to rise to a 1, or fall back to 0. We call these times the
rise time and fall time, respec-
tively. Technically, for reasons that we don’t need to consider, the rise and fall times are measure at
the 10% and 90% points of the voltage.
Figure 3.12 shows how the pulse
might be seen on the screen of
an oscilloscope. The horizontal
axis displays the elapsed time in
some convenient units (nanosec
-
onds, in this example) and the
vertical axis displays how the
voltage signal changes with time.
Figure 3.13 shows an actual
rise time measurement from an
R&D laboratory oscilloscope.
The oscilloscope can perform a
number of automatic measure-
ments, such as rise time, fall time,
pulse width, pulse height, frequency
and period. The
oscilloscope circuitry
automatically analyzes the shape of
the pulse waveform and locates the
10% and 90% points on the pulse and
then calculates the time difference
between those two points.
Before we move on to consider
clocks, we should discuss one last
point about gates. We’ve previously
defined the propagation delay
of a
gate as time delay from a change
at the input of the gate to the corre
-
sponding change at the output of the
gate. Let’s see what an actual propa
-
gation delay measurement might look
like on our lab oscilloscope. Figure
3.14 shows us what a propagation delay measurement might look like for a NOT gate. We connect
our oscilloscope probes to the input and output of the NOT gate as shown in the figure. To make
Figure 3.12: A positive pulse as it might appear on the display of
an oscilloscope.
Time (nsec)
2
0
Voltage (volts)
0 10 20 30
Figure 3.13: Oscilloscope rise time measurement. The
vertical axis is 1 volt per division and the horizontal axis is
10 nanoseconds per division.
Chapter 3
64
this measurement we
start our oscilloscope
trace a few nanosec
-
onds before the input
signal to the gate (the
falling edge) occurs.
This oscilloscope
can simultaneously
display the logic state
of both the input and
output waveforms
so we see the input
signal going low and
then slightly later in
time, the output signal
goes high. In fact, if
you look closely at
the oscilloscope display, you’ll see that the time interval between the falling edge of the input and
the riding edge of the output is 12.60 nanoseconds.
To this point, we’ve considered pulses as single events. However, just like the EKG shows, your
heart pumps continuously, so the EKG displays a string of pulses.
In Figure 3.15, we once again go back to the idealized view of the waveform. Note the absence of
any slope to the rising and falling edges of the waveform. We consider these pulses to have infi
-
nitely fast transitions from LOW to HIGH and HIGH to LOW. It doesn’t hurt anything to make
this assumption and it makes our diagrams easier to analyze and understand.
We refer to this continuous stream of
pulses, such as the waveform shown
in Figure 3.15, as a clock. The clock
is not the same as the clock in your
computer that gives you the time of
day. The clock that we are concerned
with in this context is a continuous
stream of tightly regulated pulses,
usually controlled by crystal oscilla-
tors. The crystals have the property
that they can create a tuned circuit
that resonates, or oscillates, at a very
predictable and stable frequency. For
example, even the cheapest digital
wristwatch can keep time to better
than 1 minute per month because it
Figure 3.14: Oscilloscope trace of a propagation delay measurement. The
upper trace represents a measurement probe on the input side of the NOT
gate and the lower trace shows the output of the gate. The display shows that
the output goes high 10.2 nanoseconds after the input goes low.
Waveform A: Duty cycle = 50%
Waveform
B: Duty cycle < 50%
t
PL
t
PH
t
cycle
Figure 3.15: Examples of clock waveforms. When the pulse
width of the high portion of the waveform equals the pulse
width of the low portion of the waveform (waveform A), we
have a 50% duty cycle. Waveform B has a duty cycle below
50%. The time difference between the two black dots on
waveform B represent the period of the waveform.
Introduction to Asynchronous Logic
65
uses a crystal that oscillates at approximately 32K Hz. We use the term Hertz, to represent cycles
per second, or the oscillating frequency of a clock stream. The symbol is Hz. The unit, Hertz, was
named in honor of the German physicist, Heinrich Rudolf Hertz (1857–1894).
It’s easy to get lost in the minutia of clock and waveforms, but let’s stop for a second and consider
the question, “What really is a clock, anyhow?”
A clock is a constant stream of pulses that is usually quite accurately spaced in time. Even an inex
-
pensive digital watch only gains or loses a few seconds a month. Considering that its pulse is about
32 thousand beats per second, that’s pretty impressive. We won’t spend any time discussing how
such accurate time signals are generated because we don’t want to offend the Electrical Engineers,
but we will try to understand what the clock is doing in our system.
Imagine that you are looking at the pendulum of an impressive old grandfather’s clock. If you
could start a stopwatch at the point where the pendulum just stops at one end of its travel and stop
the watch when it travels to the side and returns, you would measure the period of the pendulum.
The grandfather’s clock uses the fact that the period of the pendulum’s swing varies very little
from cycle to cycle to advance the clock’s time through a mechanism of gears. The point was to
show you that in real systems then pendulum provides us with an accurate synchronization mecha
-
nism that we can use to drive the clock’s internal timekeeping mechanism. Also, the action of the
pendulum provides the source of synchronization for the entire clock. Each time it swings back
and forth, it advances the gears that tell time.
Suppose it takes the pendulum 5 seconds to go from one extreme of its travel to the other and back
again. This is 1 cycle every 5 seconds, so the period is 5 seconds. The number of cycles in one
second is just the reciprocal of the period, or 0.2 Hz.
Within our digital systems, we use a clock signal to provide the same synchronization mechanism.
In most computer systems, a single clock signal is distributed throughout the circuitry to provide
one accurate timing source that all internal operations may be synchronized with. When you go
into your local computer store to buy the latest PC, the salesperson will try to convince you to buy
a PC with a 3.2 Gigahertz clock in order for you to get the maximum gaming experience. What are
you really being sold? Just that this super PC has a faster clock. This means more things happen in
one second, so it runs faster.
You’re probably already familiar with the term “Hertz” and the abbreviation “Hz” if you’ve ever
purchased a PC. The salesperson told you that this PC or that PC was a 3.0 “gigahertz” machine,
and it was clearly better than your old 500 “megahertz” boat anchor. What you now understand
is that the clock frequency of your old computer was 500 million cycles per second, or 500 MHz.
The computer that is only $1,000 away from being in the trunk of your car has a clock frequency
of 3 billion cycles per second, or 3 GHz. Since one billion is 1000 million, this is the same as
saying that the new computer has a clock frequency of 3000 MHz, or roughly six times the clock
speed of the old one.
What are we trying to show in Figure 3.16? Let’s try to imagine that we’re sitting on the clock
signal input on a typical computer or microprocessor. You’ve got a really fast Radio Shack®
voltmeter and you’re measuring the voltage (logic levels) at the clock input. The clock voltage is
Chapter 3
66
low for a while (logic level 0), then it goes high for a while (logic level 1) and then low again, over
and over. Each low-time interval is exactly the same as the previous one. Each high-time inter
-
val is also the same as every other one. The transitions from low to high and high to low are very
fast and also equal. Thus, the time period for one complete cycle (low to high and back to low) is
extremely repeatable.
Figure 3.16 is an actual oscilloscope display of a 2.5 MHz clock signal. Notice that the clock
waveform of the figure is not as “clean” as our idealized waveforms, but it isn’t too far off. The
rising and falling edges are clearly visible in this view. We can also learn a valuable lesson from
looking at the figure. Even though the clock waveform isn’t as pretty as the idealized waveform, it
functions correctly in our circuit. The reason is simple. In our digital world of 1’s and 0’s, nothing
else counts. As long as the signal is less that than the zero threshold or greater than the threshold
for a 1, the voltage will be properly interpreted.
Figure 3.16: Oscilloscope image of a 2.5 MHz clock. Each vertical unit represents 1 volt and
each horizontal unit represents 100 nanoseconds. Notice that as long as the signal is above
the logic 1 threshold, or below the logic 0 threshold, it will be interpreted correctly.
Logic 0
Logic 1
Not Defined
1V
Let’s define some terms:
• Frequency: The number of clock pulses per unit time, usually seconds. The frequency is
measured in Hertz, or Hz. One Hz is the same as one clock cycle per second.
• Period: The inverse of the frequency. It is the amount of time between two equal points
on adjacent waveforms. The two black dots on waveform
B in Figure 3.15 represent the
period of the waveform, or the time for one cycle of the wave, t
cycle
. The frequency of the
clock equals the inverse of the period. A clock waveform with a period of one second has
a frequency of 1 Hz.
• Duty cycle: Ratio of the amount of time the clock is HIGH to the period. A 50% duty
cycle means that the clock is high for exactly ½ of the period, or the amount of time the
clock is HIGH equals the amount of time the clock is LOW. We can also use the equation:
Duty cycle = (t
PH
/ (t
PH
+ t
PL
)) × 100%.