SAS/ETS 9.22 User''''s Guide 166 ppt
Bạn đang xem bản rút gọn của tài liệu. Xem và tải ngay bản đầy đủ của tài liệu tại đây (461.11 KB, 10 trang )
1642 ✦ Chapter 23: The SIMILARITY Procedure
Output 23.2.8 Path Distance Plot
Example 23.2: Similarity Analysis ✦ 1643
Output 23.2.9 Path Distance Histogram
1644 ✦ Chapter 23: The SIMILARITY Procedure
Output 23.2.10 Path Relative Distance Plot
Example 23.2: Similarity Analysis ✦ 1645
Output 23.2.11 Path Relative Distance Histogram
Output 23.2.12 Path Limits
Path Limits
Specified Specified Minimum Maximum
Limit Absolute Percentage Allowed Allowed Applied
Compression None None 2 9 9
Expansion None None 0 7 7
1646 ✦ Chapter 23: The SIMILARITY Procedure
Output 23.2.13 Path Statistics
Path Statistics
Path Input
Path Input Target Maximum Maximum
Path Number Percent Percent Percent Maximum Percent Percent
Missing Map 0 0.000% 0.000% 0.000% 0 0.000% 0.000%
Direct Maps 6 50.00% 75.00% 60.00% 2 16.67% 25.00%
Compression 4 33.33% 50.00% 40.00% 1 8.333% 12.50%
Expansion 2 16.67% 25.00% 20.00% 2 16.67% 25.00%
Warps 6 50.00% 75.00% 60.00% 2 16.67% 25.00%
Path Statistics
Target
Maximum
Path Percent
Missing Map 0.000%
Direct Maps 20.00%
Compression 10.00%
Expansion 20.00%
Warps 20.00%
Example 23.2: Similarity Analysis ✦ 1647
Output 23.2.14 Cost Plot
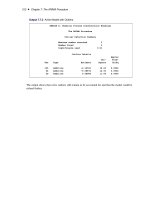
Output 23.2.15 Cost Statistics
Cost Statistics
Standard
Cost Number Total Average Deviation Minimum Maximum
Absolute 12 15.00000 1.250000 1.138180 0 3.000000
Relative 12 2.25844 0.188203 0.160922 0 0.500000
Cost Statistics
Input Target Minimum Maximum
Cost Mean Mean Path Mean Path Mean
Absolute 1.875000 1.500000 1.875000 0.8823529
Relative 0.282305 0.225844 0.282305 0.1328495
Relative Costs based on Target Sequence values
1648 ✦ Chapter 23: The SIMILARITY Procedure
Output 23.2.16 Time Warp Plot
Example 23.2: Similarity Analysis ✦ 1649
Output 23.2.17 Time Warp Scaled Plot
The following statements repeat the preceding similarity analysis on the example data set with
warping limits:
ods graphics on;
proc similarity data=test out=_null_
print=all plot=all;
input x;
target y / measure=absdev
compress=(localabs=2)
expand=(localabs=2);
run;
The COMPRESS=(LOCALABS=2) option limits local absolute compression to 2. The EX-
PAND=(LOCALABS=2) option limits local absolute expansion to 2.
1650 ✦ Chapter 23: The SIMILARITY Procedure
Output 23.2.18 Path Plot with Warping Limits
Output 23.2.19 Warped Path Limits
Path Limits
Specified Specified Minimum Maximum
Limit Absolute Percentage Allowed Allowed Applied
Compression 2 None 2 9 2
Expansion 2 None 0 7 2
Example 23.2: Similarity Analysis ✦ 1651
Output 23.2.20 Cost Plot with Warping Limits
The following statements repeat the preceding similarity analysis on the example data set but store
the results in output data sets:
proc similarity data=test out=series
outsequence=sequences outpath=path outsum=summary;
input x;
target y / measure=absdev
compress=(localabs=2)
expand=(localabs=2);
run;
The OUT=SERIES, OUTSEQUENCE=SEQUENCES, OUTPATH=PATH, and OUT-
SUM=SUMMARY options specify that the output time series, time sequences, path analysis,
and summary data sets be created, respectively.