Models in Hardware Testing- P8 ppt
Bạn đang xem bản rút gọn của tài liệu. Xem và tải ngay bản đầy đủ của tài liệu tại đây (749.52 KB, 30 trang )
7 Models for Power-Aware Testing 203
one scan chain segment, all other segments can have their clocks disabled. When
one scan chain segment has been completely loaded/unloaded, then the next scan
chain segment is activated.
This technique requires clock gating and the use of bypass multiplexers for
segment-wise access. It drastically reduces shift power (both average and peak) dis-
sipated in the combinational logic. It can be applied to circuits with multiple scan
chains (e.g. STUMPS architectures), even when test compression is used. It has no
impact on the test application time and the fault coverage, and requires minimal
modifications to the ATPG flow.
The main drawback of scan segmentation is that capture power remains a con-
cern that needs to be addressed. This problem can be partially solved by creating a
data dependency graph based on the circuit structure and identifying the strongly
connected components (SCC). Flip-flops in an SCC must load responses at the
same time to avoid capture violations. This way, capture power can be minimized
(Rosinger et al. 2004).
Low power scan partitioning has been shown to be feasible on commercial de-
signs such as the CELL processor (Zoellin et al. 2006).
7.5.2 Staggered Clocking
Various staggered clock schemes can be used to reduce test power consumption
(Sankaralingam and Touba 2003; Lee et al. 2000; Huang and Lee 2001). Staggering
the clock during shift or capture achieves power savings without significantly af-
fecting test application time. Staggering can be achieved by ensuring that the clocks
to different scan flip-flops (or chains) have different duty cycles or different phases,
thereby reducing the number of simultaneous transitions. The biggest challenge to
these techniques is its implications on the clock generation, which is a sensitive
aspect of chip design. In this section, we describe a staggering clocking scheme
proposed in Bonhomme et al. (2001) that can achieve significant power reduction
with a very low impact and cost on the clock generation.
7.5.2.1 Basic Principle
The technique proposed in Bonhomme et al. (2001) is based on reducing the oper-
ating frequency of the scan cells during scan shifting without modifying the total
test time. For this purpose, a clock whose speed is half of the normal (functional)
clock speed is used to activate one half of the scan cells (referred to as “Scan Cells
A” i n Fig. 7.11) during one clock cycle of the scan operation. During the next clock
cycle, the second half of the scan cells (referred to as “Scan Cells B”) is activated
by another clock whose speed is also half of the normal speed. The two clocks are
synchronous with the system clock and have the same period during shift operation
except that they are shifted in time. During capture operation, the two clocks operate
204 P. Girard and H J. Wunderlich
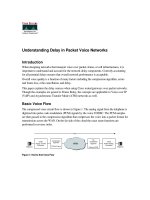
Fig. 7.11 Staggered clocking
scheme
CLK/2
CLK/2
s
SE
Combinational Logic
Scan Cells A Scan Cells B
SI
SO
ComOut
1
0
“CLK/2”
Clock
Tree
Clock
Tree
CUT
CLK
“CLK/2
σ
”
Test
Clock
Module
Scan
Cells
A
Scan
Cells
B
ATE
ATE
SE
ComOut
Fig. 7.12 The complete structure
as the system clock. The serial outputs of the two groups of scan cells are connected
to a multiplexer that drives either the content of Scan Cells A or the content of Scan
Cells B to the ATE during scan operations. As values coming from the two groups
of scan cells must be scanned out alternatively, the multiplexer has to switch at each
clock cycle of the scan operations.
With such a clock scheme, only half of the scan cells may toggle at each clock
cycle (despite the fact that a shift operation is performed at each clock cycle of
the whole scan process). Therefore, the use of this scheme lowers the transition
density in the combinationallogic (logic power), the scan chain (scan power) and the
clock tree feeding the scan chain (clock power) during shift operation. Both average
power consumption and peak power consumption are significantly minimized in all
of these structures. Moreover, the total energy consumption is also reduced as the
test length with the staggering clocking scheme is exactly the same as the test length
with a conventional scan design to reach the same stuck-at fault coverage.
7.5.2.2 Design of the Staggered Clock Scheme
The complete low power scan structure is depicted in Fig. 7.12. This structure is
first composed by a test clock module which provides test clock signals CLK/2 and
CLK=2¢ from the system clock CLK used in the normal mode. Signal SE allows to
7 Models for Power-Aware Testing 205
switching from the scan mode to the normal or capture mode. Signal ComOut con-
trols the MUX allowing to alternatively outputting test responses from Scan Cells A
and Scan Cells B during scan operations. As two different clock signals are needed
for the two groups of scan cells, two clock trees are used. These clock trees are
carefully designed so as to correctly balance the clock signals feeding each group
of scan cells.
The test clock module which provides the control signal ComOut and the test
clock signals CLK/2 and CLK=2¢ from the system clock CLK is given in Fig. 7.13.
This module is formed by a single D-type flip-flop and six logic gates, and allows
to generating non-overlapping test clock signals. This structure is very simple and
requires a small area overhead. Moreover, it is designed with minimum impact on
performance and timing. In fact, some of the already existing driving buffers of the
clock tree have to be transformed into AND gates as seen in Fig. 7.13. These gates
mask each second phase of the fast system clock during shift operations.
As two different clock signals are used by the two groups of scan cells, the clock
tree feeding these scan cells has to be modified. For this purpose, two clock trees
are implemented, each with a clock speed which is half of the normal speed. Let us
assume a scan chain composed ofsix scan cells. The corresponding clock trees in the
test mode are depicted in Fig. 7.14. Each of them has a fanout of 3 and is composed
of a single buffer. During the normal mode of operation, the clock tree feeding the
input register at the normal speed can therefore be easily reconstructed as shown in
D Q
CLK
Q
ScanENA
CLK.ScanENA + CLK/2.ScanENA
ComOut
CLK.ScanENA + CLK/2
σ
.ScanENA
Fig. 7.13 Test clock module
CLK/2
Scan Segment A
CLK
CLK/2
σ
Input
Register
Test Mode
Normal Mode
a
b
Scan Segment B
CUT
CUT
Fig. 7.14 The clock tree in test mode (a) and normal mode (b)
206 P. Girard and H J. Wunderlich
Fig. 7.14. Note that using two clock trees driven by a slower clock (rather than a
single one) allows to further drastically reduce the clock power during scan testing.
The area overhead, which is due to the test clock module and the additional rout-
ing, is negligible. The proposed scheme does not require any further circuit design
modification and is very easy to implement. Therefore, it has a low impact on the
system design time and has nearly no penalty on the circuit performance. Further
details about this staggered clock scheme can be found in Bonhomme et al. 2001;
Girard et al. 2001).
7.6 Power-Aware Test Data Compression
Test Data Compression (TDC) is an efficient solution to reduce test data volume. It
involves encoding a test set so as to reduce its size. By using this reduced set of test
data, the ATE limitations, i.e., tester storage memory and bandwidth gap between
the ATE and the CUT, may be overcome. During test application, a small on-chip
decoder is used to decompress test data received from the ATE as it is fed into the
scan chains.
Although reducing test data volume and test application time, TDC increases
test power during scan testing. To address this issue, several techniques have been
proposed so far to simultaneously reduce test data volume and test power during
scan testing. In this section, we first give an overview of power-aware TDC solutions
proposed so far. Next, we present one of these solutions based on selective encoding
of scan slices.
7.6.1 Overview of Power-Aware TDC Solutions
As proposed in Wang et al. (2006), power-aware TDC techniques can be classified
into the three following categories: code-based schemes, linear-decompression-
based schemes, and broadcast-scan-based schemes.
7.6.1.1 Code-Based Schemes
The goal of power-aware code-based TDC is to use data compression codes to en-
code the test cubes of a test set so that both switching activity generated in the scan
chains after on-chip decompression and test data volume can be minimized. In the
approach presented in Chandra and Chakrabarty (2001), test cubes generated by an
ATPG are encoded using Golomb codes. All don’t care bits of the test cubes are
filled with 0 and Golomb coding is used to encode runs of 0’s. For example, to
encode the test cube “X0X10XX0XX1”, the Xs are filled with 0 and the Golomb
coding provides the compressed data (codeword) “0111010”. More details about
7 Models for Power-Aware Testing 207
Golomb codes can be found in Wang et al. (2006). Golomb coding efficiently com-
presses test data, and the filling of all don’t cares with 0 reduces the number of
transitions during scan-in, thus significantly reducing shift power. One limitation is
that it is very inefficient for runs of 1’s. In fact, the test storage can even increase for
test cubes that have many runs of 1’s. Moreover, implementing this test compression
scheme requires a synchronization signal between the ATE and the CUT as the size
of the codeword is of variable length.
To address the above limitations, an alternating run-length coding scheme was
proposed in Chandra and Chakrabarty (2002). While a Golomb coding only encodes
runs of 0’s, an alternating run-length code can encode both runs of 0’s and runs of
1’s. The remaining issue in this case is that the coding becomes inefficient when a
pattern with short runs of 0’s or 1’s has to be encoded. Another technique based on
Golomb coding is proposed in Rosinger et al. (2001) but uses a MT filling of all
don’t care bits rather than a 0-filling at the beginning of the process. The Golomb
coding is then used to encode runs of 0’s, and a modified encoding is further used
to reduce the size of the codeword.
7.6.1.2 Linear-Decompression-Based Schemes
Linear decompressors are made of XOR gates and flip-flops (see Wang et al. (2006)
for a comprehensive description) and can be used to expand data coming from the
tester to fed the scan chains during test application.
When combined with LFSR reseeding, linear decompression can be view as an
efficient solution to reduce data volume and bandwidth. The basic idea in LFSR
reseeding is to generate deterministic test cubes by expanding seeds. Given a deter-
ministic test cube, a corresponding seed can be computed by solving a set of linear
equations – one for each specified bit – based on the feedback polynomial of the
LFSR. Since typically 1% to 5% of the bits in a test cube are care bits, the size
of the corresponding seed (stored in the tester memory) will be very low (much
smaller than the size of the test cube). Consequently, reseeding can significantly
reduce test data volume and bandwidth. Unfortunately, it is not as good for power
consumption because the don’t care bits in each expanded test cube are filled with
pseudo-random values thereby resulting in excessive switching activity during scan
shifting. To solve this problem, Lee and Touba (2004) takes advantage of the fact
that the number of transitions in a test cube is always less than its number of spec-
ified bits. A transition in a test cube is defined as a specified 0 (1) followed by a
specified 1 (0) with possible X’s between them, e.g., X10XXX or XX0X1X. Thus,
rather than using reseeding to directly encode the specified bits as in conventional
LFSR reseeding, the proposed encoding scheme divides each test cube into blocks
and only uses reseeding to encode blocks that contain transitions. Other blocks are
replaced by a constant value which is fed directly into scan chains at the expense of
extra hardware.
Unlike reseeding-based compression schemes, the solution proposed in Czysz
et al. (2007) uses the Embedded Deterministic Test (EDT) environment (Rajski
208 P. Girard and H J. Wunderlich
et al. 2004) to decompress the deterministic test cubes. However, rather than doing
random fill of each expanded test cube, the proposed scheme pushes the decompres-
sor into the self-loop state during encoding for low power fill.
7.6.1.3 Broadcast-Scan-Based Schemes
These power-aware TDC schemes are based on broadcasting the same value to mul-
tiple scan chains. Using the same value reduces the number of bits to be stored in
the tester memory and the number of transitions generated during scan shifting. The
main challenge is to achieve this goal without sacrificing the fault coverage and the
test time.
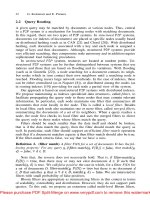
The segmented addressable scan architecture presented in Fig. 7.15 is an efficient
power-aware broadcast-scan-based TDC solution (Al-Yamani et al. 2005). Each
scan chain in this architecture is split into multiple scan segments thus allowing
the same data to be loaded simultaneously into multiple segments when compati-
bility exists. The compatible segments are loaded in parallel using a multiple-hot
decoder. Test power is reduced as segments which are incompatible within a given
round, i.e., during the time needed to upload a given test pattern, are not clocked.
Power-aware broadcast-scan-based TDC can also be achieved by using the
progressive random access scan (PRAS) architecture proposed in Baik and
Saluja (2005) that allows individual accessibility to each scan cell. In this ar-
chitecture, scan cells are configured as an SRAM-like grid structure using specific
PRAS scan cells and some additional peripheral and test control logic. Providing
such accessibility to every scan cell eliminates unnecessary switching activity dur-
ing scan, while reducing test time and data volume by updating only a small fraction
of scan-cells throughout the test application.
Clock Tree
Segment 1
Output Compressort
Segment 2
Segment M
•
•
•
Segment
Address
Multi-Hot Decoder
Tester Channel or
Input Decompressor
Fig. 7.15 The segmented addressable scan architecture
7 Models for Power-Aware Testing 209
7.6.2 Power-Aware TDC Using Selective Encoding of Scan Slices
The section describes an efficient code-based TDC solution initially proposed in
Badereddine et al. (2008) to simultaneously address test data volume and test power
reduction during scan testing of embedded Intellectual Property (IP) cores.
7.6.2.1 TDC Using Selective Encoding of Scan Slices
The method starts by generating a test sequence with a conventional ATPG us-
ing the non-random-fill option for don’t-care bits. Then, each test pattern of the
test sequence is formatted into scan slices. Each scan slice that is fed to the in-
ternal scan chains is encoded as a series of c-bit slice-codes, where c D K C 2,
K D Œlog 2.N C 1/ with N being the number of internal scan chains of the IP
core. As shown in Fig. 7.16, the first two bits of a slice-code form the control-code
that determines how the following K bits, referred to as the data-code, have to be
interpreted.
This approach only encodes a subset of the specified bits in a slice. First, the
encoding procedure examines the slice and determines the number of 0- and 1-
valued bits. If there are more 1s (0s) than 0s (1s), then all don’t-care bits in this slice
are mapped to 1 (0), and only 0s (1s) are encoded. The 0s (1s) are referred to as
target-symbols and are encoded into data-codes in two modes: single-bit-mode and
group-copy-mode.
In the single-bit-mode, each bit in a slice is indexed from 0 to N –1.Atarget-
symbol is represented by a data-code that takes the value of its index. For example,
to encode the slice “XXX10000”, the Xs are mapped to 0 and the only target-symbol
1 at bit position three is encoded as “0011”. In this mode, each target-symbol in a
slice is encoded as a single slice-code. Obviously, if there are many target-symbols
that are adjacent or near to each other, it is inefficient to encode each of them using
separate slice-codes. Hence the group-copy-mode has been designed to increase the
compression efficiency.
Fig. 7.16 Principle of scan
slice encoding
Scan Chain 0
Scan Chain 1
Scan Chain N-2
Scan Chain N-1
Decoder
c-bit scan slices
N-bit buffer
K = ⎡log2(N + 1)⎤
c = K + 2
0 1 2 K+1
Control-code
K-bit data-code
210 P. Girard and H J. Wunderlich
In the group-copy-mode,anN -bit slice is divided into M D N=K groups, and
each group is K-bits wide with the possible exception for the last group. If a group
contains more than two target-symbols, the group-copy-mode is used and the en-
tire group is copied to a data-code. Two data-codes are needed to encode a group.
The first data-code specifies the index of the first bit of the group, and the second
data-code contains the actual data. In the group-copy-mode, don’t-care bits can be
randomly filled instead of being mapped to 0 or 1 by the compression scheme. For
example, let N D 8 and K D 4, i:e: each slice is 8-bits wide and consists of two
4-bit groups. To encode the slice “X1110000”, the three 1s in group 0 are encoded.
The resulting data-codes are “0000” and “X111”, which refer to bit 0 (first bit of
group 0) and the content of the group, respectively.
Since data-codes are used in both modes, control-codes are needed to avoid ambi-
guity. Control-codes “00”, “01” and “10” are used in the single-bit-mode and “11”
is used in the group copy-mode. Control-codes “00” and “01” are referred to as
initial control-codes and they indicate the start of a new slice. Table 7.1 shows a
complete example to illustrate the encoding procedure. The first column shows the
scan slices. The second and third ones show the resulting slice-codes (control- and
data-codes) and the last column describes the compression procedure.
A property of this compression method is that consecutive c-bit compressed
slices fed by the ATE are often identical or compatible. Therefore, ATE pattern-
repeat can be used to further reduce test data volume after selective encoding of
scan slices. More details about ATE pattern-repeat can be found in Wang and
Chakrabarty (2005).
7.6.2.2 Test Power Considerations
The above technique drastically reduces test data volume (up to 28x for a set of
experimented industrial circuits) and test time (up to 20x). However, power con-
sumption is not carefully considered, especially during the filling of don’t-care bits
in the scan slices. To illustrate this problem, let us consider the 4 slice-code example
given in Table 7.2 with N D 8 and K D 2.
Table 7.1 A slice encoding – example 1
Slices
Slice Codes: Slice Codes:
Descriptions
Data Code Control Code
XX00 010X 00 0101 Start a new slice, map Xs to 0, set
bit 5 to 1
1110 0001 00 0111 Start a new slice, map Xs to 0, set
bit 7 to 1
11 0000 Enter group-copy-mode starting
from bit 0
11 1110 The data is 1110
XXXX
XX11
01 1000 Start a new slice, map Xs to 1, no
bits are set to 0
7 Models for Power-Aware Testing 211
Table 7.2 A slice encoding – example 2
Slices
Slice Codes: Slice Codes:
Descriptions
Control Code Data Code
XX00 010X 00 0101 Start a new slice, map Xs to 0, set
bit 5 to 1
XXXX XX11 01 1000 Start a new slice, map Xs to 1, no
bits are set to 0
X00X XXXX 00 1000 Start a new slice, map Xs to 0, no
bits are set to 1
11XX 0XXX 01 0100 Start a new slice, map Xs to 1, set
bit 4 to 0
Table 7.3 Scan-slices obtained after decompression
Slices after performing decompression
SC1 SC2 SC3 SC4 SC5 SC6 SC7 SC8 Descriptions
00000100Xsaresetto0
11111111Xsaresetto1
00000000Xsaresetto0
11110111Xsaresetto1
66665366WT
44 Total WT
Table 7.4 Slice encoding with the 0-filling option
Slices Slice Codes
0 0 0 0 0 1 0 0 00 0101
0 0 0 0 0 0 1 1 00 1000
11 0100
11 0011
0 0 0 0 0 0 0 0 00 1000
1 1 0 0 0 0 0 0 00 1000
11 0000
11 1100
15 Total WT
The scan slices obtained after decompression and applied to the internal scan
chains are given in Table 7.3. The two last lines give the number of weighted tran-
sitions (WT) in each internal scan chain (SC) and the total number of weighted
transitions generated at the circuit inputs after application of all test patterns. As can
be seen, the toggle activity in each scan chain is very high, mainly because Xs in
the scan slices are set alternatively to 0 and 1 before performing the compression
procedure.
By modifying the assignment of don’t-care bits in our example, and filling all
don’t care with 0 (0-filling) or 1 (1-filling) for the entire test sequence, the total num-
ber of WT is greatly reduced (15 with the 0-filling option and 19 with the 1-filling
option). Results are shown in Tables 7.4 and 7.5 respectively.
212 P. Girard and H J. Wunderlich
Table 7.5 Slice encoding with the 1-filling option
Slices Slice Codes
1 1 0 0 0 1 0 1 01 1000
11 0000
11 1100
11 0101
1 1 1 1 1 1 1 1 01 1000
1 0 0 1 1 1 1 1 01 1000
11 0000
11 1001
1 1 1 1 0 1 1 1 01 0100
19 Total WT
Consequently, test power considerations in this technique will consist in modify-
ing the initial selective encoding procedure by using one of the following X-filling
heuristics to fill don’t-care bits:
0-filling: all Xs in the test sequence are set to 0s
1-filling: all Xs in the test sequence are set to 1s
MT-filling (Minimum Transition filling): all Xs are set to the value of the last
encountered care bit (working from the top to the bottom of column)
A counterpart of this positive impact on test power is a possible negative impact on
the test data compression rate. By looking at the results in Tables 7.4 and 7.5, we can
notice that the number of slice-codes obtained after compression is 8 and 9 respec-
tively, which is much higher than 4 obtained with the original procedure (shown in
Table 7.2). In fact, the loss in compression rate is much lower than it appears in this
example. Experiments performed on industrial circuits and reported in Badereddine
et al. (2008) have shown that test data volume reduction factors (12x on average)
are in the same order of magnitude than those obtained with the initial compression
procedure (16x on average). On the other hand, test power reduction with respect
to the initial procedure is always higher than 95%. Moreover, this method does not
require detailed structural information about the IP core under test, and utilizes a
generic on-chip decoder which is independent of the IP core and the test set.
7.7 Summary
Reliability, yield, test time and test costs in general are affected by test power con-
sumption. Carefully modeling the different types and sources of test power is a
prerequisite of power aware testing. Test pattern generation, design for test, and test
data compression have to be implemented with respect to their impacts on power.
The techniques presented in this chapter allow power restricted testing with mini-
mized hardware cost and test application time.
7 Models for Power-Aware Testing 213
References
Altet J, Rubio A (2002) Thermal testing of integrated circuits. Springer Science, New York
Al-Yamani A, Chmelar E, Grinchuck M (May 2005) Segmented addressable scan architecture. In
Proceedings of VLSI test symposium, pp 405–411
Arabi K, Saleh R, Meng X (May–Jun 2007) Power supply noise in SoCs: metrics, management,
and measurement. IEEE Des Test Comput 24(3)
Athas WC, Svensson LJ, Koller JG, Tzartzanis N, Chin Chou EG (Dec 1994) Low-power digital
systems based on adiabatic-switching principles. IEEE Trans VLSI Sys 2(4):398–416
Badereddine N, Wang Z, Girard P, Chakrabarty K, Virazel A, Pravossoudovitch S, Landrault C
(Aug 2008) A selective scan slice encoding technique for test data volume and test power
reduction. JETTA J Electron Test – Theory Appl 24(4):353–364
Baik DH, Saluja KK (Oct 2005) Progressive random access scan: a simultaneous solution to test
power, test data volume and test time. In Proceedings of international test conference. Paper
15.2
Bonhomme Y, Girard P, Guiller L, Landrault C, Pravossoudovitch S (Nov 2001) A gated clock
scheme for low power scan testing of logic ics or embedded cores. In Proceedings of Asian
Test Symposium, pp 253–258
Bonhomme Y, Girard P, Guiller L, Landrault C, Pravossoudovitch S (Oct 2003) Efficient scan chain
design for power minimization during scan testing under routing constraint. In Proceedings of
international test conference, pp 488–493
Borkar SY, Dubey P, Kahn KC, Kuck DJ, Mulder H, Pawlowski SP, Rattner JR (2005) Platform
2015: Intel processor and platform evolution for the next decade. In Intel White Paper Platform
2015
Butler KM, Saxena J, Fryars T, Hetherington G, Jain A, Lewis J (Oct 2004) Minimizing power
consumption in scan testing: pattern generation and DFT techniques. In Proceedings of inter-
national test conference, pp 355–364
Chandra A, Chakrabarty K (Jun 2001) Combining low-power scan testing and test data compres-
sion for system-on-a-chip. In Proceedings of design automation conference, pp 166–169
Chandra A, Chakrabarty K (Jun 2002) Reduction of SOC test data volume, scan power and test-
ing time using alternating run-length codes. In Proceedings of design automation conference,
pp 673–678
Chang YS, Gupta SK, Breuer MA (Apr 1997) Analysis of ground bounce in deep sub-micron
circuits. In Proceedings of VLSI test symposium, pp 110–116
Cirit MA (Nov 1987) Estimating dynamic power consumption of CMOS circuits. In Proceedings
of international conference on computer-aided design, pp 534–537
Czysz D, Tyszer J, Mrugalski G, Rajski J (May 2007) Low power embedded deterministic test. In
Proceedings of VLSI test symposium, pp 75–83
Gerstend¨orfer S, Wunderlich HJ (Sep 1999) Minimized power consumption for scan-based BIST.
In Proceedings of international test conference, pp 77–84
Girard P, Guiller L, Landrault C, Pravossoudovitch S, Figueras J, Manich S, Teixeira P, Santos M
(1999) Low energy BIST design: impact of the LFSR TPG parameters on the weighted switch-
ing activity. In Proceedings of international symposium on circuits and systems, CD-ROM
Girard P, Guiller L, Landrault C, Pravossoudovitch S, Wunderlich HJ (May 2001) A modified clock
scheme for a low power BIST test pattern generator. In Proceedings of VLSI test symposium,
pp 306–311
Girard P (May–Jun 2002) Survey of low-power testing of VLSI circuits. IEEE Des Test Comput
19(3):82–92
Girard P, Wen X, Touba NA (2007) Low-power testing. In: Wang LT, Stroud CE, Touba NA (eds)
System-on-chip test architectures: nanometer design for testability. Morgan Kaufmann Pub-
lishers, pp 307–350
Hertwig A, Wunderlich HJ (May 1998) Low power serial built-in self-test. In Proceedings of Eu-
ropean test workshop, pp 49–53
214 P. Girard and H J. Wunderlich
Huang T-C, Lee K-J (1989) A token scan architecture for low power testing. In Proceedings of
international test conference, pp 660–669
Johnson DS, Aragon C, McGeoch L, Schevon C (1989) Optimisation by simulated annealing : an
experimental evaluation; part I, graph partitioning. Oper Res 37(865–892)
Lee K-J, Huang T-C, Chen J-J (Dec 2000) Peak-power reduction for multiple-scan circuits during
test application. In Proceedings of Asian test symposium, pp 453–458
Lee J, Touba NA (Oct 2004) Low power test data compression based n LFSR reseeding. In Pro-
ceedings of international conference on computer design, pp 180–185
Midulla I, Aktouf C (Dec 2008) Test power analysis at register transfert level. ASP J Low Pow
Electron 4(3):402–409
Najm F (Dec 1994) A survey of power estimation techniques in VLSI circuits. IEEE Trans VLSI
Sys 2(4):446–455
Nicolici N, Al-Hashimi B (2003) Power-constrained testing of VLSI circuits. Springer Science,
New York, NY
Pedram M, Rabaey J (eds) (2002) Power aware design methodologies. Kluwer Academic
Publishers
Pouya B, Crouch A (Oct 2000) Optimization trade-offs for vector volume and test power. In Pro-
ceedings of international test conference, pp 873–881
Rajski J, Tyszer J, Kassab M, Mukherjee N (May 2004) Embedded deterministic test. IEEE Trans
Computer-Aided Des 23:776–792
Ravi S, Devanathan VR, Parekhji R (Nov 2007) Methodology for low power test pattern generation
using activity threshold control logic. In Proceedings of international conference on computer-
aided-design, pp 526–529
Ravi S, Parekhji R, Saxena J (Apr 2008) Low power test for nanometer system-on-chips (SoCs).
ASP J Low Power Electron 4(1):81–100
Remersaro S, Lin X, Zhang Z, Reddy SM, Pomeranz I, Rajski J (Oct 2006) Preferred fill: a scalable
method to reduce capture power for scan based designs. In Proceedings of international test
conference, paper 32.2
Rosinger P, Gonciari T, Al-Hashimi B, Nicolici N (2001) Simultaneous reduction in volume of test
data and power dissipation for systems-on-a-chip. IEE Electron Lett 37(24):1434–1436
Rosinger P, Al-Hashimi B, Nicolici N (Jul 2004) Scan architecture with mutually exclusive scan
segment activation for shift- and capture-power reduction. IEEE Trans Computer-Aided Des
23(7):1142–1153
Roy K, Mukhopadhaya S, Mahmoodi-Meimand H (2003) Leakage current mechanisms and
leakage reduction techniques in deep-submicrometer CMOS circuits. In Proceedings of IEEE,
pp 305–327
Sankaralingam R, Oruganti R, Touba NA (May 2000) Static compaction techniques to control scan
vector power dissipation. In Proceedings of VLSI test symposium, pp 35–42
Sankaralingam R, Touba NA (Feb 2003) Multi-phase shifting to reducing instantaneous peak
power during scan. In Proceedings of Latin American Test Workshop, pp 78–83
Saxena J, Butler KM, Whetsel L (Oct 2001) A scheme to reduce power consumption during scan
testing. In Proceedings of internatinal test conference, pp 670–677
Saxena J, Butler KM, Jayaram VB, Kundu S, Arvind NV, Sreeprakash P, Hachinger M (Oct 2003)
A case study of ir-drop in structured at-speed testing. In Proceedings of international test con-
ference, pp 1098–1104
Sde-Paz S, Salomon E (Oct 2008) Frequency and power Correlation between At-Speed Scan and
Functional Tests. In Proceedings 39th IEEE international test conference (ITC) 2008, pp 13.3
Shi C, Kapur R (2004) How power aware test improves reliability and yield. IEEDesign.com,
Sep. 15
Wang Z, Chakrabarty K (Oct 2005) Test data compression for IP embedded cores using selective
encoding of scan slices. In Proceedings of international test conference, paper 24.3
Wang S, Gupta SK (Oct 1994) ATPG for heat dissipation minimization during test application. In
Proceedings of international test conference, pp 250–258
7 Models for Power-Aware Testing 215
Wang S, Gupta SK (Oct 1997) DS-LFSR: a new BIST TPG for low heat dissipation. In Proceedings
of international test conference, pp 848–857
Wang S, Gupta SK (Oct 1999) LT-RTPG: a new test-per-Scan BIST TPG for low heat dissipation.
In Proceedings of international test conference, pp 85–94
Wang CY, Roy K (Jan 1995) Maximum power estimation for CMOS circuits using deterministic
and statistical approaches. In Proceedings of VLSI conference, pp 364–369
Wang L-T, Wu C-W, Wen X (2006) Vlsi test principles and architectures: design for testability.
Morgan Kaufmann, San Francisco
Wen X, Suzuki T, Kajihara S, Miyase K, Minamoto Y, Wang L-T, Saluja KK (Dec 2005a) Efficient
test set modification for capture power reduction. ASP J Low Pow Electron 1(3):319–330
Wen X, Yamashita Y, Morishima S, Kajiihara S, Wang L-T, Saluja KK, Kinoshita K (May 2005b)
On low-capture-power test generation for scan testing. In Proceedings of VLSI test symposium,
pp 265–270
Wen X, Kajihara S, Miyase K, Suzuki T, Saluja KK, Wang L-T, Abdel-Hafez KS, Kinoshita K
(May 2006) A new ATPG method for efficient capture power reduction during scan testing. In
Proceedings of VLSI test symposium, pp 58–63
Wen X, Miyase K, Suzuki T, Yamato Y, Kajihara S, Wang L-T, Saluja KK (Oct 2006) A highly-
guided x-filling method for effective low-capture-power scan test generation. In: Wen X et al.
(eds) Proceedings of international conference on computer design, pp 251–258
Wen X, Miyase K, Kajihara S, Suzuki T, Yamato Y, Girard P, Oosumi Y, Wang LT (Oct 2007)
A novel scheme to reduce power supply noise for high-quality at-speed scan testing. In Pro-
ceedings of international test conference, paper 25.1
Weste NHE, Eshraghian K (1993) Principles of CMOS VLSI design: a systems perspective, 2nd
edn. Addison-Wesley
Whetsel L (Oct 2000) Adapting scan architectures for low power operation. In Proceedings of
international test conference, pp 863–872
Wohl P, Waicukauski JA, Patel S, Amin MB (Jun 2003) Efficient compression and application
of deterministic patterns in a logic BIST architecture. In Proceedings of design automation
conference, pp 566–569
Zoellin C, Wunderlich HJ, Maeding N, Leenstraa J (Oct 2006) BIST power reduction using scan-
chain disable in the CELL processor. n Proceedings of international test conference, Paper 32.3
Zorian Y (Apr 1993) A distributed BIST control scheme for complex VLSI devices. Proceedings
of 11th IEEE VLSI test symposium, pp 4–9
Chapter 8
Physical Fault Models and Fault Tolerance
Jean Arlat and Yves Crouzet
Abstract Dependable systems are obtained by means of extensive testing
procedures and the incorporation of fault tolerance mechanisms encompassing
error detection (on-line testing) and system recovery. In that context, the charac-
terization of fault models that are both tractable and representative of actual faults
constitute an essential basis upon which one can efficiently verify, design or assess
dependable systems. On one hand, models should refer to erroneous behaviors that
are as abstract and as broad as possible to allow for the definition and development
of both generic fault tolerance mechanisms and cost-effective injection techniques.
On the other hand, the models should definitely aim at matching the erroneous
behaviors induced by real faults.
In this chapter, we focus on the representativeness of fault models with respect
to physical faults for deriving relevant testing procedures as well as detection mech-
anisms and experimental assessment techniques. We first discuss the accuracy of
logic fault models with respect to physical defects in the implementation of off-
line/on-line testing mechanisms. Then, we show how the fault models are linked to
the identification and implementation of relevant fault injection-based dependability
assessment techniques.
Keywords Defect characterization Fault models Testability improvement Test-
ing procedures Test sequences generation Layout rules Coding Error detection
Self-checking Fault-injection-based testing Dependability assessment
8.1 Introduction
The proper characterization of component defects and related fault models during
the development phase and during normal operation is a main concern. In order to
be appropriate and efficient, methodologies and procedures have to rely on models
J. Arlat (
) and Y. Crouzet
LAAS-CNRS; Universit´e de Toulouse; 7, avenue du Colonel Roche, F-31077 Toulouse, France
e-mail:
H J. Wunderlich (ed.), Models in Hardware Testing: Lecture Notes of the Forum
in Honor of Christian Landrault, Frontiers in Electronic Testing 43,
DOI 10.1007/978-90-481-3282-9
8,
c
Springer Science+Business Media B.V. 2010
217
218 J. Arlat and Y. Crouzet
reflecting as much as possible the real defects and faults that are likely to af-
fect both the production and the operational phases. Hardware testing was initially
based on the assumption that defects could be adequately modeled by stuck-at-0
and stuck-at-1 logical faults associated with the logic diagram of the circuit un-
der test. Nevertheless, with the increasing integration density, this hypothesis has
become less and less sound. Similar concerns about fault representativeness apply
to the definition of suitable fault tolerance mechanisms (error detection and recov-
ery) meant to cope with faults occurring during normal operation (on-line testing).
Fault representativeness issues also impact the specific testing methods (classically,
fault injection techniques), that are specifically intended to assess the fault tolerance
mechanisms against the typical sets of inputs they are a meant to cope with: the
faults and errors induced. Such techniques are to be related to the simulation tech-
niques described in Chapter 4 for estimating the quality of test sets, with respect to
manufacturing defects.
This chapter addresses fault representativeness issues at large, i.e., encompass-
ing the definition and application of various forms of testing: off-line testing with
respect to manufacturing defects and on-line testing mechanisms to cope with faults
occurring during normal operation (Section 8.2), and a recursive form of testing
designed to assess the coverage of the fault tolerance mechanisms (Section 8.3).
Finally, Section 8.4 concludes the chapter.
It is worth noting that the results reported in Section 8.2 are based on seminal
research work carried out at LAAS-CNRS during years 1975–1980 and directed
by Christian Landrault (first work by Christian devoted to hardware testing). These
studies were dedicated to the design of easily testable and self-checking LSI circuits.
We voluntarily maintained the historical and pioneering perspective of that work in
keeping the original figures, among which some are from Christian’s hand.
Before moving to the next section of this chapter, we will provide here some basic
definitions and terminology about hardware dependability issues that will be used
throughout the paper, and that are compliant with the currently widely accepted
taxonomy in the domain (Aviˇzienis et al. 2004). In this process, we assume the
recursive nature attached to the notions of failure, fault, error, failure, fault,etc.:
a. Defect: a physical defect is a failure occurring in the manufacturing process or
in operation (e.g., short, open, threshold voltage drift, etc.).
b. Fault: a fault is the direct consequence of a defect. At the logical level, the most
popular fault model has been for long time the stuck-at-X fault model – X 2
f0, 1g. A defect is equivalent to a stuck-at X of a line l (l=X/ if the behavior of
the defective circuit is identical to the behavior of a perfect circuit with the line
maintained at logical value X.
c. Error: an error corresponds to the activation of a fault that induces an incorrect
operation of the target system (IC or system including the IC). A line presents an
error at a value X if, during normal operation, it is at the logical value X instead
of the value
X. The error observed at a given point of a target IC, depends not
only on the type of fault, but also on the structure of the circuit (logical function),
as well as the logical inputs and outputs of the circuit. A defect may induce:
8 Physical Fault Models and Fault Tolerance 219
A single error, if it only influences one output
A unidirectional error, if it impacts several outputs in the same manner
A multiple error, if it influences several outputs in different ways
d. Failure: A failure occurs when the service delivered by the target system is per-
ceived by its users as deviating from the correct one. This has to be related to
the definition that illustrates the recursion attached to the concepts governing the
fault-error-failure pathology.
8.2 Fault Models and Off-Line/On-Line Testing
Off-line and on-line testing techniques have been based for long time on the as-
sumption that defects may be modeled by stuck-at-0 and stuck-at-1 logical faults
associated with the logic diagram of the circuit to be tested. This hypothesis is be-
coming less and less sound with the advance of integration technology. This section
is based on a pioneering study aimed at addressing this problem (Galiay 1978;
Galiay et al. 1980; Crouzet 1978; Crouzet and Landrault 1980).
Section 8.2.1 derives a set of fault assumptions motivated by the physical origin
of the defects observed by direct inspection of 4-bit microprocessor chips. A great
majority of the defects affecting complex gates are shorts and opens that cannot be
accounted for by the commonly used logic level models. Section 8.2.2 deals with
the generation of (off-line) test sequences for such defects. Section 8.2.3 proposes
layout rules aimed at facilitating testing procedures. These rules aim at decreasing
the variety of possible defects and at avoiding those that are not easily testable. By
adhering to these rules, then logic level models are again able to accurately represent
the effects of actually observed physical defects. Sections 8.2.4and 8.2.5 address the
problem of designing fault-tolerant systems able to cope with defect manifestations
during operation. Proposals helping the design of circuits better adapted to the real-
ization of fault-tolerant systems (Sedmak and Liebergot 1978; Rennels et al. 1978)
are provided. These sections focus on on-line testing issues for detecting errors
induced by the physical defects in operation. Suitable error models and related im-
plementation rules aimed at facilitating the efficiency of the detection are briefly
presented. Finally, Section 8.2.6 provides concluding remarks.
8.2.1 Defects Analysis for MOS LSI
The problem of test generation can be formulated as follows: given a description of
the target circuit and a list of faults, derive the shortest sequence of input vectors
enabling the detection of the faults in the list. This detection must be ensured by
observing the primary outputs of the circuit, only. The nature of the considered list
of faults strongly influences the test sequence generation. The more these faults are
related to the physical nature of the circuit, the higher the quality of the test, but
220 J. Arlat and Y. Crouzet
as a general consequence, more effort will be required for the generation of the
test sequence. The list of faults must therefore be carefully selected to satisfy these
conflicting requirements: sufficient fault coverage and easy test generation.
Rather than considering each kind of physical defect of the circuit individually,
it is custom practice to deal with a more general fault model able to represent all of
them. At the time when the considered study was carried out, all testing approaches
were based on stuck-at-0 or stuck-at-1 of any connection of the logic diagram of the
circuit. Even if this model was relatively satisfactory for small-scale integration, it
was clearly no longer valid for large-scale integrated circuits. To tackle this problem,
we have first tried to carry out a characterization of LSI failure modes by analyzing
a set of failed circuits (Crouzet et al. 1978).
The considered application circuit is a 4-bit microprocessor designed by EFCIS
1
and realized with PMOS technology. It is able to manage four processes with dif-
ferent priorities, and it includes all the basic functions of an LSI IC: (1) scratchpad
memory, (2) arithmetic and logic unit, (3) program counters, and (4) control unit
realized with PLA. The internal architecture is based on a classical bus structure rep-
resented by Fig. 8.1. Two blocks are specific to the application circuit: the allocation
unit, and the timing unit. The allocation unit enables management of interruptions
4
1
44 3 4
444
BI
TP 1 TP 2
44
4
4
A(11-0)
12
44
44
44 4
42
12
INCREMENTING ARRAY
+0, +1, +2
PROGRAM COUNTERS
RAM 4 × 12
4
4
4
5
1
4
ALU
RAM
M [R]
16 × 4
VALUES
TESTED
COMMANDS
VES
E(3-0)
VI
PC
FC
DC
TV
RI
DF
TF
NMST NHLT
SUPERVISOR
SEQUENCER
ALLOCATION
UNIT
TIMING
UNIT
NITR NATG
A
NATG
CONDITION
TESTS
R
0
1
Q
Fig. 8.1 Functional internal architecture of the application circuit
1
EFCIS: Soci´et´e pour l’Etude et la Fabrication de Circuits Int´egr´es Sp´eciaux, that has evolved to
form ST Microelectronics, in the late 1990s.
8 Physical Fault Models and Fault Tolerance 221
from the four processes. The timing unit furnishes real time clocks acting as internal
interrupts for the allocation unit. The remaining part of the circuit is composed of
three main blocks:
1. The addressing system, composed of the incrementing array, the program coun-
ters, the output register A, and the buffers TP1 and TP2
2. The processing unit, including the ALU, the accumulator Q, the input buffer DF,
the RAM M[R], and the condition test block
3. The control block, including the sequencer and the supervisor
Pinpointing defects simply by direct observation of the chip is a very complex task.
Thus, to reduce the region of investigation, an initial step aimed at a prelocalization
of the failures was introduced. This specific test sequence is hierarchically organized
using a “start small” approach:
The total sequence is divided into subsequences each dedicated to the test of a
specific microprocessor block whose size is as small as possible.
The ordering of the subsequences is such that a fault detected by any of them
cannot be induced by one of the blocks tested by the previous subsequences.
The second step of the analysis consists of a direct observation of the chip in the re-
gion determined by the prelocalization sequence. Different techniques were applied:
1. Parametric measurements, giving information about process quality
2. Research of the shmoo plot domain (i.e., the domain of correct operation) for
different parameters, e.g., temperature, frequency, and supply voltage
3. Visual inspection with an optical microscope
4. Potential cartography with a scanning electron microscope
5. Electrical analysis of the circuits nodes by placing probes onto the chip
This method has been applied to a set of 43 defective chips. The two main results
obtained from this study are as follows: (1) defects are randomly distributed and no
block is more vulnerable than any other, and (2) insights about the typical physi-
cal defect modes were derived. Table 8.1 depicts the observed defect modes. They
consist mainly of shorts and opens concerning either the metallizations or the dif-
fusions. It should be noted that no short was observed between metallization and
diffusion. For 10% of the cases, a logical error was clearly observed, but no defect
could be identified. For another 15%, the chips presented a very large imperfection
(e.g., a scratch from one side to the other of the chip) which can be considered as
Table 8.1 Observed failure
modes
Short between metallizations 39%
Open of a metallization 14%
Short between diffusions 14%
Open of a diffusion 6%
Short between metallization and substrate 2%
Non identified 10%
Non significant 15%
222 J. Arlat and Y. Crouzet
Fig. 8.2 Example of open defects in the application circuit
“non significant” for test purposes because such faults can be easily revealed by any
test sequence. Figure 8.2 illustrates opens affecting two metallization lines in the
Timing Unit.
Two alternative approaches have been followed to cope with defects that cannot
be handled by logical fault models:
1. Try to generate test sequences accounting directly for the defects (shorts and
opens) at the electrical level.
2. Propose restrictive layout rules, so that defects results essentially to stuck-at
faults at the logic level.
8.2.2 Generation of Test Sequences for Shorts and Opens
8.2.2.1 Basic Consequences from the Failure Mode Analysis
Concerning test sequence generation and fault simulation, the results of the failure
mode analysis have two very important consequences.
Not All Defects Can Be Modeled by Stuck-at Faults This can be clearly illus-
trated by the following example. Figure 8.3a represents the electrical diagram of a
MOS gate on which two possible shorts (#1 and #2) and two possible opens (#3 and
#4) are indicated. Short #1 and open #3 can be modeled by a stuck-at-1 at input e
and by a stuck-at-0 at input e (or input f or both), respectively. On the other hand,
short #2 and open #4 cannot be modeled by any stuck-at-fault because they lead to
a modification of the function realized by the gate. For the same reason, a short be-
tween the outputs of two gates (Fig. 8.3b) cannot be modeled by any stuck-at faults.
Representing the Circuit as a Logic Diagram Is Not Adequate Taking into ac-
count physical defects such as shorts and opens implies the consideration of the
actual topology of the circuit. This advocates for the consideration of an electrical
8 Physical Fault Models and Fault Tolerance 223
V
DD
Load
transistor
Switch-like
network
V
SS
V
DD
V
SS
S
1
S
2
a
ab
a
b
b
e
1
3
2
4
c
c
d
d
f
Without short: S
1
= a.b S
2
= c.d
With short: S
1
= S
2
= a.b+c.d
Fig. 8.3 (a) Failure examples in a MOS gate. (b) Short between the outputs of two gates
abe
e
f
a
b
c
d
d
Electrical diagram
Logic diagram
f
c
V
DD
V
SS
s
s
2
1
?
?
?
?
?
?
?
Fig. 8.4 Relations between electrical and logic diagrams
diagram rather than a logic diagram, since the latter does not constitute a real model
of the physical circuit. Some connections of the real circuit are not represented in
the logic diagram, whereas some connections appearing on the logic diagram may
be missing in the physical circuit.
As an example, Fig. 8.4 shows the logic and electrical diagrams of the same gate.
The faults considered in each diagram are those that cannot be represented on the
other or even cannot occur.
For instance, short #2, which is physically possible, cannot be represented on the
logic diagram, and short #1 in the logic diagram has no physical meaning.
Consequently, all methods for test sequence generation and fault simulation
based on a stuck-at fault model at the logic diagram level are not well adapted.
A possible approach for fault simulation may be to introduce short defects or, bet-
ter, to work directly with the transistor diagram. For test sequence generation, it is
necessary to use a new method accounting directly for the faults at the gate and
blocks levels.
224 J. Arlat and Y. Crouzet
8.2.2.2 Test Sequence Generation at the Gate Level
For testing at the gate level, we first need to define the notion of a conduction path
that will be used later. MOS technology enables the realization of complex gates in-
cluding several cascaded AND/OR basic functions (Fig. 8.3a). Schematically, such a
gate can be divided into two parts: a load transistor and a set of “control” transistors
that can be considered as a switch-like network.
The switch-like network constitutes the active part of the gate. It allows, by
applying convenient input patterns, the realization of a set of conduction paths
between the output node and the V
SS
power supply node. A conduction path is
activated when all of its control transistors are on. Conversely, a conduction path is
blocked when at least one of its control transistors is off. For the whole gate, when
one (or more) paths between the output node and the V
SS
node is (are) activated, the
output of the gate is at V
SS
, i.e., logical state 0, while, when all conduction paths are
blocked, the output of the gate is at V
DD
, i.e., logical state 1.
Opens Depending on its location, an open in the switch-like network corresponds
to the removal of one or more conduction paths. In order to detect such an open, two
conditions are required: (1) activate at least one of the conduction paths between
the output node and the V
SS
node which connects to the open line, and (2) block all
the conduction paths between the output node and the V
SS
node not connected to
the open line.
When these conditions are fulfilled, if the considered open is not present, at least
one conduction path is really activated and the output of the gate is at logical state 0.
Otherwise, if this open is present, no conduction path is activated and the output
of the gate remains at logical state 1. The potential presence of the open is indeed
observed at the output of the gate.
In order to derive a test sequence able to detect all possible opens in the switch-
like network, a systematic procedure deduced from the general graph theory is given
in Galiay (1978). It consists of first listing all the conduction paths between the out-
put node and the V
SS
node and then successively activating one of these conduction
paths and simultaneously blocking all the others. For example, Table 8.2 gives a set
of five test vectors obtained for the gate of Fig. 8.3a.
The test sequence obtained with such a systematic procedure is generally redun-
dant, but minimizing its length is only feasible if we have information about the
actual layout of the control transistors. For instance, if the layout is exactly the one
of Fig. 8.3a, only the three tests T2, T3, and T5 are required to detect all opens in
the switch-like network.
Table 8.2 Test sequence for
opens in gate of Fig. 8.3a
abcdef Activedpath
T1 10100– ac
T2 10010– ad
T3 01100– bc
T4 01010– bd
T5 00––11 ef
8 Physical Fault Models and Fault Tolerance 225
Table 8.3 Set of test vectors
detecting short #2 of Fig.8.3a
abcdef
100001
010001
110001
001010
000110
001110
Shorts A short between any couple of nodes in the switch-like network corre-
sponds to the creation of one or more conduction paths. Two conditions are required
to detect a short between nodes i and j : (1) activate at least one conduction path
between the output node and the i (respectively, j ) node and at least one conduction
path between the j (respectively, i) node and the V
SS
node, and (2) block all other
conduction paths of the network.
When these two conditions are realized, if nodes i and j are shorted, the output
node is at logical state 0. If there is no short, the output node is at logical state
1: the potential presence of the short is observed at the output of the gate. For a
given short, usually, several test vectors enabling its detection exist. For instance,
Table 8.3 gives the set of six tests enabling detection of short #2 of Fig. 8.3a. To
obtain a complete test sequence for all shorts of the switch-like network, it is first
necessary to determine in this way the set of test vectors for each of them, and then
to search for a minimal coverage enabling detection of all these shorts. If n is the
number of nodes in the network, this minimal cover presents a maximum number
of
n
2
vectors.
8.2.2.3 Test Sequence Generation at the Block Level
Two specific problems can be identified for testing a block interconnecting several
gates.
Controllability and Observability Assuming that a complete test sequence has
been determined for each gate of the block, we must now apply to each gate its test
sequence even if not all inputs are easily controllable and/or observable. This can be
done by using a path sensitization method based on propagation to primary outputs
of the block and consistency according to primary inputs (Roth et al. 1978).
Additional Failure Modes Specific to the Block Structure We address in se-
quence the problems related to opens and shorts:
a. In addition to the opens in the gates, the block structure introduces opens in inter-
connections between gates. Such an interconnection always connects the output
of a gate to the gates of one or more control transistors of other gates. The open
of such a connection thus leads to a floating gate potential of the transistors that
are located after the open. In static operation, the leakage current is sufficient to
226 J. Arlat and Y. Crouzet
Fig. 8.5 Shorts in a block
structure
3
1
24
set that potential to V
SS
, and the transistors concerned are therefore always off.
The open will thus be detected while testing the gates including these transistors
if a low testing rate is assumed.
b. The problem concerning shorts is more difficult. Figure 8.5 represents all types
of shorts occurring in the block structure. In addition to the shorts inside a gate
(1), there are shorts between a connection inside a gate and the output of this
or another gate (2), shorts between two internal connections belonging to two
different gates (3), and shorts between the outputs of two different gates (4).
Each of these shorts involves a specific erroneous behavior (introduction of asyn-
chronous sequential loop, modification of the function, introduction of analog
behavior, etc.). To determine suitable test sequences, these errors must be individu-
ally analyzed and, as the number of possible shorts is very high in LSI circuits, this
requires a very large amount of work.
Accordingly, it is more realistic to simplify the problem by reducing the number
of potential shorts and preferably removing those that are the most difficult to test,
even if this leads to a chip area increase. Such an approach (see Section 8.2.3)is
based on restricting the circuit layout by a set of rules concerning arrangement of
the gates at the block level and of nodes at the gate level.
8.2.3 Improvement of Circuit Testability
The layout rules aimed at improving circuit testability are based on a set of failure
hypotheses that we will first justify by an analysis of the manufacturing process of
the technology used for the application circuit.
8.2.3.1 Manufacturing Process Analysis
Basically, a MOS chip consists of three interconnection levels (assuming an alu-
minum gate): (1) a lower level made by diffusions in an insulating substrate, (2)
an upper level made by metallizations, and (3) a medium level of oxide insulating
the two previous levels and presenting two kinds of discontinuities: holes enabling
8 Physical Fault Models and Fault Tolerance 227
contact between a metallization of the upper level and a diffusion of the lower level
and thindowns corresponding to transistor gates.
The realization of diffusions and metallizations requires selective masking of
very precise regions on the surface of the chip. The inherent failure mode of such a
process consists of diffusing (or etching) regions that do not have to be diffused (or
etched) or vice-versa. On a manufactured chip, such defects involve shorts between
diffusions or metallizations and opens of diffusions or metallizations, only.
The growth of thick and thin oxide levels uniformly over the whole surface of the
chip implies homogeneous levels with relatively few defects. The thick oxide con-
stitutes a very good insulator between the diffusion level and the metallization level
and, as a consequence, shorts between a metallization and a diffusion are very un-
likely. Concerning the thin oxide, two kinds of defects can occur: local thindowns
enabling breakdown by electrostatic discharge, and local contamination involving
threshold voltage drift for the corresponding transistor. Electrostatic breakdown af-
fects mainly input and output buffers. It can be detected by parametric testing, and
more rarely affects transistors in the middle of the chip. Threshold voltage drift is a
gradual aging phenomenon and implies, at the logical level, that the concerned tran-
sistor is either off or on. This has the same effect as an open of the drain or source
diffusion or a short between these two diffusions.
Finally, for pin holes in the oxide, the only possible failure consists of a bad
contact between the diffusion and the metallization and acts as an open of one of
these connections.
Accordingly, an incomplete, but satisfactory fault coverage will be ensured for
monochannel MOS integrated circuits when considering the following two failure
assumptions: (A1) all possible defects consist of opens of diffusions or metalliza-
tions and shorts between two adjacent diffusions or metallizations, and (A2) No
short can involve a metallization and a diffusion.
It is worth noting that this evaluation qualitatively agrees with the experimental
results described in Section 8.2.1.
8.2.3.2 Rules for Improving Testability
Block level. Using the failure assumptions defined above, we will first define five
layout rules governing the relative arrangement of gates. Rule 1 is based on failure
assumption A2. It aims at avoiding shorts between an internal connection between
the gates (short # 2 in Fig. 8.5).
R1: Make all internal gate connections entirely with diffusions and all intercon-
nections between gates entirely with metallization.
Rules 2 and 3 are intended to control the short possibilities between two
internal connections of two different gates (short #3 in Fig.8.5).
R2: Arrange all internal gate connections (which are made by diffusions accord-
ing to rule 1) inside a domain whose external limits are either the output
diffusion or a V
SS
diffusion of this gate (the latter diffusion can be com-
monly used by two adjacent gates).
228 J. Arlat and Y. Crouzet
Load
transistors
Gate 2Gate 1
V
SS
V
DD
Gate 3
Contact-like
networks
Fig. 8.6 Rules at block level
R3: Arrange any two adjacent gates to ensure that, if the output diffusion of the
one constitutes one of its external limits, then it adjoins a V
SS
diffusion of
the other gate.
Figure 8.6 illustrates rules 2 and 3.
All connections of each gate are enclosed in a domain bounded by the vertical
lines representing diffusions and the horizontal dotted lines. With such a layout,
the only possible short between two gates, for instance, gates numbered 1 and 2
on the figure always involve the output diffusion of the first and a V
SS
diffusion
of the second. This short can be modeled by a stuck-at-0 fault of the output of the
former.
Rules 4 and 5 are intended to control the short possibilities between the outputs
of two different gates (short #4 in Fig. 8.5).
R4: Arrange the gates of the block along a given direction in increasing level
order according to their logic level in the block.
R5: Arrange the interconnections between the gates (which are realized by met-
allizations according to R1 to avoid shorts that can introduce asynchronous
sequential loops. For instance, given three interconnections A, B, and C, if a
short between A and B leads to a loop and shorts between A and C on one
hand and B and C on the other hand do not lead to a loop, then A and B can
be isolated by placing C between them. As a practical matter, this rule is not
very systematic, and therefore is not as easy to apply as R4.
Gate Level We now describe rules for arrangements of equipotential lines within
a gate. First, remember that, according to R1 all connections in a gate are made by
diffusions.
For opens, as reported in Section 8.2.1, most of the opens in a complex gate can
be modeled by stuck-at faults of either the output or one or more inputs of that gate.
For instance, for the gate of Fig. 8.3a, only open #4 cannot be modeled by any stuck-
at fault because it leads to a modification of the logical function of the gate. Several
solutions are applicable for the layout. Figure 8.7 shows two of these possibilities
for the part of the gate related to inputs a, b c and d. With the first solution, open