Model-Based Design for Embedded Systems- P4 ppt
Bạn đang xem bản rút gọn của tài liệu. Xem và tải ngay bản đầy đủ của tài liệu tại đây (761.28 KB, 30 trang )
Nicolescu/Model-Based Design for Embedded Systems 67842_C003 Finals Page 66 2009-10-13
66 Model-Based Design for Embedded Systems
in the application binary. Depending on the current cache state and the
execution history, cache misses may occur at different points in time. How-
ever, formal methods are able to identify for each basic block the maximum
number of cache misses that may occur during the execution [46]. The con-
trol flow graph can be annotated with this information, making the longest
path analyses feasible again.
Depending on the actual system configuration, the upper bound on the
number of transactions per task execution may not be sufficiently accurate.
In a formal model, this could translate into an assumed burst of requests
that may not occur in practice. This can be addressed with a more detailed
analysis of the task control flow, as is done in [1,39], which provides bounds
on the minimum distances between any n requests of an activation of that
task. This pattern will then repeat with each task activation.
This procedure allows to conservatively derive the shared resource
request bound functions ˜η
+
τ
(w) and ˜η
−
τ
(w) that represent the transaction traf-
fic that each task τ in the system can produce within a given time window
of size w. Requesting tasks that share the same processor may be executed in
alternation, resulting in a combined request traffic for the complete proces-
sor. This again can be expressed as an event model. For example, a straight-
forward approach is to approximate the processor’s request event model (in
a given time window) with the aggregation of the request event models of
each individual task executing on that processor. Obviously, this is an over-
estimation, as the tasks will not be executed at the same time, but rather the
scheduler will assign the processor exclusively. The resulting requests will
be separated by the intermediate executions, which can be captured in the
joint shared resource request bound by a piecewise assembly from the ele-
mentary streams [39].
3.3.2 Response Time Analysis in the Presence of Shared Memory
Accesses
Memory access delays may be treated differently by various processor imple-
mentations. Many processors, and some of the most commonly used, allow
tasks to perform coprocessor or memory accesses by offering a multi-cycle
operation that stalls the entire processor until the transaction has been pro-
cessed by the system [44]. In other cases, a set of hardware threads may allow
to perform a quick context switch to another thread that is ready, effectively
keeping the processor utilized (e.g., [17]). While this behavior usually has
a beneficial effect on the average throughput of a system, multithreading
requires caution in priority-based systems with reactive or control applica-
tions. In this case, the worst-case response time of even high-priority tasks
may actually increase [38].
The integration of dynamic memory access delays into the real-time anal-
ysis will in the following be performed for a processor with priority-based
preemptive scheduling that is stalled during memory accesses. In such a
Nicolescu/Model-Based Design for Embedded Systems 67842_C003 Finals Page 67 2009-10-13
Formal Performance Analysis 67
system, a task’s worst-case response time is determined by the task’s worst-
case execution time plus the maximum amount of time the task can be kept
from executing because of preemptions by higher-priority tasks and blocking
by lower-priority tasks. A task that performs memory accesses is addition-
ally delayed when waiting for the arrival of requested data. Furthermore,
preemption times are increased, as the remote memory accesses also cause
high-priority tasks to execute longer.
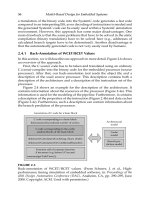
A possible runtime schedule is depicted in Figure 3.5. In the case where
both tasks execute in the local memory (Scenario 3.5a), the low-priority task
is kept from executing by three invocations of the high-priority tasks. Local
memory accesses are not explicitly shown, as they can be considered to be
part of the execution time. When both tasks access the same remote mem-
ory (Scenario 3.5b), the finishing time of the lower-priority task increases,
because it itself fetches data from the remote memory, and also because of
the prolonged preemptions by the higher-priority task (as its request also
stalls the processor). The execution of the low-priority task in the example
is now stretched such that it suffers from an additional preemption of the
other task. Finally, Scenario 3.5c shows the effect of a task on another core
CPUb that is also accessing the same shared memory, in this case, periodi-
cally. Whenever the memory is also used by a task on CPUb, CPUa is stalled
for a longer time, again increasing the task response times, possibly leading
to the violation of a given deadline. As the busy wait adds to the execution
t
(a)
Preemption
Stalling
CPU
Memory
CPU
(b)
Memory
CPUa
CPUb
(c)
FIGURE 3.5
Tasks on different processors accessing a shared memory. (a and b) Single
processor case and (c) conflicts from another CPU.
Nicolescu/Model-Based Design for Embedded Systems 67842_C003 Finals Page 68 2009-10-13
68 Model-Based Design for Embedded Systems
time of a task, the total processor load increases—possibly making the overall
system unschedulable.
On the basis of these observations, a response time equation can be
derived for the example scheduler. The response time represents the sum
of the following:
• The core execution times of all tasks mapped to the processor, and their
activation event models.
• The increased blocking time due to the resources being stalled during
memory accesses. (This is not shown in the example.)
• The aggregate delay caused by the memory accesses that is a function
of the memory accesses of a specific task and its higher-priority tasks.
This is investigated in Section 3.3.3.
Variations of such a response time analysis have been presented for
single- and multithreaded static-priority preemptive scheduling [38], as well
as for round-robin scheduling [41]. Other scheduling policies for which clas-
sical real-time analysis is available can be straight-forwardly extended to
include memory delays by including a term that represents the aggregate
busy time due to memory accesses.
3.3.3 Deriving Aggregate Busy Time
Deriving the timing of many memory accesses has recently become an
important topic in real-time research. Previously, the worst-case timing of
individual events was the main concern. Technically, a sufficient solution
to find the delay that a set of many events may experience, is to derive
the single worst-case load scenario and assume it for every access. How-
ever, not every memory request will experience a worst-case system state,
such as worst-case time wheel positions in the time division multiple access
(TDMA) schedules, or transient overloads in priority-based components. For
example, the task on CPUb in Figure 3.5 will periodically access the shared
memory, and, as a consequence, disturb the accesses by the two tasks on
CPUa. A “worst-case memory access” will experience this delay, but of all
accesses from CPUb, this happens maximally three times in this example.
Thus, accounting this interference for every single memory access leads to
very unsatisfactory results—which has previously prevented the use of con-
servative methods in this context.
The key idea is instead to consider all requests that are processed during
the lifetime of a task jointly. We therefore introduce the worst-case accumu-
lated busy time, defined as the total amount of time, during which at least one
request is issued but is not finished. Multiple requests in a certain amount of
time can in total only be delayed by a certain amount of interference, which
is expressed by the aggregate busy time.
This aggregate busy time can be efficiently calculated (e.g., for a shared
bus): a set of requests is issued from different processors that may interfere
Nicolescu/Model-Based Design for Embedded Systems 67842_C003 Finals Page 69 2009-10-13
Formal Performance Analysis 69
with each other. The exact individual request times are unknown and their
actual latency is highly dynamic. Extracting detailed timing information
(e.g., when a specific cache miss occurs) is virtually impossible and consid-
ering such details in a conservative analysis yields exponential complexity.
Consequently, we disregard such details and focus on bounding the aggre-
gate busy time. Given a certain level of dynamism in the system, this con-
sideration will not result in excessive overestimations. Interestingly, even in
multithreaded multicore architectures, the conservatism is moderate, sum-
ming up to less than a total of 25% of the overestimated response time, as
shown in practical experiments [42].
Without bus access prioritization, it has to be assumed that it is possi-
ble for every transaction issued by any processor during the lifetime of a
task activation i that it will disturb the transactions issued by i. Usually, the
interference is then given by the transactions issued by the other concur-
rently active tasks on the other processors, as well as the tasks on the same
processor as their requests are treated on a first-come-first-served basis. The
interested readers are referred to [40] for more details on the calculation of
aggregate memory access latencies.
If a memory controller is utilized, this can be very efficiently consid-
ered. For example, all requests from a certain processor may be prioritized
over those of another. Then, the imposed interference by all lower-priority
requests equals zero. Additionally, a small blocking factor of one elementary
memory access time is required, in order to model the time before a transac-
tion may be aborted for the benefit of a higher-priority request.
The compositional analysis approach of Section 3.2, used together with
the methods of Section 3.3, now delivers a complete framework for the
performance analysis of heterogeneous multiprocessor systems with shared
memories. The following section turns to detailed modeling of inter-
processor communication with the help of HEMs.
3.4 Hierarchical Communication
As explained in Section 3.2, traditional compositional analysis models bus
communication by a simple communication task that is directly activated by
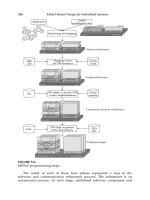
the sending task, and which directly activates the receiving task. Figure 3.6
shows a simple example system that uses this model for communication,
where each output event of the sending tasks, T
a
and T
b
, triggers the trans-
mission of one message over the bus.
However, the modern communication stacks employed in today’s
embedded control units (ECUs), for example, in the automotive domain,
make this abstraction inadequate. Depending on the configuration of the
communication layer, the output events (called signals here) may or may
Nicolescu/Model-Based Design for Embedded Systems 67842_C003 Finals Page 70 2009-10-13
70 Model-Based Design for Embedded Systems
T
a
T
c
T
d
T
b
ECU1 Bus
C
1
C
2
ECU2
FIGURE 3.6
Traditional model.
ES
a
HES
a,b
ES
b
ECU1 Bus ECU2
T
c
T
d
T
b
C
T
a
FIGURE 3.7
Communication via ComLayer.
not directly trigger the transmissions of messages (called frames here).
For instance, AUTOSAR [2] defines a detailed API for the communication
stack, including several frame transmission modes (direct, periodic, mixed,
or none) and signal transfer properties (triggered or pending) with key
influences on communication timings. Hence, the transmission timings of
messages over the bus do not have to be directly connected to the output
behaviors of the sending tasks anymore, but they may even be completely
independent of the task’s output behavior (e.g., sending several output
signals in one message).
In the example shown in Figure 3.7, the tasks T
a
and T
b
produce output
signals that are transmitted over the bus to the tasks T
c
and T
d
. The send-
ing tasks write their output data into registers provided by the communi-
cation layer, which is responsible for packing the data into messages, called
frames here, and triggering the transmission of these frames according to the
signal types and transmission modes. On the receiving side, the frames are
unpacked, which means that the contained signals are again written into dif-
ferent registers for the corresponding receiving task. Using flat event models,
the timings of signal arrivals can only be bound with a large overestimation.
To adequately consider such effects of modern communication stacks in
the system analysis, two elements must be determined:
1. The activation timings of the frames
2. The timings of signals transmitted within these frames arriving at the
receiving side
To cope with both the challenges, we introduce hierarchical event streams
(HESs) modeled by a HEM, which determines the activating function of the
frame and also captures the timings of the signals assignedtothat frame, and,
Nicolescu/Model-Based Design for Embedded Systems 67842_C003 Finals Page 71 2009-10-13
Formal Performance Analysis 71
most importantly, defines how the effects on the frame timings influence the
timings of the transmitted signals. The latter allows to unpack the signals
on the receiving side, giving tighter bounds for the activations of those tasks
receiving the signals.
The general idea is that a HES has one outer representation in the form
of an event stream ES
outer
, and each combined event stream has one inner
representation, also in the form of an event stream ES
i
, where i denotes the
task to which the event stream corresponds. The relation between the outer
event stream and the inner event stream depends on the hierarchical stream
constructor (HSC) that combined the event streams. Each of the involved
event streams is defined by functions δ
−
(n) and δ
+
(n) (see Section 3.2.2),
returning the minimum and the maximum distance, respectively, between n
consecutive events.
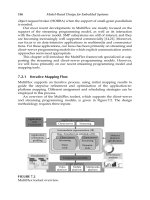
Figure 3.8 illustrates the structure of the HES at the input of the chan-
nel C of the example shown in Figure 3.7. The HSC combines the output
streams of the tasks T
a
and T
b
, resulting in the hierarchical input stream of
the communication task C. According to the properties and the configuration
of the communication layer that is modeled by the HSC, the inner and outer
event streams of the HES are calculated. Each event of the outer event stream,
ES
outer
, represents the sending of one message by the communication layer.
The events of a specific inner event stream, ES
a
and ES
b
, model the timings of
only those messages that contain data from the corresponding sending tasks.
The detailed calculations of the inner and outer event streams, considering
the different signal properties and frame transmission modes, are presented
in [37].
For the local scheduling analysis of the bus, only the outer event stream
is relevant. As a result, the best-case response time, R
min
, and the worst-case
HES
a,b
ES
outer
HSC
Distances between total message releases
Distances between
messages containing a
new signal from T
b
Distances between
messages containing a
new signal from T
b
δ(n)
δ(n)
δ(n)
δ
–
(n)
δ
–
(n)δ
–
(n)
23456
23456
23456
n
n
n
δ
+
(n)
δ
+
(n)δ
+
(n)
HSC
HSC
ES'
b
ES'
b
ES'
a
ES'
a
ES
a
ES
outer
ES
b
FIGURE 3.8
Structure of the hierarchical input stream of C.
Nicolescu/Model-Based Design for Embedded Systems 67842_C003 Finals Page 72 2009-10-13
72 Model-Based Design for Embedded Systems
response time, R
max
, are obtained. Based on the outer event stream, ES
outer
,
of the hierarchical input stream, we obtain the outer event stream, ES
outer
,of
the hierarchical output stream by using the following equations:
δ
−
outer
(n) = max{δ
−
outer
(n) − J
resp
, δ
−
outer
(n − 1) + d
min
} (3.2)
δ
+
outer
(n) = max{δ
+
outer
(n) + J
resp
, δ
+
outer
(n − 1) + d
min
} (3.3)
In fact, Equations 3.2 and 3.3 are generalizations of the output model calcu-
lation presented in Equation 3.1. As can be seen, actually two changes have
been made to the message timing. First, the minimum (maximum) distance
between a given number of events decreases (increases) by no more than the
response time jitter, J
resp
= R
max
− R
min
. Second, two consecutive events
at the output of the channel are separated by at least a minimum distance,
d
min
= R
min
. The resulting event stream, modeled by δ
−
outer
(n) and δ
+
outer
(n),
becomes the outer stream of the output model.
To obtain the inner event streams, ES
i
, of the hierarchical output stream,
we adapt the inner event streams, ES
i
, of the hierarchical input stream
according to the changes applied to the outer stream. For the adaptation,
we consider the two changes mentioned above separately. First, consider
that the minimum distance between n messages decreases by J
resp
. Then,
the minimum distance between k messages that contain the data of a spe-
cific task decreases by J
resp
. Second, we must consider that two consecu-
tive messages become separated by a minimum distance d
min
. Figure 3.9a
illustrates a sequence of events consisting of two different event types,
a and b. Assume that this event sequence models the message timing, where
the events labeled by a lowercase a correspond to the messages containing
data from task T
a
, and the events labeled by a lowercase b correspond to the
messages containing data from task T
b
. Figure 3.9b shows how this event
sequence changes when a minimum distance d
min
between two consecutive
events is considered. As indicated, the distance between the last two events
of type b further decreases because of the minimum distance. Likewise, the
maximum distance increases because of the minimum distance, d
min
, as can
be seen for the first and the second of the events of type b. Based on the min-
imum distance, d
min
, the maximum possible decrease (increase), D
max
,inthe
δ
+
b
(2)
ab a
(a)
(b)
ab b t
δ
–
b
(2)
δ
+
b
(2)
d
min
a
b
a
a
b b t΄
δ
–
b
(2)
FIGURE 3.9
(a) The event sequence before applying the minimum distance and (b) the
event sequence after considering the minimum distance d
min
.
Nicolescu/Model-Based Design for Embedded Systems 67842_C003 Finals Page 73 2009-10-13
Formal Performance Analysis 73
minimum (maximum) distance between events that can occur because of the
minimum distance can be calculated. Note that, in the case of large bursts,
D
max
can be significantly larger than d
min
, since an event can be delayed by
its predecessor event, which itself is delayed by its predecessor and so on.
More details can be found in [37].
In general, considering the response time jitter, J
resp
, and the minimum
distance, d
min
, the inner stream of the hierarchical output stream, modeling
messages that contain data from the task T
i
, can be modeled by
δ
−
i
(n) = max{δ
−
i
(n) − J
resp
−D
max
, δ
−
i
(n − 1) + d
min
},
δ
+
i
(n) = δ
+
i
(n) + J
resp
+D
max
To determine the activation timings of the receiving tasks, T
c
and T
d
,we
now have not only the arrival times of messages, but also the timings of
exactly those messages that contain new data from a certain sending task,
given by the corresponding inner stream. Assuming that the task T
c
is only
activated every time a new signal from the task T
a
arrives, then the inner
event stream ES
a
of the hierarchical output stream of the communication
task C can directly be used as an input stream of the task T
c
.
It is also possible to have event streams with multiple hierarchical lay-
ers, for example, when modeling several layers of communication stacks or
communications over networks interconnected by gateways, where several
packets may be combined into some higher-level communication structure.
This can be captured by our HEM by having an inner event stream of a HES
that is the outer event stream of another HEM. For more details on multilevel
hierarchies, refer to [36].
3.5 Scenario-Aware Analysis
Because of the increasing complexity of modern applications, hard real-time
systems are often required to run different scenarios (also called operating
modes) over time. For example, an automotive platform may exclusively exe-
cute either an ESC or a parking-assistant application. While the investigation
of each static scenario can be achieved with classical real-time performance
analysis, timing failures during the transition phase can only be uncovered
with new methods, which consider the transient overload situation during
the transition phase in which both scenarios can impress load artifacts on the
system.
Each scenario is characterized by a specific behavior and is associated
with a specific set of tasks. A scenario change (SC) from one scenario to
another is triggered by a scenario change request (SCR) which may be caused
either by the need to change the system functionality over time or by a system
Nicolescu/Model-Based Design for Embedded Systems 67842_C003 Finals Page 74 2009-10-13
74 Model-Based Design for Embedded Systems
transition to a specific internal state requiring an SC. Depending on the task
behavior across an SC, three types of tasks are defined:
• Unchanged task: An unchanged task belongs to both task sets of the ini-
tial (old) and the new scenario. It remains unchanged and continues
executing normally after the SCR.
• Completed task: A completed task only belongs to the old scenario task
set. However, to preserve data-consistency, completed task jobs acti-
vated before the SC are allowed to complete their execution after the
SCR. Then the task terminates.
• Added task: An added task only belongs to the new scenario task set.
It is initially activated after the SCR. Each added task is assigned an
offset value, φ, that denotes its earliest activation time after the SCR.
During an SC, executions of completed, unchanged, and added tasks may
interfere with one another, leading to a transient overload on the resource.
Since the timing requirements in the system have to be met at any time dur-
ing the system execution, it is necessary to verify if task deadlines could be
missed because of an SC.
Methods analyzing the timing behavior across an SC under static-priority
preemptive scheduling already exist [32,45,47]. However, they are limited
to independent tasks mapped on single resources. Under such an assump-
tion, the worst-case response time for an SC for a given task under analysis
is proved to be obtained within the busy window during which the SCR
occurs, called the transition busy window. These approaches can however
not be applied to distributed systems because of the so-called echo effect.
The echo effect is explained in the following section using the system exam-
ple in Figure 3.11.
3.5.1 Echo Effect
The system used in the experiments of Section 3.8 (depicted in Figure 3.11)
represents a hypothetical automotive system consisting of two IP compo-
nents, four ECUs, and one multicore ECU connected via a CAN bus. The
system is assumed to run two mutually exclusive applications: an ESP
application (Sens1, Sens2 → eval1,eval2) and a parking-assistant application
(Sens3 → SigOut). A detailed system description can be found in Section 3.8.
Let us focus on what happens on the CAN bus when the ESP application
is deactivated (Scenario 1) and the parking-assistant application becomes
active (Scenario 2). Depending on which application a communication task
belongs to, we can determine the following task types on the bus when an SC
occurs from Scenario 1 to Scenario 2: C1andC5 are unchanged communica-
tion tasks, C3andC4 are added communication tasks, and C2 is a completed
communication task. Furthermore, we assume the following priority order-
ing on the bus: C1 > C2 > C3 > C4 > C5.
Nicolescu/Model-Based Design for Embedded Systems 67842_C003 Finals Page 75 2009-10-13
Formal Performance Analysis 75
When an SC occurs from Scenario 1 to Scenario 2, the added communica-
tion task C3 is activated by events sent by the task mon3. However, C3 may
have to wait until the prior completed communication task C2 finishes exe-
cuting before being deactivated. This may lead to a burst of events waiting at
the input of C3 that in turn may lead to a burst of events produced at its out-
put. This burst of events is then propagated through the task ctrl3onECU4
to the input of C4. In between, this burst of events may have been ampli-
fied because of scheduling effects on ECU4 (the task ctrl3 might have to wait
until calc finishes executing). Until this burst of events arrives at C4’s input—
which is a consequence of the SC on the bus—the transition busy window
might already be finished on the bus. The effect of the transient overload
because of the SC on the bus may therefore not be limited to the transition
busy window but be recurrent. We call this recurrent effect the echo effect.
As a consequence of the echo effect, for the worst-case response time calcu-
lation across the SC of the low-priority unchanged communication task C5,
it is not sufficient to consider only its activations within the transition busy
window. Rather, the activations within the successive busy windows need to
be considered.
3.5.2 Compositional Scenario-Aware Analysis
The previous example illustrates how difficult it is to predict the effect of
the recurrent transient overload after an SC in a distributed system. As a
consequence of this unpredictability, it turns to be very difficult to describe
the event timings at task outputs and therefore to describe the event tim-
ings at the inputs of the connected tasks, needed for the response time cal-
culation across the SC. To overcome this problem, we need to describe the
event timing at each task output, in a way that covers all its possible tim-
ing behaviors, even those resulting from the echo effect that might occur
afteranSC.
This calculation is performed by extending the compositional methodol-
ogy presented in Section 3.2 as follows. As usual, all external event models at
the system inputs are propagated along the system paths until an initial acti-
vating event model is available at each task input. Then, global system anal-
ysis is performed in the following way. In the first phase, two task response
time calculations are performed on each resource. First, for each task we cal-
culate its worst-case response time during the transition busy window. This
calculation is described in detail in [13]. Additionally, for each unchanged or
added task, using the classical analysis techniques we calculate its worst-case
response times assuming the exclusive execution of the new scenario. Then,
for each task, a response time interval is built into which all its observable
response times may fall (i.e., the maximum of its response time during the
transition busy window and its response time assuming the exclusive exe-
cution of the new scenario). The tasks’ best-case response times are given by
their minimum execution times in all scenarios.
Nicolescu/Model-Based Design for Embedded Systems 67842_C003 Finals Page 76 2009-10-13
76 Model-Based Design for Embedded Systems
Having determined a response time interval across the SC for each task,
the second phase of the global system analysis is performed as usual, describ-
ing the traffic timing behavior at task outputs, by using event models.
Afterward, the calculated output event models are propagated to the con-
nected components, where they are used as activating event models for
the subsequent global iteration. If after an iteration all calculated output
event models remain unmodified, convergence is reached. As the propa-
gated event models contain all potential event timings—during and after the
transition—the calculated task response times are considered valid.
3.6 Sensitivity Analysis
As a result of an intensive HW/SW component reuse in the design of embed-
ded systems, there is a need for analysis methods that, besides validating the
performance of a system configuration, are able to predict the evolution of
the system performance in the context of modifications of component prop-
erties.
The system properties represent intrinsic system characteristics deter-
mined by the configuration of the system components and the system’s inter-
action with the environment. These include the execution/communication
time intervals of the computational/communication tasks, the timing param-
eters of the task activation models, or the speed factor of the HW resources.
These properties are used to build the performance model of the system.
Based on this, the system quality is evaluated using a set of performance
metrics such as response times, path latencies, event timings at components’
outputs, and buffer sizes. These are used to validate the set of performance
constraints, determined by local and global deadlines, jitter and buffering
constraints, and so on.
The sensitivity analysis of real-time systems investigates the effects on the
system quality (e.g., end-to-end delays, buffer sizes, and energy consump-
tion) when subjected to system property variations. It will in the following
be used to cover two complementary aspects of real-time system designs:
performance characterization and the evaluation of the performance slack.
3.6.1 Performance Characterization
This aspect investigates the behavior of the performance metrics when apply-
ing modifications of different system properties. Using the mathematical
properties of the functions describing the performance metrics, one can show
the dependency between the values of the system properties specified in the
input model and the values of the performance metrics. This is especially
important for system properties leading to a discontinuous behavior of the
Nicolescu/Model-Based Design for Embedded Systems 67842_C003 Finals Page 77 2009-10-13
Formal Performance Analysis 77
performance metrics. The system designer can efficiently use this informa-
tion to apply the required modifications without critical consequences on
the system’s performance.
Of special interest is the characterization of system properties whose vari-
ation leads to a nonmonotonic behavior of the performance metrics, referred
to as timing anomalies. Such anomalies mostly occur because of inter-task
functional dependencies, which are directly translated into timing depen-
dencies in the corresponding performance model. The analyses of timing
anomalies become relevant in the later design phases, when the estimated
property values turn into concrete, fixed values. It is important for the system
designer to know the source of such anomalies and which of the property
values correspond to nonmonotonic system performance behavior. Since
it divides the nonmonotonic—performance unpredictable—design configu-
ration space into monotonic—performance predictable—subspaces, timing
anomaly analysis is an important element of the design space exploration
process.
3.6.2 Performance Slack
In addition to performance characterization, sensitivity analysis determines
the bound between feasible and infeasible property values. This bound is
called the sensitivity front. The maximum amount by which the initial value
of a system property can be modified without jeopardizing the system feasi-
bility is referred to as performance slack.
In general, to preserve the predictability, the modification of the design
data is performed in isolation. This means, the system designer assumes the
variation of a single system characteristic at a time, for example, the imple-
mentation of a software component. In general, in terms of performance,
this corresponds to the variation of a single system property, for example,
the worst-case execution time of the modified task. Such modifications are
subject to one-dimensional sensitivity analysis. When the modification of a
single system property has only local effects on the performance metrics, the
computation of the performance slack is quite simple. Several formal meth-
ods were previously proposed [3,48]. However, in some other situations, the
variation of the initial value affects several local and global performance met-
rics. Therefore, in order to compute the performance slack, sensitivity anal-
ysis has to be assisted by an appropriate system-level performance analysis
model.
In many design scenarios though, changing the initial design data cannot
be performed in isolation, such that a required design modification involves
the simultaneous variation of several system characteristics, and thus system
properties. For example, changes in the execution time of one task may coin-
cide with a changed communication load of another task. Such modifications
are the subject of multidimensional sensitivity analysis. Since the system per-
formance metrics are represented as functions of several system properties
Nicolescu/Model-Based Design for Embedded Systems 67842_C003 Finals Page 78 2009-10-13
78 Model-Based Design for Embedded Systems
and the dependency between these properties is generally unknown, the
sensitivity front is more difficult to determine. In general, the complexity of
the sensitivity analysis exponentially increases with the number of variable
properties in the design space.
Based on the design strategy, two scenarios for using the performance
slack are identified:
• System robustness optimization: Based on the slack values, the designer
defines a set of robustness metrics to cover different possible design
scenarios. In order to maximize the system robustness at a given cost
level, the defined robustness metrics are used as optimization objec-
tives by automatic design space exploration and optimization tools
[12]. The scope is to obtain system configurations with less sensitivi-
ties to later design changes. More details are given in Section 3.7.
• System dimensioning: To reduce the global system cost, the system
designer can decide to use the performance slack for efficient system
dimensioning. In this case, instead of looking for system configurations
that can accommodate later changes, the performance slack is used to
optimize the system cost by selecting cheaper variants for processors,
communication resources, or memories. A sufficient slack may even
suggest the integration of the entire application on alternative plat-
forms, reducing the number of hardware components [30]. Note that
lower cost implies lower hardware costs on one side, and lower power
consumption and smaller size on the other.
The sensitivity analysis approach has been tailored differently in order to
achieve the previous design goals. Thus, to perform robustness optimization,
the sensitivity analysis was integrated into a global optimization framework.
For the evaluation of the robustness metrics it is not necessary to accurately
determine the sensitivity front. Instead, using stochastic analysis, the sensi-
tivity front can be approximated using two bounds for the sensitivity front:
the lower bound determines the minimum guaranteed robustness (MGR),
while the upper bound determines the maximum possible robustness (MPR).
The benefit of using a stochastic analysis instead of an exact analysis is the
nonexponential complexity with respect to the number of dimensions, which
makes it suitable for a large number of variable system properties. Details
about the implementation are given in [12].
For the second design scenario, the exact sensitivity front is required
in order to perform the modifications of the system properties. Compared
to previous formal sensitivity analysis algorithms, the proposed approach
uses a binary search technique, ensuring complete transparency with respect
to the application structure, the system architecture, and scheduling algo-
rithms. In addition, the compatibility with the system-level performance
analysis engine allows analysis of systems with global constraints. The
one-dimensional sensitivity analysis algorithms are also used to bound
the search space investigated by the stochastic sensitivity analysis approach.
Nicolescu/Model-Based Design for Embedded Systems 67842_C003 Finals Page 79 2009-10-13
Formal Performance Analysis 79
The advantage of the exact analysis, when compared to the stochastic
analysis, is the ability to handle nonmonotonic search spaces. A detailed
description of the sensitivity analysis algorithms for different system prop-
erties can be found in [31].
3.7 Robustness Optimization
In the field of embedded system design, robustness is usually associated
with reliability and resilience. Therefore, many approaches to fault tolerance
against transient and permanent faults with different assumptions and for
different system architectures can be found in the literature (e.g., in [9,22,28]).
These approaches increase the system robustness against effects of external
interferences (radiation, heat, etc.) or partial system failure, and are, there-
fore, crucial for safety critical systems.
In this chapter, a different notion of robustness for embedded systems
is introduced and discussed: robustness to variations of system properties.
Informally, a system is called robust if it can sustain system property modi-
fications without severe consequences on system performance and integrity.
In contrast to fault tolerance requiring the implementation of specific meth-
ods such as replication or reexecution mechanisms [18] to ensure robust-
ness against faults, robustness to property variations is a meta problem that
does not directly arise from the expected and specified functional system
behaviors. It rather represents an intrinsic system property that depends on
the system organization (architecture, application mapping, etc.) and its con-
figuration (scheduling, etc.).
Accounting for property variations early during design is key, since even
small modifications in systems with complex performance dependencies can
have drastic nonintuitive impacts on the overall system behavior, and might
lead to severe performance degradation effects [29]. Since performance eval-
uation and exploration do not cover these effects, it is clear that the use of
these methods alone is insufficient to systematically control system perfor-
mance along the design flow and during system lifetime. Therefore, explicit
robustness evaluation and optimization techniques that build on top of per-
formance evaluation and exploration are needed. They enable the designer
to introduce robustness at critical positions in the design, and thus help to
avoid critical performance pitfalls.
3.7.1 Use-Cases for Design Robustness
In the following, we discuss situations and scenarios where robustness of
hardware and run-time system performance against property variations is
expected and is crucial to efficiently design complex embedded systems.
Nicolescu/Model-Based Design for Embedded Systems 67842_C003 Finals Page 80 2009-10-13
80 Model-Based Design for Embedded Systems
Unknown quality of performance data: First, robustness is desirable to account
for data quality issues in early design phases, where data that are required
for performance analysis (e.g., task execution times and data rates) are often
estimated or based on measurements. As a result of the unknown input data
quality, also the expressiveness and accuracy of performance analysis results
are unknown. Since even small deviations from estimated property values
can have severe consequences on the final system performance, it is obvious
that robustness against property variations leverages the applicability of for-
mal analysis techniques during design. Clearly, design risks can be consid-
erably reduced by identifying performance critical data and systematically
optimizing the system for robustness.
Maintainability and extensibility: Secondly, robustness is important to ensure
system maintainability and extensibility. Since major system changes in reac-
tion to property variations are not usually possible during late design phases
or after deployment, it is important to choose system architectures and
configurations that offer sufficient robustness for future modifications and
extensions, as early on as possible. For instance, the huge number of feature
combinations in modern embedded systems has led to the problem of prod-
uct and software variants. Using robustness optimization techniques, sys-
tems can be designed, at the outset, to accommodate additional features and
changes. Other situations where robustness can increase system maintain-
ability and extensibility include late feature requests, product and software
updates (e.g., new firmware), bug fixes, and environmental changes.
Reusability and modularity: Finally, robustness is crucial to ensure component
reusability and modularity. Even though these issues can be solved on the
functional level by applying middleware concepts, they are still problematic
from the performance verification point of view. The reason is that system
performance is not composable, prohibiting the straightforward combina-
tion of individually correct components in a cut-and-paste manner to whole
systems. In this context, robustness to property variations can facilitate the
reuse of components across product generations and families, and simplify
platform porting.
3.7.2 Evaluating Design Robustness
Sensitivity analysis has already been successfully used for the evaluation
and optimization of specific system robustness aspects. In [26], for instance,
the authors present a sensitivity analysis technique calculating maximum
input rates that can be processed by stream-processing architectures with-
out violating on-chip buffer constraints. The authors propose to integrate
this technique into automated design space exploration to find architectures
with optimal stream-processing capabilities, which exhibits a high robust-
ness against input rate increases.
Nicolescu/Model-Based Design for Embedded Systems 67842_C003 Finals Page 81 2009-10-13
Formal Performance Analysis 81
In this chapter, sensitivity analysis is systematically utilized for general
robustness evaluation and optimization purposes. More precisely, instead
of consuming the available slack for system dimensioning, and thus cost
minimization, the slack is distributed so that the system’s capability of sup-
porting property variations is maximized. Using sensitivity analysis as a
basis for robustness evaluation and optimization has two important advan-
tages compared to previous approaches.
1. State-of-the-art modular sensitivity analysis techniques capture com-
plex global effects of local system property variations. This ensures the
applicability of the proposed robustness evaluation and optimization
techniques to realistic performance models, and increases the expres-
siveness of the results.
2. Rather than providing the system behavior for some isolated dis-
crete design points [4,7], sensitivity analysis characterizes continuous
design subspaces with identical system states. It thus covers all possible
system-property variation scenarios.
3.7.3 Robustness Metrics
In order to optimize robustness, we need, on the one hand, expressive robust-
ness metrics and, on the other hand, efficient optimization techniques. In
general, robustness metrics shall cover different design scenarios.
3.7.3.1 Static Design Robustness
The first considered design scenario assumes that system parameters are
fixed early during design and cannot be modified later (e.g., at late design
stages or after deployment) to compensate for system property modifica-
tions. This scenario is called static design robustness (SDR).
The SDR metric expresses the robustness of parameter configurations
with respect to the simultaneous modifications of several given system prop-
erties. Since the exact extent of system property variations can generally not
be anticipated, it is desirable that the system supports as many as possible
modification scenarios. This shall be transparently expressed by the SDR
metric: the more different modification scenarios represent feasible system
states for a specific parameter configuration, the higher the corresponding
SDR value. Note that the SDR optimization yields a single parameter config-
uration possessing the highest robustness potential for the considered system
properties.
3.7.3.2 Dynamic Design Robustness
The SDR metric assumes static systems with fixed parameter configurations.
However, the system may react to excessive system property variations with
dynamic counteractions, such as parameter reconfigurations, which poten-
tially increases the system’s robustness. When such potential designer or
Nicolescu/Model-Based Design for Embedded Systems 67842_C003 Finals Page 82 2009-10-13
82 Model-Based Design for Embedded Systems
system counteractions are included in the robustness evaluation, this view
is expressed with the dynamic design robustness (DDR). The DDR metric
expresses the robustness of given systems with respect to the simultane-
ous modifications of several system properties that can be achieved through
reconfiguration. Consequently, it is relevant for the design scenario where
parameters can be (dynamically) modified during design or after deploy-
ment. Obviously, the DDR metric depends on the set of possible parame-
ter configurations, C (“counteractions”), that can be adopted through recon-
figuration. For instance, it may be possible to react to a property variation
by adaptation of scheduling parameters (e.g., adaptive scheduling strate-
gies [25] and network management techniques [8]) or application remapping.
Application scenarios for the DDR metric include the evaluation of
dynamic systems and, more generally, the assessment of the design risks con-
nected to specific components. More precisely, already during early design,
the DDR metric can be used to determine bounds for property values of spe-
cific components ensuring their correct functioning in the global context. This
information efficiently facilitates feasibility and requirements analysis and
greatly assists the designer in pointing out critical components requiring spe-
cial focus during specification and implementation. Another use-case con-
cerns reconfigurable systems. The DDR metric can be used to maximize the
dynamic robustness headroom for crucial components. Obviously, by choos-
ing a system architecture offering a high DDR for crucial system parts early,
the designer can significantly increase system stability and maintainability.
Note that the DDR optimization yields multiple parameter configura-
tions, each possessing partially disjoint robustness properties. For instance,
one parameter configuration might exhibit high robustness for some sys-
tem properties, whereas different parameter configurations might offer more
robustness for other system properties.
Figure 3.10a and b visualize the conceptual difference between the notions
of the SDRand theDDR by meansof a simpleexample. Figure3.10a shows the
feasibleregionoftwopropertiesp
1
andp
2
,i.e.,theregioncontainingallfeasible
property value combinations, of a given parameter configuration. This corre-
sponds to the static robustness, where a single parameter configuration with
high robustness needs to be chosen. Figure 3.10b visualizes the dynamic
robustness. In the considered case, there exist two additional parameter
configurationsintheunderlyingreconfigurationspacewithinterestingrobust-
ness properties. Both new parameter configurations contain feasible regions
that are not covered by the first parameter configuration. The union of all
three feasible regions corresponds to the dynamic robustness.
3.8 Experiments
In this section, the formal methods presented in this chapter are applied
to the example system illustrated in Figure 3.11. The entire system consists
Nicolescu/Model-Based Design for Embedded Systems 67842_C003 Finals Page 83 2009-10-13
Formal Performance Analysis 83
#1
Feasible region configuration #1
16
14
12
10
8
6
4
2
0
Property p
1
(a) (b)
Property p
2
0246810121416
#2
#1
Configuration #1
Feasible regions :
Configuration #3
Configuration #2
#3
16
14
12
10
8
6
4
2
0
Property p
1
Property p
2
0 2 4 6 8 10 12 1614
FIGURE 3.10
Conceptual difference between the SDR and the DDR for two considered
system properties subject to maximization.
Shared memory
HW
IP1 IP2
SigOut
ECU1
eval1ctrl1
eval2ctrl2
calc
ctrl3
exec2
exec1
mon2
mon3
mon1
Multicore ECU
ECU4
CAN Bus
C5
C4
C3
C2
C1
ECU2
ECU3
Sens3
Sens2
Sens1
Act2
Act1
ESP
Parking assistant
FIGURE 3.11
A hypothetical example system.
Nicolescu/Model-Based Design for Embedded Systems 67842_C003 Finals Page 84 2009-10-13
84 Model-Based Design for Embedded Systems
of four ECUs and one multicore ECU that are connected via a CAN bus.
Additionally, there are two IP components that also communicate over the
CAN bus. We assume that two applications from the automotive domain are
running on this platform. The Sensors 1 and 2 collect the ESP-related data,
which are preprocessed on ECU2. These data are then sent to the multicore
ECU where the data are evaluated and appropriate control data are peri-
odically generated based on the evaluated data. These data are then sent to
ECU1 where the commands are processed. Sensor 3 collects data relevant
for a parking-assistant application. The collected data are preprocessed on
ECU3 and sent to ECU4, where the data are further processed before they
are passed as an audio signal to the driver.
In the following, we will assume that these two applications are running
mutually exclusive. For example, as soon as the driver shifts into the reverse
gear, the parking-assistant application (Scenario 2) becomes active, and the
ESP (Scenario 1) is deactivated.
The tasks on ECU1 are scheduled according to a round-robin scheduling
policy, while all other ECUs implement a static-priority preemptive schedul-
ing policy. Core execution and communication times, and the scheduling
parameters (priority and time slot size) of all tasks in the system are specified
in Table 3.1. Additionally, for tasks on the multicore ECU, the memory access
time is explicitly given for each task, to allow considering the contention
on the shared memory. (On single-core ECUs, the memory access time is
contained in the core execution time.) For the communication, we assume
that the transmission mode of the communication layers is direct and that
TABLE 3.1
Core Execution/Communication Time and Memory Access Time
Per Task
Task Exec./Comm. Memory Access Scheduling
HW Name Time (in ms) Time Parameter
Multicore ECU ctrl1 [10:22] [0:2] Prio: High
ctrl2 [20:20] [0:1] Prio: Low
eval1 [12:14] [0:4] Prio: High
eval2 [26:26] [0:6] Prio: Low
ECU1 exec1 [20:20] — Time Slot size: 5
exec2 [30:30] — Time Slot size: 10
ECU2 mon1 [10:15] — Prio: High
mon2 [12:18] — Prio: Low
ECU3 mon3 [20:20] — Prio: High
ECU4 calc [1:1] — Prio: High
ctrl3 [20:20] — Prio: Low
CAN Bus C1 [6:6] — Prio: Highest
C2 [5:5] — Prio: High
C3 [10:10] — Prio: Med
C4 [10:10] — Prio: Low
C5 [7:7] — Prio: Lowest
Nicolescu/Model-Based Design for Embedded Systems 67842_C003 Finals Page 85 2009-10-13
Formal Performance Analysis 85
all sending tasks produce triggering signals. This implies that whenever the
sending tasks produce an output value, the transmission of a message is trig-
gered. We suppose that Sensor 1 produces a new signal every 75 ms, Sensor 2
every 80 ms, and Sensor 3 every 75 ms. The hardware component activating
the task calc on ECU4 performs this calculation every 2 ms and the control
tasks ctrl1 and ctrl2 are activated every 100 ms and 120 ms, respectively.
The system is subject to two end-to-end latency constraints. The latency of
the parking-assistant application (Sens3 → SigOut) may not exceed 150 ms,
whereas the communication between the two IP components (IP1 → IP2)
must not last longer than 35 ms.
3.8.1 Analyzing Scenario 1
Initially, assume that in previous product generations the parking-assistant
application used a dedicated communication bus, and, thus, only the ESP
application initially needs to be contained in the model.
In this setup, when accounting for the communication of the ESP applica-
tion and the communication between the two IP components, the bus load is
only 47.21% and the maximum latency for the communication between IP1
and IP2 is 29 ms. Our analysis yields that all response times and end-to-end
latencies remain within the given constraints.
By using the HEMs, we obtain very accurate input event models for the
receiving tasks (exec1 and exec2). For example, Figure 3.12 illustrates
the maximum number of message arrivals vs. signal arrivals for ECU1.
The upper curve (marked by circles) represents the maximum number of
14
12
10
8
6
4
2
0
0 71 142 213 284 355
Time interval
Event number
426 497 568 639 710
η
+
-frame arrivals
η
+
-signals_ctrl1 η
+
-signals_ctrl2
FIGURE 3.12
Message arrivals at ECU1 vs. signal arrivals.
Nicolescu/Model-Based Design for Embedded Systems 67842_C003 Finals Page 86 2009-10-13
86 Model-Based Design for Embedded Systems
messages that can arrive at ECU1. Using flat event models, we could only
assume that every message contains a new signal for both receiving tasks,
which results in a load of 91.58% of ECU1. With the HEM, we also obtain the
maximum number of messages that contain a signal that was sent by task
ctrl1 (marked by squares), and the maximum number of messages contain-
ing a signal from ctrl2 (marked by triangles). If we now use the timings of
signal arrivals as activation timings of the receiving tasks, we obtain a much
smaller load of only 45% for ECU1.
Hence, the system is not only schedulable, but it also appears that the bus
with less than 50% utilization still has sufficient reserves to accommodate the
additional communication of the parking-assistant application. Especially,
since the time the parking assistant is enabled, the ESP communication is
disabled.
3.8.2 Analyzing Scenario 2
In Scenario 2, Sensors 1 and 2 are disabled, and therefore tasks mon1 and
mon2 are never activated. Consequently, they will not send data to the tasks
eval1 and eval2. The control tasks ctrl1 and ctrl2 are still executed and send
their data to the execution tasks running on ECU1. Their local response times
will slightly decrease, as there will now be no competition for the shared
memory from the second core. On the CAN bus we have the two addi-
tional communication tasks C3andC4, representing the communication of
the parking-assistant application. When we analyze this system, we obtain a
maximum latency of 22 ms for the path IP1 → IP2 and 131 ms for the path
Sens3 → SigOut. Therefore, the system is also schedulable when only the
parking-assistant application is running.
3.8.3 Considering Scenario Change
Having analyzed the two scenarios in isolation from each other, we neglected
the (recurrent) transient overload that may occur during the SC. This may
lead to optimistic analysis results. Thus, the SC analysis is needed to verify
the timing constraints across the SC. In the first experiment, we perform an
SC analysis assuming an “all scenarios in one” execution, that is, all tasks
belonging to both scenario task sets are assumed to be able to execute simul-
taneously. We obtain a maximum latency of 59 ms for the path IP1 →IP2 and
151 ms for the parking-assistant application path (path Sens3 →SigOut). So,
the system is not schedulable, since neither constraint is met. In the second
experiment, we use the compositional scenario-aware analysis presented in
Section 3.5.2 for the timing verification across the SC. We calculate a maxi-
mum latency of 39 ms for the path IP1 → IP2 and 131 ms for the parking-
assistant application path. Thus, we notice that there is an improvement in
the calculated maximum latencies of the constrained application paths. How-
ever, the path IP1 → IP2 slightly exceeds its constraint.
Nicolescu/Model-Based Design for Embedded Systems 67842_C003 Finals Page 87 2009-10-13
Formal Performance Analysis 87
1
0.8
0.6
0.4
0.2
0
Initial value Slack
BUS ECU1 ECU2 ECU3 ECU4
FIGURE 3.13
One-dimensional slack of the resource speeds.
3.8.4 Optimizing Design
As the design is not feasible in its current configuration, we need to optimize
the critical path IP1 → IP2 latency. For this, we can explore the priority
configuration of the communication tasks on the CAN bus. This can be per-
formed automatically on the basis of genetic algorithms (refer to [11] for
details). A feasible configuration is obtained for the following priority order:
C1 > C2 > C5 > C3 > C4. The obtained maximum path IP1 → IP2 latency
is equal to 29. Even though the maximum latency of the parking-assistant
applicationincreasedfrom131to138,thisisstilllessthantheimposedconstraint.
3.8.5 System Dimensioning
According to Section 3.6, the performance slack of the system components
can be efficiently used in order to select hardware components that are opti-
mal with respect to cost. The diagram presented in Figure 3.13 shows the
minimum speed of the CAN bus and the single-core ECUs. The presented
values are relative to the resource speed values in the initial configuration.
These values were individually obtained for each resource, which means that
the speed of only one resource was changed at any one time.
3.9 Conclusion
This chapter has given an overview of state-of-the-art compositional
performance analysis techniques for distributed systems and MPSoCs.
Furthermore, we have highlighted specific timing implications that require
Nicolescu/Model-Based Design for Embedded Systems 67842_C003 Finals Page 88 2009-10-13
88 Model-Based Design for Embedded Systems
attention when addressing the MPSoC setups, hierarchical communication
networks, and SCs. To leverage the capabilities of the overall approach,
sensitivity analysis and robustness optimization techniques were imple-
mented that work without executable code and that are based on robustness
metrics.
By means of a simple example, we have demonstrated that modeling
and formal performance analysis are adequate for the verifying, optimizing,
and dimensioning heterogeneous multiprocessor systems. Many of the tech-
niques presented here are already used in industrial practice [35].
References
1. K. Albers, F. Bodmann, and F. Slomka. Hierarchical event streams and
event dependency graphs: A new computational model for embedded
real-time systems. Proceedings of the 18th Euromicro Conference on Real-
Time Systems, Dresden, Germany, pp. 97–106, 2006.
2. AUTOSAR. AUTOSAR Specification of Communication V. 2.0.1,
AUTOSAR Partnership, 2006. .
3. P. Balbastre, I. Ripoll, and A. Crespo. Optimal deadline assignment for
periodic real-time tasks in dynamic priority systems. In 18th Euromicro
Conference on Real-Time Systems, Dresden, Germany, 2006.
4. I. Bate and P. Emberson. Incorporating scenarios and heuristics to
improve flexibility in real-time embedded systems. In Proceedings of
the IEEE Real-Time and Embedded Technology and Applications Symposium
(RTAS), San Jose, CA, April 2006.
5. J. L. Boudec and P. Thiran. Network Calculus: A Theory of Deterministic
Queuing Systems for the Internet. Springer, Berlin, 2001.
6. S. Chakraborty, S. Künzli, and L. Thiele. A general framework
for analysing system properties in platform-based embedded system
designs. In Proceedings of the IEEE/ACM Design, Automation and Test in
Europe Conference (DATE), Munich, Germany, 2003.
7. P. Emberson and I. Bate. Minimising task migration and priority changes
in mode transitions. In Proceedings of the IEEE Real-Time and Embedded
Technology and Applications Symposium (RTAS), Seatlle, WA, April 2007.
8. J. Filipiak. Real Time Network Management. North-Holland, Amsterdam,
the Netherlands, 1991.
9. O. Gonzalez, H. Shrikumar, J. Stankovic, and K. Ramamritham. Adap-
tive fault tolerance and graceful degradation under dynamic hard
Nicolescu/Model-Based Design for Embedded Systems 67842_C003 Finals Page 89 2009-10-13
Formal Performance Analysis 89
real-time scheduling. In Proceedings of the IEEE International
Real-Time Systems Symposium (RTSS), San Francisco, CA, December
1997.
10. W. Haid and L. Thiele. Complex task activation schemes in system level
performance analysis. In Proceedings of the IEEE/ACM International Con-
ference on HW/SW Codesign and System Synthesis (CODES-ISSS), Salzburg,
Austria, September 2007.
11. A. Hamann, M. Jersak, K. Richter, and R. Ernst. Design space explo-
ration and system optimization with SymTA/S-symbolic timing analysis
for systems. In Proceedings 25th International Real-Time Systems Symposium
(RTSS04), Lisbon, Portugal, December 2004.
12. A. Hamann, R. Racu, and R. Ernst. A formal approach to robustness max-
imization of complex heterogeneous embedded systems. In Proceedings
of the IEEE/ACM International Conference on HW/SW Codesign and System
Synthesis (CODES-ISSS), Seoul, South Korea, October 2006.
13. R. Henia and R. Ernst. Scenario aware analysis for complex event mod-
els and distributed systems. In Proceedings of the Real-Time Systems Sym-
posium, Jucson, AZ, 2007.
14. R. Henia, A. Hamann, M. Jersak, R. Racu, K. Richter, and R. Ernst. Sys-
tem level performance analysis—the SymTA/S approach. IEE Proceed-
ings Computers and Digital Techniques, 152(2):148–166, March 2005.
15. R. Henia, R. Racu, and R. Ernst. Improved output jitter calculation for
compositional performance analysis of distributed systems. Parallel and
Distributed Processing Symposium, 2007. IPDPS 2007. IEEE International,
Long Beach, CA, pp. 1–8, 2007.
16. T. Henzinger and S. Matic. An interface algebra for real-time compo-
nents. In Proceedings of the IEEE Real-Time and Embedded Technology and
Applications Symposium (RTAS), San Jose, CA, April 2006.
17. I. IXP2400. IXP2800 Network Processors.
18. V. Izosimov, P. Pop, P. Eles, and Z. Peng. Design optimization of time-
and cost-constrained fault-tolerant distributed embedded systems. In
Proceedings of the IEEE/ACM Design, Automation and Test in Europe Con-
ference (DATE), Munich, Germany, March 2005.
19. M. Jersak. Compositional performance analysis for complex embedded
applications. PhD thesis, Technical University of Braunschweig, Braun-
schweig, Germany, 2004.
20. B. Jonsson, S. Perathoner, L. Thiele, and W. Yi. Cyclic dependencies in
modular performance analysis. In ACM & IEEE International Conference
Nicolescu/Model-Based Design for Embedded Systems 67842_C003 Finals Page 90 2009-10-13
90 Model-Based Design for Embedded Systems
on Embedded Software (EMSOFT), Atlanta, GA, October 2008. ACM
Press.
21. E. Lee, S. Neuendorffer, and M. Wirthlin. Actor-oriented design of
embedded hardware and software systems. Journal of Circuits Systems and
Computers, 12(3):231–260, 2003.
22. P. Lee, T. Anderson, J. Laprie, A. Avizienis, and H. Kopetz. Fault Toler-
ance: Principles and Practice. Springer Verlag, Secaucus, NJ, 1990.
23. J. Lehoczky. Fixed priority scheduling of periodic task sets with arbitrary
deadlines. In Proceedings of the IEEE Real-Time Systems Symposium (RTSS),
Lake Buena Vista, FL, 1990.
24. J. Lemieux. Programming in the OSEK/VDX Environment. CMP Books,
Lawrence, KS, 2001.
25. C. Lu, J. Stankovic, S. Son, and G. Tao. Feedback control real-time
scheduling: Framework, modeling, and algorithms. Real-Time Systems
Journal, 23(1–2):85–126, 2002.
26. A. Maxiaguine, S. Künzli, S. Chakraborty, and L. Thiele. Rate analysis for
streaming applications with on-chip buffer constraints. In Proceedings of
the IEEE/ACM Asia and South Pacific Design Automation Conference (ASP-
DAC), Yokohama, Japan, pp. 131–136, January 2004.
27. M. Negrean, S. Schliecker, and R. Ernst. Response-time analysis of arbi-
trarily activated tasks in multiprocessor systems with shared resources.
In Proceedings of Design, Automation and Test in Europe (DATE 2009),Nice,
France, April 2009.
28. K. Poulsen, P. Pop, V. Izosimov, and P. Eles. Scheduling and voltage
scaling for energy/reliability trade-offs in fault-tolerant time-triggered
embedded systems. In Proceedings of the IEEE/ACM International Confer-
ence on HW/SW Codesign and System Synthesis (CODES-ISSS), Salzburg,
Austria, October 2007.
29. R. Racu and R. Ernst. Scheduling anomaly detection and optimization for
distributed systems with preemptive task-sets. In 12th IEEE Real-Time and
Embedded Technology and Applications Symposium (RTAS),SanJose,CA,
April 2006.
30. R. Racu, A. Hamann, and R. Ernst. Automotive system optimization
using sensitivity analysis. In International Embedded Systems Symposium
(IESS), Embedded System Design: Topics, Techniques and Trends, Irvine, CA,
pp. 57–70, June 2007. Springer.
31. R. Racu, A. Hamann, and R. Ernst. Sensitivity analysis of complex
embedded real-time systems. Real-Time Systems Journal, 39(1–3):31–72,
2008.