Model-Based Design for Embedded Systems- P24 pptx
Bạn đang xem bản rút gọn của tài liệu. Xem và tải ngay bản đầy đủ của tài liệu tại đây (1.09 MB, 30 trang )
Nicolescu/Model-Based Design for Embedded Systems 67842_C020 Finals Page 666 2009-10-2
666 Model-Based Design for Embedded Systems
Fourier transform can be implemented by one of the numerous fast Fourier
transform (FFT) techniques. The computational order of the FFT for a 2D
input is O(N
2
log
2
N), obviously more efficient when compared to the direct
integration method. We show this speed increase later through an example.
In continuous theory, the angular spectrum method is an exact solution
of the Rayleigh–Sommerfeld formulation. However, when solving the algo-
rithm on a digital computer, a discrete Fourier transform (DFT)mustbe used,
resulting in the accuracy of the angular spectrum method being dependent
on the resolution, or spacing, of the aperture and observation plane meshing.
We call the physical size of the aperture and observation planes the “bound-
ing box,” defining the size of the optical wave front being propagated. Since
the complex wave function is only nonzero for a finite space in the bounding
box, the signal is not always bandwidth limited, and the Nyquist sampling
theory does not always apply. It can be shown, however, that the resolu-
tion of the aperture and observation meshing must be λ/2 or smaller [39].
For many simulation systems without large degrees of tilt and hard diffrac-
tive apertures, the resolution can be coarser. In systems with high tilts, the
resolution is most sensitive. With a mesh spacing of λ/2, the angular spec-
trum decomposition will model plane waves propagating from the aperture
to the observation plane in a complete half circle, that is, between –90 and
+90 degrees.
Other inaccuracies that can occur when using a DFT are aliasing and win-
dow truncation. Aliasing occurs when frequencies exist greater than the criti-
cal sampling frequency. In this case, these high frequencies are “folded over”
into the sampled frequency range [40]. The effect of this is seen in our simu-
lations as optical power “reflecting” off of the walls of the bounding box. If
significant optical power reflects off the wall, interference between the prop-
agating beam and these reflections can occur, resulting in inaccurate optical
waveforms. The same effect can be seen when the bounding box truncates the
signal. Truncation occurs when the waveform propagates into the edges of
the bounding box. The simplest solution to ensure accurate results is having
sufficient zero padding around the optical waveform, reducing the chance
the waveform is aliased or truncated by walls of the bounding box.
In Chatoyant, the user can choose between using the Gaussian or scalar
diffractive (angular spectrum) methods during simulation. The components
in the optical library support both representations in the optical signal
message class. Using these models we can simulate and analyze a variety
of heterogeneous systems as presented in the next section.
20.2.7 Simulations and Analysis of Optical MEM Systems
In this section, we show how Chatoyant can model and simulate complete
mixed-signal systems. The first system uses both electrical and optical sig-
nals to simulate a complete “4f” optoelectronic link which uses a four focal
length image relaying optical system. The second example, building from the
Nicolescu/Model-Based Design for Embedded Systems 67842_C020 Finals Page 667 2009-10-2
CAD Tools for Multi-Domain Systems on Chips 667
two signal 4f link, adds mechanical signals for simulation and analysis of an
optical MEM system. This set of example systems is centered on an optical
MEM scanning mirror. With this device we are able to simulate an optical
scanning system and a self-aligning optical detection system. These systems
show the ability to model a mixed system of mechanical MEMs, optics, and
electronic feedback. The last example shows the power of the angular spec-
trum technique to model diffractive optical systems with the speed and accu-
racy required to perform system-level design.
20.2.7.1 Full Link Example
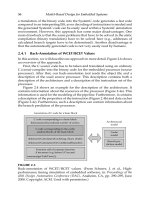
A complete optoelectronic simulation of a 4f optical communication link in
Chatoyant is presented in Figure 20.12. The distance between the vertical
cavity surface emitting laser (VCSEL) array and the first lens and the dis-
tance between the second lens and the detector array are both 1 mm. The
distance between the lenses is 2 mm, with both lenses having a focal length
of 1 mm, giving a 4f system. The top third of the figure shows the system
as represented in Chatoyant. Each icon represents a component model, and
each line represents a signal path (either optical or electrical) connecting the
outputs of one component to the inputs of the next. Several of the icons, such
as the VCSELs and receivers, model the optoelectronic components them-
selves, while others, such as the output graph, are used to monitor and dis-
play the behavior of the system. The input to the system is an electrical signal
with speed varying from 300 MHz to 1.5 GHz. A Gaussian noise with vari-
ance of 0.5 V has been added to the multistage driver system to show the
ability of our models to respond to arbitrary waveforms.
In the center of the figure, three snapshots (before the VCSEL, after the
VCSEL, and after the detector) show the behavior of the CMOS drivers under
Digital
Driver
Gaussian waist analysis
Power analysis
VCSEL
4f optical system
PGM
+
Receiver
FIGURE 20.12
Chatoyant analysis of optoelectronic 4f communications link.
Nicolescu/Model-Based Design for Embedded Systems 67842_C020 Finals Page 668 2009-10-2
668 Model-Based Design for Embedded Systems
a 300 MHz noisy signal. In these snapshots, one can see the amplification
of the system noise through the CMOS drivers, the clipping of subthreshold
noise in the VCSEL, and the frequency response on the quality of the received
signal. This last observation is better seen in the three eye diagrams, shown
at the bottom of Figure 20.12, analyzed at 300 MHz, 900 MHz, and 1.5 GHz.
For the component values chosen, the system operates with reasonable BER
up to about 1 GHz.
For this 4f system, the VCSEL and driver circuits explicitly model the
effects of bias current and temperature on the optoelectric conversion, L-I
efficiency, of the lasers. Figure 20.13 shows the effects of temperature, T,and
current bias, I
b
, on the bit error rate (BER) of the link. Generally, the fre-
quency response of the link is dominated by the design of the receiver circuit;
however it is interesting to note that both the VCSEL temperature and bias
have a significant effect on system performance, because of their impact in
the power through the link. Perhaps most interesting is the fact that increas-
ing bias current does not always correspond to better performance over the
whole range of frequencies examined. Note that the curve for 1 mA bias
offers the best performance below 600 MHz; however, the 0.5 mA bias (the
nominal threshold of the VCSEL) crosses the curve for 1 mA and achieves
the best performance at higher frequencies.
As an example of mechanical tolerancing, we analyze the system with
varying-sized photodetectors (50, 30, and 20 μm). The detectors are displaced
from +
10 μmto+100 μm in detector position along the axis of optical prop-
agation. This results in defocusing of the beam relative to the detector array.
We calculate both the insertion loss and the worst case optical crosstalk as
the detectors are displaced. The results are shown in Figure 20.14. Systems
can be further analyzed for their sensitivity to mechanical tolerances using a
Monte Carlo tolerancing method described in [8,9].
Two additional analyses are also shown in the Chatoyant representation
in Figure 20.12. The first is the beam profile analysis, which graphically dis-
plays one beam’s waist as it propagates between components, showing the
possibility of clipping at the lenses. The second analysis shows the optical
signals as they strike the detector array. This analysis also gives the user the
amount of optical power captured on each of the detectors. From this analy-
sis, optical crosstalk and system insertion loss can be calculated.
20.2.7.2 Optical Beam Steering/Alignment System
A torsion-scanning mirror is a micromachined 2D mirror built upon a
micro-elevator by self assembly (MESA) structure [41,42]. The mirror and
MESA structures are shown in Figure 20.15a and b, respectively. The scan-
ning mirror can tilt along the torsion bars in both the x and y directions
and is controlled electrostatically through four electrodes beneath the mirror,
outlined in Figure 20.15a by the dashed boxes. For example, the mirror tilts in
the positive x direction when voltage is applied to electrodes 1 and 2, and the
Nicolescu/Model-Based Design for Embedded Systems 67842_C020 Finals Page 669 2009-10-2
CAD Tools for Multi-Domain Systems on Chips 669
BER vs. frequency at VCSEL temperatures
1.E–20
1.E–16
1.E–12
1.E–08
BER
1.E–04
1.E+00
100 300 500 700 900 1100 1300 1500
BER (T =40 C)
BER (T =70 C)
BER (T =100 C)
1.E –20
1.E –16
1.E –12
1.E –08
1.E –04
1.E +00
BER vs. frequency at various current bias
BER
100 300 500 700 900 1100 1300 1500
BER (lb =0.1 mA)
BER (lb =0.25 mA)
BER (lb =1.0 mA)
BER (lb =1.5 mA)
BER (lb =0.5 mA)
Frequency (MHz)
Frequency (MHz)
FIGURE 20.13
BER versus frequency at different VCEL temperatures and current biases.
0
10
+m displaced in optical axis
Crosstalk (dB)
Crosstalk vs. detector displacement
30 50 70
–25
–50
–75
–100
50 um Det
20 um Det
30 um Det
Insertion loss vs. detector displacement
10 30 50 70
0
–3
–6
–9
–12
–15
–18
Insertion loss (db)
±m displaced in optical axis
50 um Det 30 um Det 20 um Det
FIGURE 20.14
Insertion and crosstalk versus mechanical tolerancing. (From Kurzweg, T.P.
et al., J. Model. Simul. Micro-Syst., 2, 21, 2001. With permission.)
mirror tilts in the negative y direction when voltage is applied to electrodes
1and4.
The MESA structure is shown in Figure 20.15b. The mirror is elevated by
four scratch drive actuator (SDA) sets pushing the support plates together,
allowing for the scanning mirror to buckle and rise up off the substrate [43].
The MESA structure’s height is required to be large enough such that the tilt
of the mirror will not cause the mirror to hit the substrate. Post fabrication
system alignment can also be performed by the MESA structure.
Figure 20.16 shows a drawing of the torsion-scanning mirror system. On
the left one can see one VCSEL emitting light vertically through a lenslet,
and a prism that reflects off a plane mirror. The light is then reflected off
of the optical MEM scanning mirror, back to the plane mirror, and captured
through a lenslet and prism onto detectors on the right. With the flexibility
of the scanning mirror, this system could act as a switch, an optical scanner,
Nicolescu/Model-Based Design for Embedded Systems 67842_C020 Finals Page 670 2009-10-2
670 Model-Based Design for Embedded Systems
(a)
23
14
(b)
x
y
FIGURE 20.15
(a) Scanning torsion mirror, (b) MESA structure. (From Kurzweg, T.P. et al.,
CAD for optical MEMS, Proceedings of the 36th IEEE/ACM Design Automation
Conference (DAC’99), New Orleans, LA, June 20–25, 1999. With permission.)
FIGURE 20.16
Scanning mirror system. (From Kurzweg, T.P. et al., CAD for optical MEMS,
Proceedings of the 36th IEEE/ACM Design Automation Conference (DAC’99),
New Orleans, LA, June 20–25, 1999. With permission.)
or a reconfigurable optical interconnect. We have simulated systems using
this scanning mirror configuration for switching and self-alignment through
optical feedback. We first demonstrate an optical scanning system.
In this scanning system, we simulate a single source beam propagating
through the 3 × 3 subsystem seen in Figure 20.16. With the appropriate volt-
age levels applied to the four electrodes, the scanning mirror tilts and directs
the source to any of the nine detectors. This system, as represented in Chatoy-
ant, is shown in Figure 20.17. The SDA arrays move the mirror to the correct
height for alignment. We control the electrodes with a waveform generator,
which applies the appropriate voltages on the four electrodes for the beam
to scan or switch in a desired pattern.
As an example, we are able to scan a diamond pattern with the wave-
forms shown in Figure 20.18. The desired pattern is shown by the white
arrow trace on the first output image. The other nine images show snapshots
of the detector plane as the diamond pattern is scanned. Dashed lettered
lines correspond to time intervals in the waveforms and in the snapshots.
Mechanical alignment is critical in this system. For example, the lenslets in
this simulation are only 100 μm in diameter. Therefore, when steering the
Nicolescu/Model-Based Design for Embedded Systems 67842_C020 Finals Page 671 2009-10-2
CAD Tools for Multi-Domain Systems on Chips 671
UCSEL
Prism Mirror Mirror Prism
Powergrid
Const
SDA
FIGURE 20.17
Scanning system as represented in Chatoyant. (From Kurzweg, T.P. et al., CAD for optical MEMS, Proceedings of the 36th
IEEE/ACM Design Automation Conference (DAC’99), New Orleans, LA, June 20–25, 1999. With permission.)
Nicolescu/Model-Based Design for Embedded Systems 67842_C020 Finals Page 672 2009-10-2
672 Model-Based Design for Embedded Systems
A
xv 3.10a: xv 3.10a: xv 3.10a: xv 3.10a: xv 3.10a:
xv 3.10a:xv 3.10a:xv 3.10a:xv 3.10a:xv 3.10a:
BCDE
Electrode 4
Electrode 3
Electrode 1
Electrode 2
ABCDE
FIGURE 20.18
Scanning waveforms and scanned diamond pattern. (From Kurzweg, T.P.
et al., CAD for optical MEMS, Proceedings of the 36th IEEE/ACM Design
Automation Conference (DAC’99), New Orleans, LA, June 20–25, 1999. With
permission.)
beam, precision in the voltage waveforms is needed so that the light, bend-
ing through the prism, hits the desired detector’s lenslet.
We next simulate a self-aligning system using optical feedback, using the
same system setup as seen in Figure 20.16. Such a system could be used as a
noise suppression system. The scanning mirror is used to actively align the
system, with the electrodes now being controlled by a waveform generator
with a programmed control algorithm. The waveform generator receives the
power values detected on each of the detectors, determines where the beam
is, and which electrodes to apply voltage to in order to steer the beam onto
the center detector.
The system is considered aligned when the power detected on the center
detector matches a threshold value set by the user. The user also specifies, in
the control algorithm, the size of the voltage step that will be placed on the
corresponding electrodes. With active feedback, the system will keep step-
ping enough voltage to the electrodes until the beam is steered onto the cen-
ter detector and the system is aligned. The system, as displayed in Chatoyant,
is shown in Figure 20.19.
Nicolescu/Model-Based Design for Embedded Systems 67842_C020 Finals Page 673 2009-10-2
CAD Tools for Multi-Domain Systems on Chips 673
Const
FIGURE 20.19
Self-aligning system using optical feedback. (From Kurzweg, T.P. et al., J. Model. Simul. Micro-Syst., 2, 21, 2001. With permis-
sion.)
Nicolescu/Model-Based Design for Embedded Systems 67842_C020 Finals Page 674 2009-10-2
674 Model-Based Design for Embedded Systems
(c)
Time
(b)
Time
(a)
Time
xv 3.10a: xv 3.10a: xv 3.10a: xv 3.10a: xv 3.10a:
xv 3.10a:xv 3.10a:xv 3.10a:xv 3.10a:xv 3.10a:xv 3.10a:xv 3.10a:
xv 3.10a: xv 3.10a: xv 3.10a: xv 3.10a: xv 3.10a: xv 3.10a:
FIGURE 20.20
Self-alignment results. (From Kurzweg, T.P. et al., J. Model. Simul. Micro-Syst.,
2, 21, 2001. With permission.)
To simulate this self-aligning system, we introduced random offsets in
the lenses and in the VCSEL position and observe as the beam moves toward
focus on the center detector. Snapshots of the image at the detectors are given
in Figure 20.20 for three cases. The first results, shown in Figure 20.20a, are
when the second lens is offset 35 μminthex-direction. Figure 20.20b shows
the results of the second lenslet offset in both the −x-andy-direction by 35
μm. The final case has both lenses offset. The first is offset by 5 μminthe
x-direction, and the second lens is offset by 35 μminthe−x-direction and 5
μminthey-direction. The results are seen in Figure 20.20c. Notice that the
beam on the final images is not exactly in the center of the middle detector.
This is because of the power being detected at this point exceeding the power
threshold (98.6%) we set for alignment.
20.2.7.3 Angular Spectrum Optical Simulation of the Grating Light Valve
In this section, we simulate and analyze a grating light valve (GLV) sys-
tem in Chatoyant. This device has many display applications, including
digital projection, HDTV, and vehicle displays. The GLV is simply a MEM
Nicolescu/Model-Based Design for Embedded Systems 67842_C020 Finals Page 675 2009-10-2
CAD Tools for Multi-Domain Systems on Chips 675
(micro-electrical-mechanical) phase grating made from parallel rows of
reflective ribbons. When all the ribbons are in the same plane, incident light
that strikes normal to the surface reflects 180 degrees off the GLV. However,
if alternating ribbons are moved down a quarter of a wavelength, a “square-
well” diffraction pattern is created, and the light is reflected at an angle from
that of the incident light. The angle of reflection depends on the width of the
ribbons and the wavelength of the incident light. Figure 20.21 shows the rib-
bons, from both a top and side view, and also the reflection patterns for both
positions of the ribbons.
The GLV component is fabricated using standard silicon VLSI technol-
ogy, with ribbon dimensions approximately 3–5 μm wide and 20–100 μm
long [44]. Each ribbon moves through electrostatic attraction between the
ribbon and an electrode fabricated underneath the ribbon. This electrostatic
attraction moves the ribbons only a few hundred nanometers, resulting in an
approximate switching time of 20 ns. Since the GLV depends on a diffrac-
tive phenomenon to direct the light beam, a rigorous modeling technique is
required for modeling the GLV system.
For the simulation of the GLV, we examine one optical pixel. A projected
pixel is diffracted from a GLV composed of four ribbons, two stationary and
two that are movable [44]. Each ribbon has a length of 20 μmandawidth
of 5 μm. Ideally, there is no gap between the ribbons, however, in reality, a
gap is present and is a function of the feature size of the fabrication. Although
this gap can be modeled in our tool, in these simulations, we provide an ideal
GLV simulation with no gap.
The GLV is modeled as a phase grating, where the light that strikes the
down ribbons propagates a half of a wavelength more than the light that
strikes the up ribbons. In our model, light reflecting from the down ribbons
is multiplied by a phase term. The phase term is similar to a propagation
term through a medium: U
down_ribbon
= U exp(j2kd), where d is the distance
that the ribbon is moved toward the substrate, typically λ/4 for the GLV.
Far-field diffraction theory states that the diffracted angle reflected from
the square-well grating is [36]: θ = qλ/a, where q is the diffraction mode
Down ribbons
(a)
Up ribbons
(b)
Incident Reflected
(c)
Incident
Reflected
Reflected
1/4 λ
Ribbons
FIGURE 20.21
GLV device (a) top view and side view operation for, (b) up ribbons and, (c)
down ribbons.
Nicolescu/Model-Based Design for Embedded Systems 67842_C020 Finals Page 676 2009-10-2
676 Model-Based Design for Embedded Systems
(0, +
1, +2, +3, ),a is the period of the diffractive grating, and θ is in radians.
In the special case of a square well, when light is diffracted by a grating with
a displacement of λ/4 (a λ/2 optical path difference after reflection), all the
optical power is diffracted from the even modes into the odd modes [45].
In the first simulation, the standard operation of the GLV is verified. We
assume an incident plane wave of green light (λ
green
520 nm) striking the
grating, with the square-well period defined by the ribbon width, and no
gap. We simulate the GLV in both cases, that is, when all the ribbons are on
the same plane and when the alternating ribbons are moved downward a
distance of λ/4. In this example, the light is reflected off of the grating and
propagated 1000 μm to an observation plane. A bounding box of 400 × 400
μmisused,withN equal to 2048. Intensity contours of the observation plane
are presented in Figure 20.22a and b.
When the grating is moved into the down position, all of the optical
power is not transferred into the expected odd far-field diffractive modes.
This is seen in the center of Figure 20.22b, as small intensity clusters are
scattered between the +
1
st
modes. This scattering is a near-field effect and
demonstrates that in this system, light propagating 1000 μm, is not in the
far field. If a designer used a tool propagating with the Fraunhofer far-field
approximations, these scattering effects would not be detected. For exam-
ple, when running the same simulation on LightPipes [46], a CAD tool using
the Fraunhofer approximation for optical propagation, only the far-field pat-
tern of light diffracted into the 1
st
and 3
rd
modes is seen, as presented in
Figure 20.22c. When comparing this result to Figure 20.22b, it is shown that
far-field approximation is not valid for this propagation distance. Through
this example we have shown that using the angular frequency technique, we
achieve the full Rayleigh–Sommerfeld accuracy, while obtaining the same
computational speed of using the Fraunhofer approximation.
To show the advantage of the angular spectrum method, we compare the
run time of the above simulation with the run time using the direct inte-
gration method. With N = 2048, the FFT simulation takes about 1.5 min.
–0.0002 0.0 0.0002
0.0002
0.0
–0.0002
0
th
mode
(a)
–0.0002 0.0 0.0002
0.0002
0.0
–0.0002
+_1
st
mode
+_3
rd
mode
(c)
(b)
–0.0002 0.0 0.0002
0.0002
0.0
–0.0002
+_1
st
mode
+_3
rd
mode
FIGURE 20.22
GLV operation (a) all ribbons up, (b) alternating ribbons down, (c) Fraun-
hofer approximation.
Nicolescu/Model-Based Design for Embedded Systems 67842_C020 Finals Page 677 2009-10-2
CAD Tools for Multi-Domain Systems on Chips 677
1.2
1.0
0.8
0.6
0.4
0.2
0.0
0 50 100
Ribbon movement vs. 1
st
mode power efficiency
Ribbon movement (nm)
Power efficiency
(au)
150
λ/4
200
FIGURE 20.23
Transient analysis of ribbon movement and intensity contours.
The direct integration technique takes approximately 5.5 days to finish. If N
is reduced to 1024, the simulation completes in approximately 25 s, whereas
the direct integration simulation takes approximately 32 h. These simulations
were run on a 1.7 GHz dual-processor PC running Linux, with 2 GB of main
memory.
In the next simulation, we perform a transient sweep of the ribbon move-
ment, from 0 to 150 nm. The rest of the system setup is exactly the same
as before. However, this time, we simulate the normalized power efficiency
captured in the 1
st
diffraction mode for different ribbon depths. To simu-
late this, a circular detector (radius = 12.5 μm) is placed on the positive 1
st
mode. Figure 20.23 is a graph that shows the simulated normalized power
efficiency in this first mode. As the ribbons are moved downward, more opti-
cal power is diffracted into the nonzero modes. As the ribbons reach the λ/4
point, almost all the diffractive power is in the +
1
st
mode. Figure 20.23 also
includes intensity contours of selected wave fronts during the transient sim-
ulation, along with the markings of the system origin and circular detector
position. From these wave fronts, interesting diffractive effects can be noted.
As expected, when there is little or no ribbon movement, all the light is in the
0
th
mode. However, with a little ribbon movement, it is interesting to note
that the 0
th
mode is “steered” at a slight angle from the origin. As the ribbons
move downward about λ/8, the energy in the +
1
st
modes are clearly defined.
As the gratings move closer to the λ/4 point, the power is shifted from the
0
th
mode into the +1
st
modes, until there is a complete switch. As the ribbons
move past the λ/4 point, optical power shifts back into the 0
th
mode.
In the final simulation, we present a full system-level example as we
expand the system to show a complete end-to-end link used in a config-
uration of a color projection system. The system is shown in Figure 20.24.
Nicolescu/Model-Based Design for Embedded Systems 67842_C020 Finals Page 678 2009-10-2
678 Model-Based Design for Embedded Systems
GLV
Color wheel
Lens ( f=500 µm)
Detector
Input light
1000 µm
Prism
Screen (70 µm)
FIGURE 20.24
End-to-end GLV display link.
In this system, we model light, passing through a color wheel, striking a
prism, reflecting off the GLV device, past a screen, focused by a lens, and
striking a detector [44]. In this system, when the GLV ribbons are all up,
the screen blocks the light’s 0
th
mode and the pixel is not displayed. When
the alternating ribbons are pulled down, the lens focuses the light found
in the +
1
st
modes and converges them to the center of the system, display-
ing the pixel. Using a spinning color wheel to change the wavelength of the
incident light, a frame-sequential GLV projection system uses red (680 nm),
green (530 nm), and blue (470 nm) light on the same grating. Since the same
grating is used for all wavelengths of light, the grating movement is tuned
for the middle frequency: 130 nm (λ
green
/4). During this simulation, we use
a hybrid approach for the optical modeling. For the propagation through
the color wheel and the prism, we use Gaussian propagation. Since propa-
gating through these components does not diffract the beam, this Gaussian
technique is not only efficient, but valid. However, as soon as the light prop-
agates past the prism component, we switch the optical propagation tech-
nique to our full scalar method to accurately model the diffraction off the
GLV device. The remainder of the simulation is propagated with the scalar
technique.
We analyze the system by looking at the amount of optical power that is
being received on a centered circular detector (radius 10 μm) for the different
wavelengths of light, since we are using the same GLV that is tuned for
the green wavelength for all wavelengths. A sweep of the distance between
the focusing lens and the detector plane is simulated for 0–1500 μm,
when the GLV ribbons are pulled down. The graph in Figure 20.25 shows
the normalized power received on the circular detector for each wavelength
along with selected intensity contours of the green wave front as the beam
propagates past the lens. For clarity, the detector’s size and position is added
onto the intensity contours. For distances under 600 μm, the light remains in
Nicolescu/Model-Based Design for Embedded Systems 67842_C020 Finals Page 679 2009-10-2
CAD Tools for Multi-Domain Systems on Chips 679
–5e –05
5e –05
0
–5e –05
5e –05
0
–5e –05
5e –05
0
Normalized power efficiency vs. distance between lens
and detector plane
Optical efficiency (au)
1.2
1.0
0.8
0.6
0.4
0.2
0.0
0 500 1000
Distance between lens and detector (µm)
1500
Green Red Blue
FIGURE 20.25
Wavelength power versus distance propagated.
its two positive and negative 1
st
modes, as the convergence of the beams has
not occurred, resulting in zero power being received on the center detector.
As expected, each of the wavelengths focuses at a different rate, as shown by
each wavelength’s specific curve in Figure 20.25. However, it is seen that all
wavelengths focus and achieve detected maximum power at a distance past
the lens of 1000 μm, or twice the lens’ focal length. At this point, all three
colors project on top of each other, creating a color pixel in the focal plane.
With additional optics, this focal plane can be projected to a screen outside
the projector. This simulation has shown that the grating, although tuned for
the green wavelength, can be used for all three wavelengths.
Having shown the use of Chatoyant for modeling multi-domain ana-
log systems, we now turn to the problem of co-simulation between the
framework described above and a traditional HDL simulator. Co-simulation
requires the solution of two problems at the interface between the simula-
tors. First, a consistent model of time must be reached for when events occur.
Second, a consistent model of signal values must be developed for signals
crossing the interface. This is the subject of the next section.
20.3 HDL Co-Simulation Environment
The two levels of simulation discussed above, component and analog
system that are supported by Chatoyant, have not been optimized to
Nicolescu/Model-Based Design for Embedded Systems 67842_C020 Finals Page 680 2009-10-2
680 Model-Based Design for Embedded Systems
simulate designs that are specified in an HDL such as Verilog or VHDL.
There are no components in the Chatoyant library that directly use HDL as
an input language. On the other hand, there are many available commer-
cial and research mixed-language HDL simulators. Mixed-language refers to
the ability for a simulator to compile and execute VHDL, Verilog, and Sys-
temC (or other C/C++ variants). In an earlier work we investigated the use
of CoSim with Chatoyant models [47]. In this section, we explore an interface
to a commercial system. Cadence, Mentor Graphics, Synopsys, and other
EDA companies provide such simulators. One common feature among the
more widely used simulators, such as ModelSim and NCSIM, is the abil-
ity to execute C-based shared object files embedded in HDL design objects.
These simulators provide an application programmer’s interface (API) to
gain access to simulator data and control design components. ModelSim
was chosen since it has a large set of C routines that allow access to sim-
ulator state as well as modifying design signals and runtime states. These
functions and procedures are bundled in an extension package known as
the foreign language interface (FLI) [48]. By creating a co-simulation envi-
ronment between ModelSim and Chatoyant, a powerful MDSoC design
and verification environment has been created. This environment is able
to address the demand for a robust and efficient system architecture/
design space exploration and prototyping tool that can support the design of
MDSoCs.
The rest of this chapter focuses on the development of the interface
between Chatoyant and ModelSim and the performance of the resulting
environment.
20.3.1 Architecture
The architecture of the co-simulation environment is kept simple to be as
efficient and accurate as possible. There are two phases to the execution of
the environment: a system generation phase and a runtime support environ-
ment. Each is a standalone process, but both are required for system simula-
tion. Figure 20.26 illustrates this top-level structure.
20.3.1.1 System Generator
The System Generator allows the user to create the necessary files needed
by both Chatoyant and ModelSim. For Chatoyant this includes a common
header and object file used in both simulators as well as components (stars)
used for the Chatoyant side of the interface. The same header and object file
are used for ModelSim
,
in addition to a shared object library file that is used
for invoking the ModelSim FLI when ModelSim is loaded and elaborates a
design.
The main input to this generator is the top-level or interface-specific
VHDL file. This file contains the list of ports that represent the main conduit
Nicolescu/Model-Based Design for Embedded Systems 67842_C020 Finals Page 681 2009-10-2
CAD Tools for Multi-Domain Systems on Chips 681
Top -level
VHDL file
Wrapper
VHDL
FLI share
object file
System generator
Chatoyant
Co-simulation runtime
system
ModelSim
Definitions
library
Chatoyant
star
FIGURE 20.26
Co-simulation top-level structure.
between the digital domain running within ModelSim and the other domains
handled in Chatoyant. When this file is loaded by the System Generator,
the entity portion of the VHDL is parsed and a linked list of the ports is
created. Each node in this linked list contains the port’s name, its direction
(in/out/bidirectional), and its width (1 bit for a signal and n bits for a bus).
Using a graphical user interface, the user can select which ports to include
and the mapping for the analog voltage levels to be converted into and out of
the MVL9 (Multi-Value Logic 9 signal representation standard) logic repre-
sentation used by ModelSim. There are four fields for this including a high,
a low, a cutoff for high, and a cutoff for low voltage values. The user also
specifies a name for the system, used for code generation and library man-
agement. The outputs of the generator phase are the component star file for
Chatoyant, the FLI source code for the ModelSim FLI, the header and source
files for a common resource library for the system, a makefile for remaking
the object files, a usage text file, and the first time compilation object files
performed at the end of the generation.
With these files in place, the user can then proceed with the execution of
the linked simulators.
20.3.1.2 Runtime Environment: Application of Parallel Discrete
Event Simulation
The runtime system differentiates itself from other typical co-simulation
environments in that there is no central simulation management system.
Chatoyant and ModelSim are treated as two standalone processes and
Nicolescu/Model-Based Design for Embedded Systems 67842_C020 Finals Page 682 2009-10-2
682 Model-Based Design for Embedded Systems
communicate only between themselves. This reduces the overhead of
another application executing along with the two simulators as well as the
additional message traffic produced by such an arbiter.
This philosophy is an application of a general parallel discrete event sim-
ulation (PDES) system. Since there are two standalone processes, each is
treated as if it were its own DE processing node. Without a central arbiter,
the two must (1) exchange event information by converting logic values into
voltages and vice versa, and (2) synchronize their respective local simula-
tion times. To exchange the event information, the system uses technology-
specific lookup tables, created by the System Generator, that provide the
conversion between a logic “1” and a logic “0” to a voltage in addition to
determining what voltage level constitutes a logic “1” and “0.”
The synchronization of the simulators is where the application of PDES
methods enters [49]. The asynchronous DE simulation invokes both simula-
tors to perform unique tasks on separate parts of a design in a nonsequential
fashion. This is because of the fact that there is no master synchronization
process as in [1]. For synchronization and scheduling there are two major
approaches one can take, conservative or optimistic. We discuss our choice
next.
20.3.1.3 Conservative versus Optimistic Synchronization
The conservative and optimistic approaches solve the parallel synchroniza-
tion problem in two distinct ways. This problem is defined in [2] as the
requirement for multiple processing elements to produce events of an equal
timestamp in order to not violate the physical causality of the system. The
conservative method solves this problem by constraining each processing
node to remain in synchronicity with the others, never allowing one simula-
tor’s time to pass any other simulator. This can have the penalty of reducing
the performance of a simulation by requiring extra overhead in the form of
communication and deadlock avoidance.
The optimistic approach breaks the rule of maintaining strict causality
by allowing each processing element to simulate without considering time
in other processing element. This means that the simulators can run freely
without having to synchronize, with the exception of communicating explicit
event information. If, however, there is an event sent from one simulator to
the other, and the second simulator has a local current time greater than the
event’s timestamp, then the receiving simulation process must stop and roll-
back time to a known safe state that is before the timestamp of the incoming
event. This approach requires state saving as well as rollback mechanisms.
This can be costly in terms of memory usage and processing overhead for
determining and recalling previous states, and thus increases the processing
time of every event.
Both approaches are possible since ModelSim does have check-pointing
and restoring methods available [48]. However, the conservative PDES
Nicolescu/Model-Based Design for Embedded Systems 67842_C020 Finals Page 683 2009-10-2
CAD Tools for Multi-Domain Systems on Chips 683
method was chosen as the underlying philosophy for our co-simulation
solution. Two factors went into this decision. The first consideration is
that the co-simulation environment is executing as two processes on one
workstation, so that exchanging timing information is not as costly as in a
large physically distributed simulation environment. The second is that even
with a dual-processor workstation, there is not an excess of computational or
memory resources that is seen in a truly distributed PDES architecture, and
therefore, a rollback would be too costly.
This was confirmed with a preliminary test of the fiber image guide sys-
tem described below. For that system the amount of data required for a
checkpoint file was on the order of 1 to 2MB. With an average of 10 check-
point files needed to keep the two simulators within a common time horizon,
rollback time took between 500 ms and 1.5 s.
On the other hand, the conservative approach gives a solution requir-
ing significantly less memory at the expense of increased communication to
ensure that both simulators are consistently synchronized. This becomes a
matter of passing simple event time information between the two simulators.
Thus, the only real design issue becomes the time synchronization method.
20.3.1.4 Conservative Synchronization Using UNIX IPC Mechanisms
As described in more detail below, the system was developed and tested on a
Linux-based workstation. Therefore, UNIX-style IPC is used for the commu-
nication architecture. Event information is exchanged using shared memory,
and synchronization is achieved by using named pipes in blocking mode.
This is similar to the synchronized data transfer and blocking methodology
described in [50]. With these two mechanisms, the conservative approach is
implemented in the two algorithms seen in Figure 20.27.
The algorithm for the co-simulation is straightforward. Both simulators,
running concurrently, reach a point in their respective execution paths where
they enter the interface code in Figure 20.27. Both check to ensure that they
are at the next synchronization point (next_sync), and if they are not, they
exit this section of code and continue. If they are at the next synchroniza-
tion point, defining the safe-point in terms of the conservative approach in
PDES, then Chatoyant starts the exchange by checking for any change in its
outputs to ModelSim. If there is any change in any bit of these ports, that
port is marked dirty, and a change flag is set. When all the ports have been
examined, Chatoyant sends ModelSim either a ModelSim_Bound event, if
any port changed value, or a No_Change event.
Simultaneously, ModelSim waits for this event message from Chatoyant.
Once received, it will update and schedule an event for those ports with dirty
flags set, if any. It then jumps to check its own output ports, checking bit by
bit for a change in each port’s value. Once again, as in Chatoyant, if there is a
difference, the dirty flag for that port is set, and the change flag in ModelSim
is set true. Once this is done for every port, ModelSim will send a message to
Chatoyant that there is either a change (Chatoyant_Bound) or No_Change.
Nicolescu/Model-Based Design for Embedded Systems 67842_C020 Finals Page 684 2009-10-2
684 Model-Based Design for Embedded Systems
Chatoyant ModelSim
If(time <next_sync)
If(time <next_sync)
If(Response == No_Change)
<check outputs>;
Else
For each input:
For each output:
For each bit in signal:
If(cur[i] ! =new[i])
mark dirty;
flag change;
End If;
End For each bit;
End For each output;
If(change){
send(Chatoyant_Bound);
Else
send(No_Change);
end If;
Synchronize:
next_sync =now + SYNC_PULSE;
Wait(Chatoyant Finished);
Send(ModelSim_Finished);
Done with iteration;
If(input.dirty)
update local value;
ScheduleEvent();
clear input.dirty;
End If;
End For each input;
End If;
return at a later time;
return at a later time;
Wait(Chatoyant_Response);
If(change){
send(ModelSim_Bound);
Else
send(No_Change);
end If;
Wait(ModelSim_Response); // Blocking
If(Response ==No_Change)
goto Synchronize;
Else
For each input:
If(input.dirty)
update local value;
ScheduleEventToPorthole();
clear input.dirty;
End If;
End If;
End for each input;
Synchronize:
next_sync =now + SYNC_PULSE;
Send(Chatoyant_Finished);
Wait(ModelSim_Finished);
Done with iteration;
mark dirty;
flag change;
For each output:
For each bit in signal:
If(cur[i] ! =new[i])
End If;
End For each bit;
End For each output;
FIGURE 20.27
The synchronization in both simulators.
Chatoyant, waiting for this response, will receive it and take action sim-
ilar to that of ModelSim in updating the inputs from ModelSim. Finally, the
two will set their respective next synchronization times and handshake with
one another to indicate it is safe to continue simulating. The No_Change mes-
sages are analogous to the null message passing scheme defined by Chandy
and Misra [49], which has the benefit of avoiding simulation deadlock.
A key point is the concept of the next synchronization time (next_sync).
This value is calculated based on a global parameter in the co-simulation
Nicolescu/Model-Based Design for Embedded Systems 67842_C020 Finals Page 685 2009-10-2
CAD Tools for Multi-Domain Systems on Chips 685
environment known as the SYNC_PULSE. This parameter defines the
resolution of how often synchronization occurs. This value ultimately defines
the speed versus accuracy tradeoff ratio between the simulators. A higher
resolution (smaller SYNC_PULSE value) means greater accuracy but slower
runtime. Depending on a particular system, this could affect the quality of
the simulation results.
20.3.2 Co-Simulation of Experimental Systems
To examine the effects of synchronization resolution on speed and accuracy,
we simulate two example MDSoC systems. Both are large-scale systems,
meaning there are many components in each domain, including multi-
ple analog circuits, complex optics, and mixed wire and bus interconnects
between the digital and analog domains.
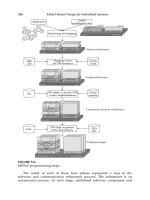
20.3.2.1 Fiber Image Guide
The first of these systems is the fiber image guide, or FIG, system developed
at the University of Pittsburgh [51]. FIG is a high-speed 64 × 64-bit opto-
electronic crossbar switch built using an optical multi-chip module. FIG uses
guided wave optics, analog amplification and filtering circuits, and digital
control logic to create an 8 × 8, 8-bit bus crossbar switch. The switch is built
as a multistage interconnection network (MIN) built with a shuffle-exchange
architecture. The shuffle operations are performed by the wave guide, and
the digital logic performs the exchange switching operation. Analog circuits
amplify the digital signals and drive VCSEL arrays which in turn transmit
light through the image guide. Photodetectors are used to convert the light
back into an analog signal, which is amplified and fed back into the digital
domain.
This system, illustrated in Figure 20.28, exercises the ability of the
co-simulation environment to handle buses as well as the communications
between domains without a synchronous clock. In other words, there is no
clock signal traveling across the co-simulation interface, and thus the events
occur in asynchronous fashion.
20.3.2.2 Smart Optical Pixel Transceiver
The smart optical pixel transceiver, or SPOT, was a development at the Uni-
versity of Delaware [52]. It provides a short-range free-space optical link
between two custom-designed transceivers. Each transceiver either accepts
or generates a parallel bus, in the digital domain. On the transmitter side,
each bus is serialized into a double data rate data signal, along with a 4X
clock (125 MHz clock doubled to 250 MHz in this test system). Serializa-
tion and de-serialization are handled in the digital domain. These serial
data/clock streams are converted into analog signals that are amplified
and used to drive VCSEL arrays, similar to FIG. Photodetectors convert the
Nicolescu/Model-Based Design for Embedded Systems 67842_C020 Finals Page 686 2009-10-2
686 Model-Based Design for Embedded Systems
rst
Clock&Reset
1
0
MM M
X
X01234
01
01
03
03
03
03
03
03
56789ABCDEF
977
250 µm
XX
XX
XX
XX
Now
8000000 pa
XXX
0
0
0
0
00
00
00
00
0
0
0
00
00
00
00
1
clk
Configuration control
D
valid
iond
en
clk_gel
pattern
sel
Input from Fiber/circuits
Output from Fiber/circuits
input_0
input_1
input_2
input_3
output_0
output_1
output_2
output_3
Clock & Reset
FIGURE 20.28
FIG test system block diagram: Areas in the digital domain are executed in
ModelSim while areas in the analog and optical domains are executed in
Chatoyant.
CLk4X
CLk4X
Data1
PIN PD
array
Receiver
circuitry
8:1 DDR
deserializer
1:8 DDR
Serializer
1:8 DDR
Serializer
8:1 DDR
deserializer
Dout
(7:0)
Dout
(15:8)
Clk1X_Out
RXTX
Driver
circuitry
4 free-space
optical links
Electrical output
Electrical input
Din
(7:0)
Din
(15:8)
Clk1X_IN
Clk4X_IN
VCSEL
array
Data2
FIGURE 20.29
SPOT system block diagram showing the digital data entering in parallel
to the UTSI transceiver chip, serialized transmitted over free-space optics,
deserialized with clock-recovery, back into parallel data. (Courtesy of [52].)
propagated light back into analog signals at which point the analog circuits
amplify and feed the de-serializing logic in the digital domain. Figure 20.29
shows the system block diagram.
Nicolescu/Model-Based Design for Embedded Systems 67842_C020 Finals Page 687 2009-10-2
CAD Tools for Multi-Domain Systems on Chips 687
SPOT tests the ability of the co-simulation environment to work with
a global clock signal. This clock signal, generated by the digital domain,
is transmitted with the data, and thus crosses the co-simulation interface.
This means that there are a large number of periodic events occurring. This
illustrates the simulation behavior of a synchronous system versus an asyn-
chronous system in the co-simulation environment.
Given these two systems, we next show the results of runtimes and event
traffic for different time resolutions of the SYNC_PULSE parameter. A total
of four resolutions were tested, 1 ps, 10 ps, 100 ps, and 1 ns. These values
were chosen since the systems run at relatively high frequencies, in the range
of nanoseconds for both data bit rate and clock speed. All simulations were
performed on a Dual 1.70 MHz Intel Xeon Processor Dell Precision with 3
GBs of RAM running Red Hat Linux 7.3, kernel version 2.4.18-3SMP.
20.3.2.3 FIG Runtimes
The following set of charts show the runtime and event traffic seen in each
of the resolution steps. Figure 20.30 shows the runtime, in seconds versus
the four different time resolutions. Figure 20.31 shows the event counts seen
from the Chatoyant and ModelSim perspectives.
As seen in Figure 20.30, the runtimes decreased as the resolution became
coarser. One thing to note is the logarithmic-like decay. This is most likely
because of the total simulation time of the experiment rather than the time
resolution. Since all simulations were performed for a simulation time of
154.22 141.01163.75214.43
100 ps 1 ns10 ps1 ps
0.00
50.00
100.00
150.00
200.00
250.00
Series1
Seconds
Runtime vs. sync resolution
FIGURE 20.30
Runtime versus Sync resolution for FIG.
Nicolescu/Model-Based Design for Embedded Systems 67842_C020 Finals Page 688 2009-10-2
688 Model-Based Design for Embedded Systems
Chatoyant RX
0
1000
2000
3000
4000
5000
Number of events vs. resolution
Event count
Chatoyant TX
ModelSim RX
ModelSim TX
4
1 ps Sync
1,077
4,307
12
4
10 ps Sync
37
147
12
4
100 ps Sync
8
32
12
4
1 ns Sync
4
16
12
FIGURE 20.31
Number of events per simulation for FIG.
1.4 us, the closer the granularity of the resolution is to the magnitude of the
end time, the smaller the difference will be in runtimes. This is explained
by the notion that less event processing is performed since more events are
ignored between synchronization points. Therefore, event processing over-
head is reduced.
Also, the amount of event traffic decreases by two orders of magnitude
between 1 ps and 1 ns resolutions. This is also related to the fact that more
events are processed at higher resolutions.
20.3.2.4 SPOT Runtimes
The SPOT system yields a different perspective on the co-simulation system.
Figure 20.32 shows the runtime results versus resolution and Figure 20.33
shows the event traffic at each resolution.
As seen in Figure 20.32, the runtimes do decrease, in general, with respect
to an increasing granularity. The exception to this is the 10 ps resolution,
which shows a slight increase in runtime compared to the 1 ps resolution.
This may be because of the processing of more event changes given the peri-
odicity of the clock signal in the system. Regardless of this outlier, there is
still a general trend for decreasing runtimes as well as decreased event traf-
fic with lower resolutions.
SPOT having a higher runtime versus FIG indicates the effect of the
clock signal on performance. Since there is a clock having a consistent event
Nicolescu/Model-Based Design for Embedded Systems 67842_C020 Finals Page 689 2009-10-2
CAD Tools for Multi-Domain Systems on Chips 689
Seconds
0.00
200.00
400.00
600.00
800.00
1000.00
1200.00
1400.00
1600.00
1800.00
2000.00
Runtime vs. sync resolution
1 ps 10 ps 100 ps 1 ns
1605.67 1722.50 843.31 842.65
FIGURE 20.32
Runtime results versus resolution granularity.
change at a fixed frequency, the number of events per synchronization cycle
increases. This is seen by the higher event counts in each SPOT simulation
versus those for FIG. This amount, spread uniformly across the entire simu-
lation in SPOT, versus FIG which has dense cluster of events separated by a
large time gap, exemplifies the overhead associated with processing events.
20.4 Summary
In summary, we have presented a co-simulation environment for mixed-
domain, mixed-signal simulation that spans the realms of HDL digital logic,
analog electrical, optical, and mechanical systems. A variety of modeling
techniques are used to develop analog component models that are evalu-
ated using continuous time models. These component behaviors commu-
nicate via specific ports that pass complex messages between components.
Those messages, and the corresponding execution of the component mod-
els, are coordinated by a DE simulation backbone. This backbone, built
on Ptolemy, also runs in coordination with a commercial HDL simulator.
Nicolescu/Model-Based Design for Embedded Systems 67842_C020 Finals Page 690 2009-10-2
690 Model-Based Design for Embedded Systems
4000
3500
3000
2500
2000
1500
1000
500
0
1 ps Sync
146
Chatoyant RX
Chatoyant TX
ModelSim RX
ModelSim TX
146 146 142
175
175
144
3499 3499 1750
179435433543
150 150 150
10 ps Sync 100 ps Sync 1 ns Sync
Number of events vs. resolution
Event count
FIGURE 20.33
Event traffic versus resolution granularity.
This system, known as Chatoyant–ModelSim Co-Simulation Environment,
provides an interface between the multi-domain analog realm handled by
Chatoyant and the digital realm, handled by ModelSim.
As seen in the co-simulation experiments, there are a few factors that
affect runtime performance. Asynchronous systems with more clustering of
events within certain windows generally have a better runtime than syn-
chronous systems that have a steady load of events. Also, as predicted, the
resolution of synchronization, defined in the context of the PDES conserva-
tive approach and implemented using Unix IPC, has an effect on runtime
performance by reducing the event processing overhead, at the cost of accu-
racy. This cost is assessed based on the system and requirements a particular
user has for the simulation.
20.4.1 Conclusions
Multi-domain modeling and multi-rate simulation tools are required to sup-
port mixed-technology system design. This chapter has shown Chatoyant’s
support for simulating and analyzing optical MEM systems with models
for optical, electrical, and mechanical models for components and signals.
By supporting a variety of component and signal modeling techniques and
multiple abstraction levels, Chatoyant has the ability to perform and ana-
lyze mixed-signal tradeoffs, which makes it valuable to multi-technology
system designers. Keeping simulations, along with analysis techniques such