Tự học Excel 2010 part 14 doc
Bạn đang xem bản rút gọn của tài liệu. Xem và tải ngay bản đầy đủ của tài liệu tại đây (653.62 KB, 10 trang )
Sort & Filter
Clear
4.2 PivotTable và PivotChart là những công cụ phân tích dữ liệu rất mạnh trong Excel. Chúng
có thể biến những con số dường như vô nghĩa trong một khối dữ liệu khổng lồ thành những con
số có nghĩa. PivotTable và PivotChart rất dễ sử dụng, nhưng chúng cũng có một số vấn đề phức
tạp không thể tránh khỏi.
4.2.1 Giới thiệu PivotTable và PivotChart
Tạo một báo cáo PivotTable đơn giản
PivotTable Insert
thanh Ribbon:
Create PivotTable
Table/RangeSelect a
table or range New WorksheetOK
Ng
PivotTable Field List
PivotTable Field ListRegion
Region
Row Labels PivotTable Field List
Midwest, Northeast South
Camping Sum of Caming
Values PivotTable Field List
Camping
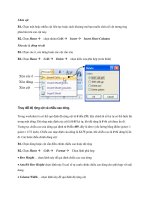
Sum of Camping trong khung
ValuesValue Field Settings
Value Field Settings Number Format
Format Cells n CurrencyOK
Row LabelsRegion:
PivotTable:
PivotTable Field List
PivotTable Field List
Region
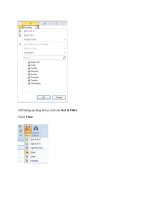
-down aAutoFilter
Region
Select All
Midwest (Select All)
Midwest
1.2. Tạo một báo cáo PivotTable với nhiều cột
Title
PivotTable Field List
Store, Category Titles
Store Category Row Labels
Tiltes Values