Model-Based Design for Embedded Systems- P68 pptx
Bạn đang xem bản rút gọn của tài liệu. Xem và tải ngay bản đầy đủ của tài liệu tại đây (587.13 KB, 10 trang )
Nicolescu/Model-Based Design for Embedded Systems 67842_C020 Finals Page 656 2009-10-2
656 Model-Based Design for Embedded Systems
A is the area of the beam
l is the length
ρ is the density of the material
δ is the viscosity factor in the system acting over x and y components
The analysis of this element is obtained using the PWL technique pre-
sented above. Constraining the input/output signals to PWL waveforms, the
time domain response is completed in one step, without costly numerical
integration.
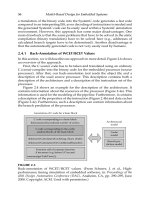
To test our results, a comparison against NODAS [28] was performed.
Figure 20.5 shows the frequency response and corresponding resonant fre-
quencies for this constrained beam (183 μm length, 3.8gμm width, poly-Si)
from both our PWL technique and NODAS. The transient response to 1.8
nN nonideal step (rise time of 10 μs) rotational torque is also simulated. The
rotational deformation to this force is shown in Figure 20.6. The compari-
son between our results and those of NODAS are very close. NODAS uses
SABER, a circuit analyzer performing numerical integration for every ana-
lyzed point, which results in costly computation time. Our linear piecewise
solver is computational expensive during the eigenvalue search; however,
this procedure is performed only one time, at the beginning of the simula-
tion run. Overall, this results in a more computationally efficient simulation.
However, as previously mentioned, the accuracy of the analysis depends on
the granularity of the piecewise characterization for the signals used in the
system, which can increase computation time.
Typically, this beam is only a part of a bigger device made from
individual components that are characterized using similar expressions.
NODAS
PWL simulator
150.04 KHz
154.59 KHz 1.52 MHz
1.48 MHz
f
1
f
2
Resonant frequencies
210.0
195.0
180.0
165.0
150.0
135.0
120.0
105.0
f (Hz)
dB(_)
10.0 k 100.0 k 1 meg 10 meg
(a)
210
195
180
165
150
135
120
105
10 k 100 k 1 meg
f (Hz)
10 meg
dB
(b)
FIGURE 20.5
Frequency response of a beam (a) NODAS, (b) Chatoyant.
Nicolescu/Model-Based Design for Embedded Systems 67842_C020 Finals Page 657 2009-10-2
CAD Tools for Multi-Domain Systems on Chips 657
0.3
0.27
0.24
0.21
0.18
0.15
0.12
0.09
0.06
0.03
0
0 10 20 30 40 50 60 70 80 90 100
rad
(b)
(a)
0.3
0.27
0.24
0.21
0.18
0.15
0.12
0.09
0.06
0.03
0.0
0.0
(rad)
10 u 20 u 30 u 40 u 50 u
t(s)
60 u 70 u 80 u 90 u 100 u
FIGURE 20.6
Transient response of a BEAM (a) NODAS, (b) Chatoyant.
The generalization of the previous case to an assembly of elements or
mechanical structure is fairly straightforward. The general expression, seen
in Equation 20.3, characterizes the whole structure defined by a set of nodes,
from which every individual element shares a subset. The next step, simi-
lar to the previously considered electronic case, is merging the individual
templates together, composing the general matrix representation for the
composed structure. However, a common coordinate reference must be used
for this characterization of mechanical structures since every template or ele-
ment is characterized in a local reference system. The process of translation of
these local templates to the global reference system can be described by [31]
[S]=[A]
T
[
¯
S][A] (20.7)
where
[A]represents the translation matrix from local displacements to global dis-
placements (a function of the structure’s geometry)
[
¯
S] represents the local template
[S] is the corresponding global representation
The next step is the addition of these global representations into the general
matrix form, using the matrices’ nodal indexes as reference. Finally, the PWL
solver can be used on the composed system’s general matrix and simulated.
The use of a PWL general solver for mechanical simulation decreases the
computational task and allows for a tradeoff between accuracy and speed.
The additional advantage of using the same technique to characterize elec-
trical and mechanical models allows us to easily merge both technologies in
complex devices that interact in mixed domains.
20.2.6 Optical Propagation Models
Our optical propagation models are based on two techniques: Gaussian
and diffractive scalar. Gaussian models give us fast, accurate results for
macroscale systems and systems that exhibit limited diffraction. Slower
Nicolescu/Model-Based Design for Embedded Systems 67842_C020 Finals Page 658 2009-10-2
658 Model-Based Design for Embedded Systems
diffractive scalar models must be used when diffraction effects dominate the
system.
20.2.6.1 Gaussian Models
Our macroscale optical signal propagation technique is based on Gaussian
beam analysis, allowing paraxial light to be modeled by scalar parame-
ters, and components to be modeled by an optical “ABCD matrix,” which
describes how light is affected by a component [32]. The Gaussian beam is
defined by the nine parameters seen in Table 20.1.
As the parameters in the table indicate, our optical propagation is actually
a mixture of ray analysis and Gaussian analysis. We first find the posi-
tion and direction of the center of the Gaussian beam, using ray propaga-
tion methods. We then “superimpose” the Gaussian beam over this ray to
model its intensity, waist, phase, and depth of focus. The advantage of using
this combination of ray and Gaussian beam analysis is its computational
efficiency. The resulting simulation speed supports interactive system-level
design.
The nine scalar parameters defining the optical signal are represented
in Chatoyant’s message class and passed between components. Each com-
ponent “constructs” an internal model of the beam from these parameters,
alters the beam according to the component function, and then “decom-
poses” the beam back into the propagation parameters, which are returned
to the message class and passed to the next object. The internal model of
the component might simply consist of beam steering, as below, or require
optical power integration, imaging, or optoelectronic conversion.
Using Gaussian beam propagation, components are modeled with the
previously mentioned ABCD matrix. For example, we examine the interac-
tion between a Gaussian beam and a thin lens. To study the beam/lens inter-
action, we start with a definition of the Gaussian beam’s q-parameter, which
characterizes a Gaussian beam of known peak amplitude [32]:
q = z
w0
+jz
0
(20.8)
TABLE 20.1
Gaussian Beam Parameters
Parameter Description
x, y Central position of the Gaussian beam
Rho, theta Directional cosines of the Gaussian beam
Intensity Peak intensity of the Gaussian beam
z
0
Rayleigh range, depth of focus
z
w0
Distance to the next minimum waist
Lambda Wavelength of the light
Phase Phase of the central peak of the beam
Nicolescu/Model-Based Design for Embedded Systems 67842_C020 Finals Page 659 2009-10-2
CAD Tools for Multi-Domain Systems on Chips 659
where the real part is the distance to the minimum waist, and the imaginary
is the Rayleigh range, from which the waist of the beam is determined. The
new Gaussian beam is defined by the following:
q
2
=
Aq
1
+B
Cq
1
+D
(20.9)
where A, B, C, D is the matrix that defines a component. In the case of a thin
lens, A =1,B =0,C =−1/f, D = 1, where f is the focal length of the lens.
Solving for q
2
, and determining the real and imaginary parts, the new z
0
and
zw
0
for the emerging Gaussian beam can be found:
z
0
=
f
2
·z
0
(f −zw
0
)
2
+z
2
0
(20.10)
zw
0
=
f(f · zw
0
−zw
2
0
−z
2
0
)
(f −zw
0
)
2
+z
2
0
(20.11)
The position and direction of the beam is determined from common ray
tracing techniques:
y
2
= Ay
1
+Bθ
1
θ
2
= Cy
1
+Dθ
1
(20.12)
However, as the systems that we wish to design continue to diminish in size,
diffractive effects are a major concern. For example, in optical MEM design,
the size of the components, apertures, and small structures bring diffractive
effects into play, along with the use of diffractive elements such as Fres-
nel zone plates, binary lenses, gratings, and computer generated holograms
(CGH) [33]. Therefore, new design methods are needed that utilize optical
models that can provide accurate diffractive results with reasonable compu-
tational costs. In addition to diffractive effects, other characteristics of opti-
cal signals are important, such as polarization, scattering, phase, frequency
(wavelength) dependence, and dispersion, this last being a requirement for
modeling fiber optic components.
20.2.6.2 Scalar Diffractive Models
To identify which modeling technique is best suited for our needs, we need
to analyze the MDSoCs that we wish to model and evaluate the available
optical propagation techniques. Current optical MEM systems have compo-
nent sizes of roughly tens to hundreds of microns and propagation distances
in the hundreds of microns. With these sizes and distances on the order of
ten to a thousand times the wavelength of light, optical diffractive models
are required.
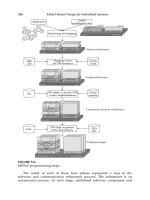
Figure 20.7 is a description of models of increasing abstraction that begins
at the top with the fundamental vector wave equations, or Maxwell’s equa-
tions, and branches through the different abstraction levels of scalar model-
ing techniques. Along the arrows, notes are added stating the limitations and
approximations that are made for each formulation.
Nicolescu/Model-Based Design for Embedded Systems 67842_C020 Finals Page 660 2009-10-2
660 Model-Based Design for Embedded Systems
Vector wave equations–Maxwell equations
Scalar equations
Rayleigh–Sommerfeld
Fresnel–Kirchoff
Angular spectrum approximation
(near field)
Compute angular spectrum
solve with Fourier transform
Fresnel approximation (near field)
Fraunhofer approximation (far field)
Quadratic phase exponential = 1
solve with Fourier transform
Binomial expansion for the distance from
aperture to observation plane
spherical wave replaced by quadratic
phase exponential (parabolic fronts)
Boundary conditions on field strength
or normal derivative
use for planar components
Diffracting element >> λ
observation plane not close to diffracting element
Boundary conditions on field strength and
normal derivative
use for nonplanar components
FIGURE 20.7
Scalar modeling techniques.
The size and scale of the optical components of MDSoC systems of at least
10 times greater than the wavelength of light lead to the use of scalar diffrac-
tion models. Scalar equations are directly derived from Maxwell’s equations.
Maxwell equations, with the absence of free charge, are [34–36]
∇×
E =−μ
∂
H
∂t
∇×
H =−ε
∂
E
∂t
∇·ε
E = 0 ∇·μ
H = 0 (20.13)
These equations can be recast into the following form:
∇
2
E −
n
2
c
2
∂
2
E
∂t
= 0 ∇
2
H −
n
2
c
2
∂
2
H
∂t
= 0 (20.14)
If we assume that the dielectric medium is linear, isotropic, homogeneous,
and nondispersive, all components in the electric and magnetic field can be
Nicolescu/Model-Based Design for Embedded Systems 67842_C020 Finals Page 661 2009-10-2
CAD Tools for Multi-Domain Systems on Chips 661
summarized by the scalar wave equation:
∇
2
U −
n
2
c
2
∂
2
U
∂t
= 0 (20.15)
For monochromatic light, U(P,t) is the positional complex wave function,
where P is the position of a point in space:
U(P, t) = a(P)e
jϕ(P)
e
j2πv
(20.16)
By placing the positional complex wave function into the scalar wave equa-
tion, the result is the time-independent Helmholtz equation, which must be
satisfied by the scalar wave:
(∇
2
+k
2
)U(P) = 0 (20.17)
where k =
2π
λ
The challenge is to determine the scalar wave function as it propagates
through a diffractive element. One answer is based on the Huygens–Fresnel
principle that states that every unobstructed point of a wave front at a given
time serves as a source of spherical wavelets with the same frequency as the
primary wave. The Huygens–Fresnel principle is mathematically described
by the Rayleigh–Sommerfeld scalar diffraction formulation:
U
2
(x, y) =
z
jλ
U
1
(ξ, η)
e
jkr
12
r
2
12
∂ξ∂η
where
ξ and η are the coordinates of the aperture plane
x and y are the coordinates of the observation plane
All scalar diffraction solutions are limited by two assumptions; the diffract-
ing structures must be “large” compared to the wavelength of the light,
and the observation screen cannot be “too close” to the diffracting structure.
However, these dimensions are not clearly defined, questioning if scalar opti-
cal models are valid for all micro-optical systems. For some extremely small
optical systems, our initial intuition of “adequate” scalar models might be
invalid and full wave propagation models must be used.
When modeling scalar formulations, explicit integration of the wave front
is performed at each interface, severely increasing the computation time.
Using approximations to the scalar formulations, as seen in Figure 20.7,
can reduce this time. For example, the Fraunhofer approximation is solved
using a Fourier transform, where common FFT algorithms enable an efficient
solution. However, the valid propagation ranges limit when these approxi-
mations can be used. Figure 20.8 shows where these different modeling tech-
niques are valid with respect to the distance propagated past a diffracting
element.
Nicolescu/Model-Based Design for Embedded Systems 67842_C020 Finals Page 662 2009-10-2
662 Model-Based Design for Embedded Systems
Full wave
equation
Rayleigh—Sommerfeld
Fresnel—Kirchoff
z>>λ z>>
3
(x–ξ)
2
+(y–η)
2
4
π
[
[
Fresnel
approximation
Scalar
Vector
z>>
k(ξ
2
+η
2
)
max
2
Fraunhofer
approximation
FIGURE 20.8
Valid propagation distances of scalar modeling techniques. (From Kurzweg,
T.P. et al., J. Model. Simul. Micro-Syst., 2, 21, 2001. With permission.)
Supporting diffractive propagation in Chatoyant requires additional
parameters in the message class. Therefore, the class contains the user’s
requested optical propagation method (Gaussian, or scalar diffractive), along
with the complex wave front of the beam as it propagates through the sys-
tem. The wave front is gridded, defining the degree of accuracy of the model
of the wave. As with the Gaussian propagation, it is the component model
that alters the wave front as the component interacts with the light beam and
returns the result in an outgoing message.
We implemented the Rayleigh–Sommerfeld diffractive formulation using
a 96-point Gaussian quadrature method for our integration technique.
In Figure 20.9, we show simulation results of an 850 nm plane wave
Chatoyant
* RMS error of grid cells with respect to 80 × 80 MathCAD
MathCAD
Time (min)
160 × 160 17.75
4.45
1.1
0.29
X
XX
0.637
120 0
1.54
4.32
20
7
1.67
3.37
80 × 8 0
80 × 8 0
160 × 160
40 × 40
40×40
50 × 50 µm
300 µm
20 × 20
20 × 20
200 × 200 µm
Observation plane
Error (%)*
Time (min)
Error (%)*
FIGURE 20.9
Computation time versus accuracy using Chatoyant’s scalar propagation
models. (From Kurzweg, T.P. et al., J. Model. Simul. Micro-Syst., 2, 21, 2001.
With permission.)
Nicolescu/Model-Based Design for Embedded Systems 67842_C020 Finals Page 663 2009-10-2
CAD Tools for Multi-Domain Systems on Chips 663
propagating though a 50 μm aperture and striking an observation plane
300 μm away. We compare our simulations with an 80 × 80 “base case”
from MathCAD, which uses a Romberg integration technique. The table in
Figure 20.9 shows the computation time and relative error of the system
(compared with the base case) for different grid spacing. Using our integra-
tion technique, we can decrease the computation time an order of magnitude
and still remain within 2% accuracy.
20.2.6.3 Angular Spectrum Technique
As an alternative to direct integration over the surface of the wave front, the
Rayleigh–Sommerfeld formulation can also be solved using a technique that
is similar to solving linear, space invariant systems. In this case, the complex
wave front is analyzed across its surface with a Fourier transform. By using
the Fourier transform, the complex optical wave front is reduced into a set
of simple linear exponential functions. This transform identifies the compo-
nents of the angular spectrum, which are plane waves traveling in different
directions away from the surface [35].
Examining the angular spectrum, we look at light propagating from an
aperture plane at z = 0 to a parallel observation plane. The wave function
U(x,y,0) has a 2D Fourier transform, A(v
x
,v
y
,0), in terms of angular frequen-
cies, v
x
and v
y
:
A(v
x
, v
y
,0) =
U(x, y,0) exp[−j2π(v
x
x + v
y
y)] ∂x∂y
where v
x
= sin θ
x
/λ and v
y
= sin θ
y
/λ.
sin(θ
x
) and sin(θ
y
) are the directional cosines of the plane wave propagat-
ing from the origin of the coordinate system, as seen in Figure 20.10. A is the
complex amplitude of the plane wave decomposition defined by the specific
angular frequencies.
To propagate the complex wave function to a parallel plane, a propaga-
tion phase term is used as a transfer function. The relationship of propa-
gation in the frequency domain between A(v
x
,v
y
,0) and A(v
x
,v
y
,z) has been
computed by satisfying the Helmhotz equation with the propagated complex
wave function, U(x,y,z) [35]:
A(v
x
, v
y
, z) = A(v
x
, v
y
,0) exp
jz2π
1
λ
2
−v
2
x
−v
2
y
This describes the phase difference that each of the plane waves, differ-
entiated by the angular, or spatial frequencies, experiences due to the
propagation between the parallel planes. Therefore, the wave function after
propagation can be transformed back into the spatial domain with the
following inverse Fourier transform:
Nicolescu/Model-Based Design for Embedded Systems 67842_C020 Finals Page 664 2009-10-2
664 Model-Based Design for Embedded Systems
x
y
z
θ
x
sin θ
y
θ
y
sin θ
x
FIGURE 20.10
Angular spectrum frequencies.
U(x, y, z) =
A(v
x
, v
y
,0) exp
jz2π
1
λ
2
−v
2
x
−v
2
y
×exp[j2π(v
x
x + v
y
y)] ∂v
x
∂v
y
It is interesting to note that the output complex wave function is simply the
convolution of the input wave function and the propagation phase function.
Using Fourier transform theory, the convolution in the spatial domain is per-
formed by a multiplication in the frequency domain.
It is appropriate to discuss the physical effect of evanescent waves, which
are defined in the case when 1/λ
2
− v
2
x
− v
2
y
< 0. These waves carry very
little power and die out in a couple of wavelengths of propagation [37]. In
our simulations, we ignore these waves.
The angular spectrum method is restricted to propagation between paral-
lel planes that share a common center. Removing these restrictions has been
the goal of recent research. Tommoasi and Bianco have determined how to
propagate to a plane that is tilted with respect to the initial plane [38]. Delen
and Hooker have determined a way to allow offsets in the observation plane
[39]. We summarize these two methods next.
For arbitrary angles between the aperture plane, U(ξ, η,ζ), and the obser-
vation plane, U(x,y,z), a mapping of the spatial frequencies in each plane’s
coordinates system must occur. This mapping is possible due to the fact that
the phase accumulation term does not change when the waves propagate to
an observation plane that is not normal to the aperture plane. It can be found
that the rotational matrix, M, relating (ξ, η,ζ) to (x,y,z), can be used to relate
Nicolescu/Model-Based Design for Embedded Systems 67842_C020 Finals Page 665 2009-10-2
CAD Tools for Multi-Domain Systems on Chips 665
spatial frequencies in the two coordinate systems by [38].
(x, y,z)
t
= M(ξ, η,ζ)
t
(v
ξ
, v
η
, v
ζ
)
t
= M
t
(v
x
, v
y
, v
z
)
t
In the new tilted coordinate system, the incoming spatial frequencies are per-
ceived as having a spatial frequency corresponding to the outgoing coordi-
nate system. For example, the incoming aperture plane wave having spatial
frequencies (0,0) correspond to angle (-φ,0) in the observation plane with
a φ tilt in the y direction. In all cases, even if the spatial frequencies are
remapped, the amplitude of the plane wave remains constant.
For an observation plane, whose center is offset from the propagation axis
of the aperture plane, the Fourier shifting theorem can be used to solve for
the complex wave function [39]. With this relation between the offset of the
coordinate systems, the function for free-space propagation between offset
planes is
U(x, y,0) =
A
(v
x
, v
y
,0) exp
jz2π
1
λ
2
−v
2
x
−v
2
y
exp[j2π(v
x
x + v
y
y)] ∂v
x
∂v
y
where A
(v
x
, v
y
,0) = A(v
x
, v
y
,0) exp[j2π(v
x
(x
−x) −v
y
(y
−y)]
The angular spectrum technique for modeling propagation between the
aperture and observation plane is summarized graphically in Figure 20.11.
First, the forward Fourier transform is applied to the aperture surface, as
seen in Figure 20.11A. In stage B, each plane wave is multiplied by the prop-
agation phase term. If tilts are present, the remapping of spatial frequencies
occurs, as denoted by C. If offsets between the planes occur, then the shifting
theorem is applied, as shown in step D. Finally, stage E shows the inverse
Fourier transform being applied, and the complex wave front on the surface
of the observation plane is obtained.
The advantage of using the angular spectrum to model light propaga-
tion is that the method is based on Fourier transforms. In CAD tools, the
A
(x,y)(v
x
,v
y
)
x
0
y
0
y
(x,y)
x
f=φ
f=0
f=0
B
exp(– j2πz
– v
x
2
– v
y
2
)
1
λ
2
E
D
C
φ
FIGURE 20.11
Angular spectrum frequencies.