Model-Based Design for Embedded Systems- P69 pdf
Bạn đang xem bản rút gọn của tài liệu. Xem và tải ngay bản đầy đủ của tài liệu tại đây (697.11 KB, 10 trang )
Nicolescu/Model-Based Design for Embedded Systems 67842_C020 Finals Page 666 2009-10-2
666 Model-Based Design for Embedded Systems
Fourier transform can be implemented by one of the numerous fast Fourier
transform (FFT) techniques. The computational order of the FFT for a 2D
input is O(N
2
log
2
N), obviously more efficient when compared to the direct
integration method. We show this speed increase later through an example.
In continuous theory, the angular spectrum method is an exact solution
of the Rayleigh–Sommerfeld formulation. However, when solving the algo-
rithm on a digital computer, a discrete Fourier transform (DFT)mustbe used,
resulting in the accuracy of the angular spectrum method being dependent
on the resolution, or spacing, of the aperture and observation plane meshing.
We call the physical size of the aperture and observation planes the “bound-
ing box,” defining the size of the optical wave front being propagated. Since
the complex wave function is only nonzero for a finite space in the bounding
box, the signal is not always bandwidth limited, and the Nyquist sampling
theory does not always apply. It can be shown, however, that the resolu-
tion of the aperture and observation meshing must be λ/2 or smaller [39].
For many simulation systems without large degrees of tilt and hard diffrac-
tive apertures, the resolution can be coarser. In systems with high tilts, the
resolution is most sensitive. With a mesh spacing of λ/2, the angular spec-
trum decomposition will model plane waves propagating from the aperture
to the observation plane in a complete half circle, that is, between –90 and
+90 degrees.
Other inaccuracies that can occur when using a DFT are aliasing and win-
dow truncation. Aliasing occurs when frequencies exist greater than the criti-
cal sampling frequency. In this case, these high frequencies are “folded over”
into the sampled frequency range [40]. The effect of this is seen in our simu-
lations as optical power “reflecting” off of the walls of the bounding box. If
significant optical power reflects off the wall, interference between the prop-
agating beam and these reflections can occur, resulting in inaccurate optical
waveforms. The same effect can be seen when the bounding box truncates the
signal. Truncation occurs when the waveform propagates into the edges of
the bounding box. The simplest solution to ensure accurate results is having
sufficient zero padding around the optical waveform, reducing the chance
the waveform is aliased or truncated by walls of the bounding box.
In Chatoyant, the user can choose between using the Gaussian or scalar
diffractive (angular spectrum) methods during simulation. The components
in the optical library support both representations in the optical signal
message class. Using these models we can simulate and analyze a variety
of heterogeneous systems as presented in the next section.
20.2.7 Simulations and Analysis of Optical MEM Systems
In this section, we show how Chatoyant can model and simulate complete
mixed-signal systems. The first system uses both electrical and optical sig-
nals to simulate a complete “4f” optoelectronic link which uses a four focal
length image relaying optical system. The second example, building from the
Nicolescu/Model-Based Design for Embedded Systems 67842_C020 Finals Page 667 2009-10-2
CAD Tools for Multi-Domain Systems on Chips 667
two signal 4f link, adds mechanical signals for simulation and analysis of an
optical MEM system. This set of example systems is centered on an optical
MEM scanning mirror. With this device we are able to simulate an optical
scanning system and a self-aligning optical detection system. These systems
show the ability to model a mixed system of mechanical MEMs, optics, and
electronic feedback. The last example shows the power of the angular spec-
trum technique to model diffractive optical systems with the speed and accu-
racy required to perform system-level design.
20.2.7.1 Full Link Example
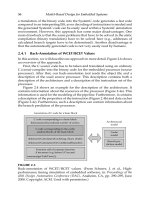
A complete optoelectronic simulation of a 4f optical communication link in
Chatoyant is presented in Figure 20.12. The distance between the vertical
cavity surface emitting laser (VCSEL) array and the first lens and the dis-
tance between the second lens and the detector array are both 1 mm. The
distance between the lenses is 2 mm, with both lenses having a focal length
of 1 mm, giving a 4f system. The top third of the figure shows the system
as represented in Chatoyant. Each icon represents a component model, and
each line represents a signal path (either optical or electrical) connecting the
outputs of one component to the inputs of the next. Several of the icons, such
as the VCSELs and receivers, model the optoelectronic components them-
selves, while others, such as the output graph, are used to monitor and dis-
play the behavior of the system. The input to the system is an electrical signal
with speed varying from 300 MHz to 1.5 GHz. A Gaussian noise with vari-
ance of 0.5 V has been added to the multistage driver system to show the
ability of our models to respond to arbitrary waveforms.
In the center of the figure, three snapshots (before the VCSEL, after the
VCSEL, and after the detector) show the behavior of the CMOS drivers under
Digital
Driver
Gaussian waist analysis
Power analysis
VCSEL
4f optical system
PGM
+
Receiver
FIGURE 20.12
Chatoyant analysis of optoelectronic 4f communications link.
Nicolescu/Model-Based Design for Embedded Systems 67842_C020 Finals Page 668 2009-10-2
668 Model-Based Design for Embedded Systems
a 300 MHz noisy signal. In these snapshots, one can see the amplification
of the system noise through the CMOS drivers, the clipping of subthreshold
noise in the VCSEL, and the frequency response on the quality of the received
signal. This last observation is better seen in the three eye diagrams, shown
at the bottom of Figure 20.12, analyzed at 300 MHz, 900 MHz, and 1.5 GHz.
For the component values chosen, the system operates with reasonable BER
up to about 1 GHz.
For this 4f system, the VCSEL and driver circuits explicitly model the
effects of bias current and temperature on the optoelectric conversion, L-I
efficiency, of the lasers. Figure 20.13 shows the effects of temperature, T,and
current bias, I
b
, on the bit error rate (BER) of the link. Generally, the fre-
quency response of the link is dominated by the design of the receiver circuit;
however it is interesting to note that both the VCSEL temperature and bias
have a significant effect on system performance, because of their impact in
the power through the link. Perhaps most interesting is the fact that increas-
ing bias current does not always correspond to better performance over the
whole range of frequencies examined. Note that the curve for 1 mA bias
offers the best performance below 600 MHz; however, the 0.5 mA bias (the
nominal threshold of the VCSEL) crosses the curve for 1 mA and achieves
the best performance at higher frequencies.
As an example of mechanical tolerancing, we analyze the system with
varying-sized photodetectors (50, 30, and 20 μm). The detectors are displaced
from +
10 μmto+100 μm in detector position along the axis of optical prop-
agation. This results in defocusing of the beam relative to the detector array.
We calculate both the insertion loss and the worst case optical crosstalk as
the detectors are displaced. The results are shown in Figure 20.14. Systems
can be further analyzed for their sensitivity to mechanical tolerances using a
Monte Carlo tolerancing method described in [8,9].
Two additional analyses are also shown in the Chatoyant representation
in Figure 20.12. The first is the beam profile analysis, which graphically dis-
plays one beam’s waist as it propagates between components, showing the
possibility of clipping at the lenses. The second analysis shows the optical
signals as they strike the detector array. This analysis also gives the user the
amount of optical power captured on each of the detectors. From this analy-
sis, optical crosstalk and system insertion loss can be calculated.
20.2.7.2 Optical Beam Steering/Alignment System
A torsion-scanning mirror is a micromachined 2D mirror built upon a
micro-elevator by self assembly (MESA) structure [41,42]. The mirror and
MESA structures are shown in Figure 20.15a and b, respectively. The scan-
ning mirror can tilt along the torsion bars in both the x and y directions
and is controlled electrostatically through four electrodes beneath the mirror,
outlined in Figure 20.15a by the dashed boxes. For example, the mirror tilts in
the positive x direction when voltage is applied to electrodes 1 and 2, and the
Nicolescu/Model-Based Design for Embedded Systems 67842_C020 Finals Page 669 2009-10-2
CAD Tools for Multi-Domain Systems on Chips 669
BER vs. frequency at VCSEL temperatures
1.E–20
1.E–16
1.E–12
1.E–08
BER
1.E–04
1.E+00
100 300 500 700 900 1100 1300 1500
BER (T =40 C)
BER (T =70 C)
BER (T =100 C)
1.E –20
1.E –16
1.E –12
1.E –08
1.E –04
1.E +00
BER vs. frequency at various current bias
BER
100 300 500 700 900 1100 1300 1500
BER (lb =0.1 mA)
BER (lb =0.25 mA)
BER (lb =1.0 mA)
BER (lb =1.5 mA)
BER (lb =0.5 mA)
Frequency (MHz)
Frequency (MHz)
FIGURE 20.13
BER versus frequency at different VCEL temperatures and current biases.
0
10
+μm displaced in optical axis
Crosstalk (dB)
Crosstalk vs. detector displacement
30 50 70
–25
–50
–75
–100
50 um Det
20 um Det
30 um Det
Insertion loss vs. detector displacement
10 30 50 70
0
–3
–6
–9
–12
–15
–18
Insertion loss (db)
±μm displaced in optical axis
50 um Det 30 um Det 20 um Det
FIGURE 20.14
Insertion and crosstalk versus mechanical tolerancing. (From Kurzweg, T.P.
et al., J. Model. Simul. Micro-Syst., 2, 21, 2001. With permission.)
mirror tilts in the negative y direction when voltage is applied to electrodes
1and4.
The MESA structure is shown in Figure 20.15b. The mirror is elevated by
four scratch drive actuator (SDA) sets pushing the support plates together,
allowing for the scanning mirror to buckle and rise up off the substrate [43].
The MESA structure’s height is required to be large enough such that the tilt
of the mirror will not cause the mirror to hit the substrate. Post fabrication
system alignment can also be performed by the MESA structure.
Figure 20.16 shows a drawing of the torsion-scanning mirror system. On
the left one can see one VCSEL emitting light vertically through a lenslet,
and a prism that reflects off a plane mirror. The light is then reflected off
of the optical MEM scanning mirror, back to the plane mirror, and captured
through a lenslet and prism onto detectors on the right. With the flexibility
of the scanning mirror, this system could act as a switch, an optical scanner,
Nicolescu/Model-Based Design for Embedded Systems 67842_C020 Finals Page 670 2009-10-2
670 Model-Based Design for Embedded Systems
(a)
23
14
(b)
x
y
FIGURE 20.15
(a) Scanning torsion mirror, (b) MESA structure. (From Kurzweg, T.P. et al.,
CAD for optical MEMS, Proceedings of the 36th IEEE/ACM Design Automation
Conference (DAC’99), New Orleans, LA, June 20–25, 1999. With permission.)
FIGURE 20.16
Scanning mirror system. (From Kurzweg, T.P. et al., CAD for optical MEMS,
Proceedings of the 36th IEEE/ACM Design Automation Conference (DAC’99),
New Orleans, LA, June 20–25, 1999. With permission.)
or a reconfigurable optical interconnect. We have simulated systems using
this scanning mirror configuration for switching and self-alignment through
optical feedback. We first demonstrate an optical scanning system.
In this scanning system, we simulate a single source beam propagating
through the 3 × 3 subsystem seen in Figure 20.16. With the appropriate volt-
age levels applied to the four electrodes, the scanning mirror tilts and directs
the source to any of the nine detectors. This system, as represented in Chatoy-
ant, is shown in Figure 20.17. The SDA arrays move the mirror to the correct
height for alignment. We control the electrodes with a waveform generator,
which applies the appropriate voltages on the four electrodes for the beam
to scan or switch in a desired pattern.
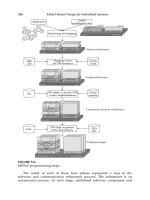
As an example, we are able to scan a diamond pattern with the wave-
forms shown in Figure 20.18. The desired pattern is shown by the white
arrow trace on the first output image. The other nine images show snapshots
of the detector plane as the diamond pattern is scanned. Dashed lettered
lines correspond to time intervals in the waveforms and in the snapshots.
Mechanical alignment is critical in this system. For example, the lenslets in
this simulation are only 100 μm in diameter. Therefore, when steering the
Nicolescu/Model-Based Design for Embedded Systems 67842_C020 Finals Page 671 2009-10-2
CAD Tools for Multi-Domain Systems on Chips 671
UCSEL
Prism Mirror Mirror Prism
Powergrid
Const
SDA
FIGURE 20.17
Scanning system as represented in Chatoyant. (From Kurzweg, T.P. et al., CAD for optical MEMS, Proceedings of the 36th
IEEE/ACM Design Automation Conference (DAC’99), New Orleans, LA, June 20–25, 1999. With permission.)
Nicolescu/Model-Based Design for Embedded Systems 67842_C020 Finals Page 672 2009-10-2
672 Model-Based Design for Embedded Systems
A
xv 3.10a: xv 3.10a: xv 3.10a: xv 3.10a: xv 3.10a:
xv 3.10a:xv 3.10a:xv 3.10a:xv 3.10a:xv 3.10a:
BCDE
Electrode 4
Electrode 3
Electrode 1
Electrode 2
ABCDE
FIGURE 20.18
Scanning waveforms and scanned diamond pattern. (From Kurzweg, T.P.
et al., CAD for optical MEMS, Proceedings of the 36th IEEE/ACM Design
Automation Conference (DAC’99), New Orleans, LA, June 20–25, 1999. With
permission.)
beam, precision in the voltage waveforms is needed so that the light, bend-
ing through the prism, hits the desired detector’s lenslet.
We next simulate a self-aligning system using optical feedback, using the
same system setup as seen in Figure 20.16. Such a system could be used as a
noise suppression system. The scanning mirror is used to actively align the
system, with the electrodes now being controlled by a waveform generator
with a programmed control algorithm. The waveform generator receives the
power values detected on each of the detectors, determines where the beam
is, and which electrodes to apply voltage to in order to steer the beam onto
the center detector.
The system is considered aligned when the power detected on the center
detector matches a threshold value set by the user. The user also specifies, in
the control algorithm, the size of the voltage step that will be placed on the
corresponding electrodes. With active feedback, the system will keep step-
ping enough voltage to the electrodes until the beam is steered onto the cen-
ter detector and the system is aligned. The system, as displayed in Chatoyant,
is shown in Figure 20.19.
Nicolescu/Model-Based Design for Embedded Systems 67842_C020 Finals Page 673 2009-10-2
CAD Tools for Multi-Domain Systems on Chips 673
Const
FIGURE 20.19
Self-aligning system using optical feedback. (From Kurzweg, T.P. et al., J. Model. Simul. Micro-Syst., 2, 21, 2001. With permis-
sion.)
Nicolescu/Model-Based Design for Embedded Systems 67842_C020 Finals Page 674 2009-10-2
674 Model-Based Design for Embedded Systems
(c)
Time
(b)
Time
(a)
Time
xv 3.10a: xv 3.10a: xv 3.10a: xv 3.10a: xv 3.10a:
xv 3.10a:xv 3.10a:xv 3.10a:xv 3.10a:xv 3.10a:xv 3.10a:xv 3.10a:
xv 3.10a: xv 3.10a: xv 3.10a: xv 3.10a: xv 3.10a: xv 3.10a:
FIGURE 20.20
Self-alignment results. (From Kurzweg, T.P. et al., J. Model. Simul. Micro-Syst.,
2, 21, 2001. With permission.)
To simulate this self-aligning system, we introduced random offsets in
the lenses and in the VCSEL position and observe as the beam moves toward
focus on the center detector. Snapshots of the image at the detectors are given
in Figure 20.20 for three cases. The first results, shown in Figure 20.20a, are
when the second lens is offset 35 μminthex-direction. Figure 20.20b shows
the results of the second lenslet offset in both the −x-andy-direction by 35
μm. The final case has both lenses offset. The first is offset by 5 μminthe
x-direction, and the second lens is offset by 35 μminthe−x-direction and 5
μminthey-direction. The results are seen in Figure 20.20c. Notice that the
beam on the final images is not exactly in the center of the middle detector.
This is because of the power being detected at this point exceeding the power
threshold (98.6%) we set for alignment.
20.2.7.3 Angular Spectrum Optical Simulation of the Grating Light Valve
In this section, we simulate and analyze a grating light valve (GLV) sys-
tem in Chatoyant. This device has many display applications, including
digital projection, HDTV, and vehicle displays. The GLV is simply a MEM
Nicolescu/Model-Based Design for Embedded Systems 67842_C020 Finals Page 675 2009-10-2
CAD Tools for Multi-Domain Systems on Chips 675
(micro-electrical-mechanical) phase grating made from parallel rows of
reflective ribbons. When all the ribbons are in the same plane, incident light
that strikes normal to the surface reflects 180 degrees off the GLV. However,
if alternating ribbons are moved down a quarter of a wavelength, a “square-
well” diffraction pattern is created, and the light is reflected at an angle from
that of the incident light. The angle of reflection depends on the width of the
ribbons and the wavelength of the incident light. Figure 20.21 shows the rib-
bons, from both a top and side view, and also the reflection patterns for both
positions of the ribbons.
The GLV component is fabricated using standard silicon VLSI technol-
ogy, with ribbon dimensions approximately 3–5 μm wide and 20–100 μm
long [44]. Each ribbon moves through electrostatic attraction between the
ribbon and an electrode fabricated underneath the ribbon. This electrostatic
attraction moves the ribbons only a few hundred nanometers, resulting in an
approximate switching time of 20 ns. Since the GLV depends on a diffrac-
tive phenomenon to direct the light beam, a rigorous modeling technique is
required for modeling the GLV system.
For the simulation of the GLV, we examine one optical pixel. A projected
pixel is diffracted from a GLV composed of four ribbons, two stationary and
two that are movable [44]. Each ribbon has a length of 20 μmandawidth
of 5 μm. Ideally, there is no gap between the ribbons, however, in reality, a
gap is present and is a function of the feature size of the fabrication. Although
this gap can be modeled in our tool, in these simulations, we provide an ideal
GLV simulation with no gap.
The GLV is modeled as a phase grating, where the light that strikes the
down ribbons propagates a half of a wavelength more than the light that
strikes the up ribbons. In our model, light reflecting from the down ribbons
is multiplied by a phase term. The phase term is similar to a propagation
term through a medium: U
down_ribbon
= U exp(j2kd), where d is the distance
that the ribbon is moved toward the substrate, typically λ/4 for the GLV.
Far-field diffraction theory states that the diffracted angle reflected from
the square-well grating is [36]: θ = qλ/a, where q is the diffraction mode
Down ribbons
(a)
Up ribbons
(b)
Incident Reflected
(c)
Incident
Reflected
Reflected
1/4 λ
Ribbons
FIGURE 20.21
GLV device (a) top view and side view operation for, (b) up ribbons and, (c)
down ribbons.