PROFIT WITH OPTIONS CHAPTER 2 docx
Bạn đang xem bản rút gọn của tài liệu. Xem và tải ngay bản đầy đủ của tài liệu tại đây (618.67 KB, 47 trang )
31
2
OPTIONS AS DIRECT
INDICATORS
L
EARNING
O
BJECTIVES
The material in this chapter will help you to:
• Use options as predictors of market behavior.
• Distinguish between direct indicators and contrary
indicators.
• Use price and volume as technical indicators.
• Read the signs of insider trading.
• Filter out noise from insider trading activity.
• Determine whether to buy options or the underlying
stock.
• Understand event-driven straddle buying.
Most people associate options with a few basic concepts—lever-
age, some sort of protection, or perhaps a way to reduce absolute
risk. But the use of options as a technical indicator in their own
right is not something that is widespread. Some of the concepts
32 OPTIONS AS DIRECT INDICATORS
discussed in this chapter have become a little more common in
recent years—particularly the use of the put-call ratio for mak-
ing broad market predictions—but most investors do not know
how to employ these concepts. In addition, some of the people
attempting to use options as predictors are actually making in-
correct use of the material. So, in this chapter, you learn specif-
ically, and correctly, how to use options to help you in predicting
the movement of the underlying stock, futures, or index. Just
think of this as learning about a new technical indicator.
TECHNICAL INDICATORS
Any technical indicator is either a direct indicator or a contrary
indicator. A direct indicator means that whatever the indica-
tor says about the market is the way that the market is going to
move. With options, there is really only one direct indicator—
the one we are going to discuss first—and that is the tracking of
illegal insider trading. A contrary indicator is one that says
the practitioner should take a market position opposite to what
the indicator is predicting. Most contrary indicators measure
market sentiment, and that is true for the options as well. Un-
fortunately, most of our fellow option traders are wrong most of
the time—especially at major turning points in stocks, futures,
and indices—so if we can measure what they are doing, and
then do the opposite, we should make money. Table 2.1 summa-
rizes the ways in which options can be used as predictors.
Price: Implied Volatility
All of these option technical indicators rely on one of two
things—price or volume—as the foundation for the analysis. Re-
member that implied volatility reflects itself in the price of the
options, so that expensive options have high implied volatility,
and cheap options have low implied volatility. Therefore, when
TEAMFLY
Team-Fly
®
TECHNICAL INDICATORS 33
we talk about using option price as a technical indicator, we
might also say that we are using implied volatility as a techni-
cal indicator. They represent the same thing in this case.
Carrying this thinking one step further, also recall that im-
plied volatility is the volatility that the marketplace is using as
the prediction of the volatility of the underlying instrument
during the life of the option. So, implied volatility is a matter of
opinion among traders; no one knows for sure what it’s going to
be. It is the culmination of all the guesses of all the traders. If,
for some reason, implied volatility moves to one extreme or the
other, there is a great likelihood that it can be used to make de-
cisions about upcoming movements of the underlying instru-
ment. Again, if there is insider knowledge, we should heed what
the implied volatility is saying, but in most cases it is the re-
flection of the opinion of the (uninformed) public, and we should
be prepared to treat it as a contrary indicator. This chapter and
the next will contain many examples of how and where to use
these important technical indicators.
Volume
The other indicator is volume. If we spot the activity of illegal
insider traders as they barge into the option market—perhaps
inflating normal trading patterns five- or tenfold—then that is
a direct indicator. On the other hand, if we measure the public’s
Table 2.1 Using Options as a Predictor
Direct indicator Stock option volume.
Insider trading.
Contrary indicator Option prices.
Option volume.
Theory of contrary The masses are wrong at major turning points.
indicator Option activity is a good way to measure what
(uninformed) speculators are doing.
34 OPTIONS AS DIRECT INDICATORS
trading volume in call options versus put options on a particu-
lar stock or relative sector of stocks, then we might have a use-
ful contrary indicator.
Insider Trading
If someone on Wall Street gets advance knowledge of a takeover
or some other important information that will greatly affect the
price of a stock (earnings surprise, new product announcement,
etc.) greed often takes over, and the person will rush to buy the
stock or the options to make a “sure” profit. Insider trading—
trading with advance knowledge of a corporate event—is illegal,
but that doesn’t keep it from happening. It is as if these in-
vestors have tomorrow’s newspaper and they want to act on it.
(But, if you ever do come across tomorrow’s newspaper—play
the lottery! Forget options!)
They often buy options instead of the underlying because of
the great leverage available when a quick move occurs. We have
seen this type of activity for ages, and we look for signs of it so
that we might know what these insider traders are doing. It is
perfectly legal for us to use their activity as a direct technical in-
dicator and to attempt to “piggy-back” on their trades. Most com-
monly, their activity shows up as dramatically increased trading
volume, but it may also show up as an increase in price levels—
implied volatility—as well. On some occasions, which we’ll dis-
cuss shortly, the increase in implied volatility is our only clue as
to their activities; volume does not increase in those cases. There
are several examples coming up that will clarify these situations.
Simplistically, we want to look for one day’s option activity
on a particular stock’s options to at least double its average ac-
tivity for a day. The average activity is the 20-day moving aver-
age of option volume on that stock. In addition, we want there
to be some sort of absolute volume measure. So, we arbitrarily
set 500 contracts as a minimum number. This would eliminate
wasting our time looking at situations where the average volume
TECHNICAL INDICATORS 35
is 20 contracts a day, and one day that stock’s options total 50
contracts. Insider trading activity will normally generate vol-
ume well in excess of 500 contracts, as long as there is a reason-
able amount of liquidity in the stock options. Once this situation
is identified, we want to buy calls (or buy the underlying stock) if
there is a heavy preponderance of call volume by whomever is
trading these options, and we want to buy puts (or short the un-
derlying stock) if there is heavy put trading by these insiders.
One other thing to look for is some confirmation by the price
of the underlying stock itself. If insiders are buying many calls,
the stock should begin to move up. This happens for at least two
reasons: (1) institutions pick up these rumors, too, and they
often play them by trading stocks; and (2) the market makers
who sell the options to these insiders are not stupid; they want
to hedge themselves after selling the options, and often the best
hedge is to take an offsetting position in the underlying stock.
That is, if the market makers have been selling calls to the in-
siders, then the market makers might go into the stock market
and buy stock to hedge themselves.
From an outsider’s perspective, like ours, what we want to
see is some technical confirmation by the underlying stock. For
example, if there’s a small resistance area above where the
stock is trading, we want to see the stock break through there,
thus giving a technical confirmation to the call buying that we
have been observing and are attributing to insider call buying.
If the stock can’t at least go up while all these calls are being
bought, then perhaps this is not a true insider trading situa-
tion. Table 2.2 shows how insider trading provides signs of
changes in the option market.
These insider-trading situations tend to manifest them-
selves as rumors in the marketplace. They may appear in chat
rooms, on bulletin boards, or in newsletters devoted to this type
of activity (such as our Daily Volume Alerts). If you take the
time to carefully study the option and stock activity in these
situations, you can often weed out the “bad rumors”—those
36 OPTIONS AS DIRECT INDICATORS
cre
ated by someone who wants to move the stock to liquidate his
or her own position. This type of trader often feels that the best
way to move the stock is to start a false rumor. Here is an ex-
ample: A stock suddenly falls dramatically, perhaps on bad
earnings. It is now trading at 10 when it was just trading at 20
a few days ago. Suddenly, a rumor appears that such-and-such a
company is interested in acquiring this stock because its low
stock price is extremely attractive. The stock then rallies from
10 to 13 on heavy volume. Who do you suppose is selling at 13?
Right! The trader who started the rumor at 10, who holds a lot
of stock bought near 20 and wants to unload it! That is a false
rumor, and it can often be identified because it does not fit into
the typical pattern of activity of an insider.
Noise
There may also be noise—trading volume that has nothing to
do with insider trading activity. In that case, we must filter out
that noise lest we be misled into buying stocks on which there
really isn’t any insider trading. This becomes something of an
art. It’s hard to say what a typical day is, because the market is
Table 2.2 Options as Direct Indicators
Volume Alerts
Fact Insiders buy options for leverage.
Signs 1. Daily option volume is more than 2 times average option volume.
2. Total option volume is more than 500 contracts.
Action 1. Filter out noise: covered writes, spreads, arbitrage.
2. Look to buy if call volume is heavy.
3. Look to sell if put volume is more than or equal to 40% of total
volume.
4. Use technical confirmation as well: don’t take a position until
previous day’s range is exceeded.
Note: This process doesn’t really work for futures.
TECHNICAL INDICATORS 37
so dynamic, normally there are between 60 and 100 stocks that
trade more than double their average option activity on any
given day. Of those 60 to 100 stocks, only about 5 to 8 have any
sort of insider trading. The rest are just noise. That is, the vol-
ume in the rest is a result of other types of market activity that
inflate trading volume but are not related to any sort of inside
information on the company.
There are three main types of activity that we classify as
noise, including:
1. Covered call write. Often an institution (mutual fund,
hedge fund, etc.) decides to write calls against a large
block of stock. They may already own the stock, or if the
institution is in the business of hedged option strategies,
they may buy the stock and sell the calls at the same
time. In any case, the option trade is often large and oc-
curs all at one time. Insiders would not be able to buy
5,000 option contracts at one time from a market maker
because they would not have the proper representation by
an institutional broker. What normally happens is that,
say, Morgan Stanley comes to the trading floor and says
to the market makers, “We are going to cross 5,000 IBM
Jan 120 calls to a customer. Do you guys want any?” The
market makers will often take a good portion of the trade
if they think it is priced favorably for them, and Morgan
Stanley will take the rest in their firm’s account. They
will also cross the stock if necessary, and the covered
write is in place. Moreover, it is unlikely that an insider
would be coming in through Morgan Stanley’s institu-
tional desk and even more unlikely that Morgan and/or
the market makers would sell an insider that many calls
at any price. This often results in almost all of the day’s
option volume being in one particular option series—and
it is normally one that is a few months out in time. This is
not the type of option that an insider would buy. If you
38 OPTIONS AS DIRECT INDICATORS
have access to time and sales, you can easily see this; but
even if you don’t, you can still see that there was little ac-
tivity in any other options on this stock.
2. Arbitrage. Recall that we earlier saw which option
positions were equivalent to what stock positions. Long
stock is equivalent to a long call and a short put with the
same terms, and short stock is equivalent to a short call
and a long put with the same terms. If we observe that
most of the heavy option activity in a particular day’s
trading is an approximately equal number of puts and
calls with the same terms, then we can probably surmise
that an arbitrage took place—particularly if there is lit-
tle or no option activity in other options on this stock.
These trades, too, often occur in large blocks. Say
someone buys 50,000 shares of common, sells 500 calls
and buys 500 puts (with the same terms). Do not bother
yourself with why someone is doing this—it is arbitrage,
and it is not available to commission-paying customers
like yourself. This activity can be easily identified with a
time and sales screen, but if you don’t have a time and
sales screen, you can still observe that these large blocks
dominate that day’s option trading and are therefore most
likely noise. An insider wouldn’t buy calls and sell puts—
selling puts takes too much capital and the reward is lim-
ited. This is not what the insider’s interested in.
3.
Spread. Many traders of all kinds do spreads. Spreads gen-
erally limit risk in one manner or another, but also tend to
limit profit potential (you can’t get something for nothing—
especially on Wall Street). However, not wanting to limit
profit potential, an insider wouldn’t bother with a spread.
So, if you observe that there has been a heavy increase in
option activity, but then you notice that most of it is in-
volved in two options that look like a vertical spread
(same expiration month, different strikes) or per
haps a
TECHNICAL INDICATORS 39
calendar spread (different expiration months, same
strike), then it is most likely that a spread was transacted
and that this is not a candidate for insider trading analy-
sis. If you have time and sales, it is often easier to identify
spreads because you can see that both sides of the spread
were transacted in equal quantities and at the same time.
Otherwise, you can make an educated guess.
Table 2.3 provides a summary of option trading patterns
that signify noise rather than insider trading.
Before getting into the actual examples, let me point out a
couple of other things. The information that these insiders have
normally leaks out of corporate offices inadvertently—perhaps
through an outside contractor, such as a printer, law firm, or
accounting firm. Not every takeover is leaked in advance. One
of the largest in history—Disney’s takeover of Cap Cities
Broadcasting—was conceived by the two CEOs at a conference.
Table 2.3 Option Trading Patterns: Noise, Not Insider Option Activity
Assume the average option volume in each of these stocks is 200 contracts
on a given day.
Covered writes XYZ: 50 April 50 call Volume: 50
May 55 call Volume: 20
July 55 call Volume: 1,500
Arbitrage ABC: 60 May 50 call Volume: 1,000
May 50 put Volume: 1,000
April 55 call Volume: 30
Spreads XXX: 25 April 20 call Volume: 800
April 25 call Volume: 800
The ideal pattern XYZ: 50 April May June July
45 300 100
150 20
50 800 300 100 75
55 600 350 50
60 200 100
40 OPTIONS AS DIRECT INDICATORS
They brought in only a handful of top advisors on both sides, so
very few people knew about the pending deal, and all of them
were extremely trustworthy. When the deal was announced,
there had not been even the slightest bit of increased option ac-
tivity in advance of the announcement. “Quiet” deals like this
happen all of the time, but so do the “loud” ones—ones where
we have a chance to play.
This type of analysis only works on stock options. It does
not work on futures options, or on index options. We have tested
it on both, but there is apparently no meaningful information
that can move futures or index markets that is known to only a
few and leaked in advance. We had at one time thought that im-
portant analysts at major firms, who might be ready to upgrade
an entire sector, might tell their best clients in advance, and
we would see activity in the sector index options. But this has
not proven to be true.
Over all, even with all of the work necessary to weed out
noise, bad rumors, and so on, this strategy produces about 45%
to 50% winners, but if you use stops to limit your losses, the
profits can often be large. Adhere to your stops and sell out
when the news that was anticipated actually hits the tape.
Some Examples
The charts in Figures 2.1 through 2.9 depict the situation in the
stock and option markets just before takeovers or earnings sur-
prises were announced. The “option volume” data on the chart
doesn’t show the breakdown as it occurred by strike and expira-
tion month. Therefore, that data is included in the text portion
that follows.
American Cyanamid
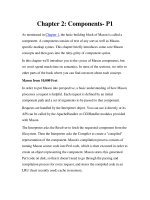
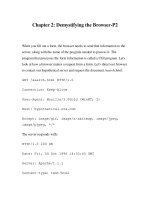
The first example, shown in Figure 2.1, is that of American
Cyanamid (ACY). By late July, the stock was trading near 60,
TECHNICAL INDICATORS 41
and option volume then proceeded to reach the highest levels
ever. On July 29 (a Friday) and August 1 (the following Monday),
the option volume accelerated to extreme levels. The following
table shows the option trading data for July 29, but a very simi-
lar pattern occurred on August 1:
ACY: 63
Expiration Month
August September October January
Strike price 55 calls 100 33
60 calls 542 315
65 calls 1,189 369 45 29
Figure 2.1 American Cyanamid.
103.000
99.625
900
99.375 99.625 941005 000000
99.000
95.000
91.000
87.000
83.000
79.000
75.000
71.000
67.000
63.000
59.000
55.000
51.000
47.000
43.000
39.000
ACY
42 OPTIONS AS DIRECT INDICATORS
A total of 2,622 calls had traded. A total of 297 puts also
traded, scattered among five different series. Average volume at
the time was 697 total contracts. So option volume on this par-
ticular day was about four times the average. You can see that
the speculative look existed in the distribution of the call vol-
ume. Most was in the near term, August, options and most was
in the highest strike (65).
Finally, late in the day on August 1, American Home Prod-
ucts made their bid. ACY was halted on the NYSE at 63 and
reopened at 91 in the third market. This was a successful cul-
mination to the story for option volume observers. Since watch-
ing option volume is a short-term trading activity, these traders
were probably in and out of the stock several times during the
spring and summer of 1994, each time garnering small profits,
until the big strike in early August.
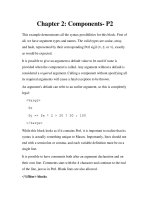
Southern Pacific Railroad
On July 26, 1995, Southern Pacific Railroad (RSP) suddenly
spurted a point higher, from 19 to 20, in one day. See the graph
in Figure 2.2 for an illustration of this data. Option volume was
heavy. Nearly 2,600 contracts traded that day—almost all of
which were calls—as opposed to an average volume of less than
900 contracts daily. August expiration was more than three
weeks away, so there was plenty of trading in the August op-
tions. The call option volume looked like this:
Expiration Month
August September November
Strike price 12
1
⁄
2 calls 30
15 calls 25 50
17
1
⁄
2 calls 220 88
20 calls 1,100 580 120
TEAMFLY
Team-Fly
®
TECHNICAL INDICATORS 43
Only a few puts had traded: 140 of the Aug 17
1
⁄
2
puts and 230
of the Nov 230 puts. The strike price of 20 was the highest strike
price available. Note the preponderance of call volume at that
strike. That is good. Also, note how the August calls are the most
active at the two highest strikes; that is also good. In addition,
the put volume doesn’t seem to indicate much, if any, arbitrage
was going on since there is very little matching of call volume
and put volume in the same series. Finally, there doesn’t really
seem to be much, if any, spread activity either, even if all of the
in-the-money calls were related to spreads against the calls with
a striking price of 20 (and they most assuredly are not all in that
category), that would still leave a lot of specula
tive activity in
Figure 2.2 Southern Pacific Railroad.
28.000
27.000
24.125 23.875 24.000 950828
26.000
25.000
24.000
23.000
22.000
21.000
20.000
19.000
18.000
17.000
16.000
15.000
14.000
13.000
12.000
11.000
A
1995
JMJA
1500
RSP
44 OPTIONS AS DIRECT INDICATORS
both the August 20 and September 20 calls. In fact, it is more
logical to assume that the Nov 20 calls and many of the in-the-
money calls were bought by market makers as a hedge against
the August 20 and September 20 calls they were selling to the
public.
All in all, this is a classic volume pattern, and it was justi-
fied. Option volume remained high as the stock oscillated back
and forth around 20 for the next five days. Then, on the sixth day,
the stock received a takeover bid from Union Pacific Railroad.
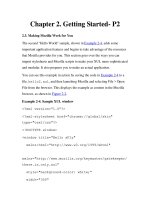
Chipcom
Chipcom (CHPM), shown in Figure 2.3, closed at 26 on Friday,
July 21, 1995, and option volume surged. As shown in the fol-
lowing table, option volume that day had a speculative look to it
as well, although it wasn’t as classic a pattern as some of the
ones described earlier:
A total of 2,014 calls had traded (and 562 puts traded also).
This total volume of 2,576 was huge compared to the average
volume of 280 total contracts per day—more than nine times
the average.
This volume pattern has some slight anomalies in it. First,
the heaviest volume is in the September options, even though
the August options had four weeks of life remaining at the time.
CHPM: 26
Expiration Month
September October January
Strike price 22
1
⁄
2 calls 77 31 28
25 calls 338 1,482 59
30 calls n/a 69 66
TECHNICAL INDICATORS 45
Second, the majority of the volume is in the at-the-money strike
(25) instead of out-of-the-money (30). Both of these facts are
slightly different from what we would hope to observe in an
ideal situation. Note that there were not any August 30 calls
available for trading at the exchange. Because the pattern was
not perfect, technical analysis was relied on: if CHPM could
break out over the 26 level, CHPM should be bought. Surpris-
ingly, even after the breakout, the volume never did develop the
classic pattern, as more September and October options traded
than did August options.
There is one other trait of the Chipcom situation that is in-
teresting—a trait that occurs with some frequency in takeover
Figure 2.3 Chipcom.
48.000
41.500 39.750 39.750 950828
46.000
44.000
42.000
40.000
38.000
36.000
34.000
32.000
30.000
28.000
26.000
24.000
22.000
20.000
18.000
16.000
A
1995
JMJA
900
CHPM
46 OPTIONS AS DIRECT INDICATORS
situations: the stock, while trading down, becomes a takeover
target because of its low stock price. It’s sort of a Catch-22 sit-
uation. The target company is doing poorly and its earnings are
bad, so the stock sells off. However, if they have a good basic
business, product, and so on, the low stock price itself may raise
the eyebrows of cash-rich companies in its field. These cash-
rich companies can then step in and buy the relatively low-
priced stock for what they feel is a reasonable price. In the case
of Chipcom, the stock had traded as high as 51 in late 1994 (not
shown on Figure 2.3), before plunging to a low of 20 in May
1995. This vast decrease in stock price obviously attracted the
attention of Three Com, who apparently saw an opportunity to
buy a (mismanaged?) company at a price well below its highs of
the previous year.
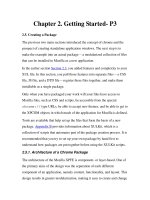
Federal Paperboard
Option activity, shown in Figure 2.4, in Federal Paperboard
(FBO)—since it came from essentially zero volume to heavy ac-
tivity in just a matter of a day or two—does not need to be shown
in detail to verify that it was of the speculative type. You can
rest assured that any explosion in activity like that over the
course of several days is speculative activity. What is perhaps
more interesting here is how the expensiveness of the options
dictated a slightly different strategy—one that paid off with op-
timum returns in this case.
With FBO at about 41 in early November 1995, option vol-
ume was very strong, so that a purchase was in order. However,
the options were extremely expensive:
FBO: 41
Call option: Price November 40 call: 4
November 45 call: 2
November 50 call: 1
TECHNICAL INDICATORS 47
These options had only a couple of weeks of life remaining,
so you can see how heavy the speculation was. We recommended
that our customers purchase the Nov 45 to Nov 50 call bull
spread. This cost a point, or perhaps 1
1
⁄
4, the next day. Within a
week, the stock was taken over, and it traded at 53. The spread
was removed for 4
7
⁄
8. This is a classic case of why a bull spread
is sometimes useful.
For comparison purposes, let’s say the spread was sold for
5, and any of the other options could have been sold at parity
with the stock at 53. Then the following table compares the
various returns that would have been available from various
purchases:
Figure 2.4 Federal Paperboard.
56.000
51.250 50.875 51.000 951109
54.000
52.000
50.000
48.000
46.000
44.000
42.000
40.000
38.000
36.000
34.000
32.000
30.000
28.000
26.000
24.000
J
1995
SAON
1300
FBO
48 OPTIONS AS DIRECT INDICATORS
Thus, the spread was the best choice, by far, in terms of re-
turns realized. The reason that it was able to outperform the
other calls was that each individual call was so expensive to begin
with that it hampered the overall returns. However, at least in
the bull spread situation, we were both buying and selling an
Purchase Cost Sale Price Return
Bull spread 1 5 400%
November 40 call 4 13 225
November 45 call 2 8 300
November 50 call 1 3 200
Common stock 41 53 29
Figure 2.5 Gerber.
55.000
51.125 51.000 51.000 910624
53.000
51.000
49.000
47.000
45.000
43.000
41.000
39.000
37.000
35.000
33.000
31.000
29.000
27.000
25.000
23.000
O
1993 1994
D
N
JFMAMJ
3400
GEB
TECHNICAL INDICATORS 49
ex
pensive option, and that balanced itself out somewhat. Had the
takeover been at a much higher price, the spread would not have
been the best winner, but it would still have done very well, and
its initial cost was small—only one point.
Gerber
Gerber (GEB) is an interesting story because it illustrates both
ways that a takeover can be signaled in advance by option trad-
ing: (1) volume and (2) price. This example, illustrated in Figure
2.5, deals with the volume example. The price example will fol-
low in a few pages.
Until early March 1994, Gerber was trading in a very tight
range of 27 to 29 with no option volume on most days. Then, in
March the stock broke out to 33, accompanied by heavy call vol-
ume. A couple of weeks later, the stock managed to move up to
35 intraday, and option volume remained relatively heavy on
most days. Rumors of a takeover were rampant, and when noth-
ing happened, traders began to exit the stock. So Gerber fell all
the way back to 29 by mid-April.
Then, on May 6, the stock jumped two points, from 31 to
over 33, and option volume hit its highest levels ever. This was a
clear signal that the stock was in play once again. On that day,
option volume looked like this:
This is another classic example of what speculative option
volume looks like in advance of corporate news. Nearly 8,800
GEB: 33
5
⁄
8
Expiration Month
May June July October
Strike price 25 calls 78 15 40 2
30 calls 1,909 414 268 29
35 calls 4,112 1,079 584 252
50 OPTIONS AS DIRECT INDICATORS
calls traded that day, and about 400 puts traded as well. At the
time, average daily option volume was 2,770 contracts. This
tripling of normal volume was an impressive sign that some-
thing was happening in Gerber.
The stock continued to climb higher over the next two
weeks, and option volume rose to ever loftier levels. The peak
price was 37, and by Friday, May 20 (option expiration day for
the May options), Gerber had fallen back a little to close at 34
5
⁄
8.
The takeover bid was received that Friday night—after the
market had closed and after time to file exercise notices had ex-
pired. On Monday, Gerber opened at 51.
Much to their chagrin, some option writers were assigned
out-of-the-money May 35 calls! They had gone home Friday night
assuming that their written May 35 calls had expired worthless.
Such an assignment means that someone “knew” enough to exer-
cise out-of-the-money calls that were expiring, before the takeover
bid was made public! Not all of the May 35 calls were exercised,
but those that were smacked of some sort of insider knowledge.
Why else would someone exercise an out-of-the-money option?
That is the height of chutzpah. There were lawsuits filed and in-
vestigations begun, but nothing was ever proven regarding any il-
legal nature of the exercises.
This example illustrates that trading with inside knowledge
will probably never cease. Obviously, these people’s greed over-
came their fear of being caught—even though an option exercise
should leave a fairly clear trail. Somehow, they were able to
avoid prosecution. I’m not sure why—lack of arduous pursuit by
investigators, use of offshore brokers, and so on—but it demon-
strates that it pays to watch what these insiders are doing and
to mimic it.
Duracell
The story of Duracell (DUR) is reflected in Figure 2.6. The in-
siders were so bold as to buy every option in sight just two days
TECHNICAL INDICATORS 51
before the takeover was announced—inflating option volume
nearly tenfold in the process. They bought some options as low
as
1
⁄
16 of a point ($6.25 apiece) and sold them two days later for
$1,100 each. The market makers clamored for justice and the
Wall Street Journal splashed the news on the front page. Surely,
if anyone was ever going to be caught, this was going to be the
time. Yet, no one was caught. If they ever had been, it sure
would have once again been splashed all over the Wall Street
Journal’s front page. The crooks hid behind the safety of an off-
shore account.
Yet there is no need for us to engage in anything illegal as
long as we have the capability of observing activity such as this.
In fact, the only people that the SEC has actually charged and
Figure 2.6 Duracell.
67.000
65.000
61.500 60.000 61.375 960923
63.000
61.000
59.000
57.000
55.000
53.000
51.000
49.000
47.000
45.000
43.000
41.000
39.000
37.000
35.000
J
1996
JAS
DUR
1050
52 OPTIONS AS DIRECT INDICATORS
caught in this regard (besides Ivan Boesky and Michael Milken)
are fairly small fry—corporate insiders who tell a relative or a
neighbor about some inside information. Then, after the relative
makes a completely traceable trade, and after the takeover, or
whatever, occurs, and the exchange begins an investigation, the
relatives are caught. Usually the penalty is a disgorgement of
the profits, plus some sort of fine.
Of course, there’s all the bad publicity that goes with it as
well. If you should ever be tempted to try to act on some illegal
insider information yourself, just ask yourself how you would
feel if you opened the local newspaper and read in the headline
“Local Man Arrested for Illegal Insider Trading”? I recently had
someone call me with information that a family member, who
was the CFO of a small NASDAQ-listed company, had told an-
other family member that the earnings were going to be better
than expected. Many of the family members were rushing out
to buy the stock. This particular family member, though, asked
me before buying, and I asked him the preceding question.
Since he was a fairly well-known public figure locally, he
thought about it for a minute, realized he would never make
enough money from such a trade to compensate for the public
embarrassment of an arrest and probably the loss of his job and
therefore refrained from the purchase. If the opportunity ever
presents itself, you should also refrain from making an illegal
insider purchase.
WHICH OPTION TO BUY
I am often asked whether I buy stock or options when I uncover
one of these situations. If there is an in-the-money option with
very little time value premium, then I will buy the option. Oth-
erwise, I buy the underlying stock. Since it is often the case
that this increased option activity results in the options quickly
becoming expensive, I do not buy at- or out-of-the-money calls
TEAMFLY
Team-Fly
®
WHICH OPTION TO BUY 53
on these stocks. That is just too risky because the premium will
disappear if the stock is taken over or if the rumor is denied.
You don’t want to be holding thin air when that happens. The
absolute worst feeling is to be right about a stock being taken
over, but to see it advance only a point or two, and to see your
options deflate to the point where you lose money.
I also buy the shortest-term option available (unless there’s
less than a week to go until expiration). This is another way to
minimize time-value premium expense. By owning a short-
term, in-the-money option, I have one with a very high delta—
that is, one that behaves like the underlying stock.
Such an option still provides plenty of leverage should a
takeover occur. Moreover, if the stock moves up at all, this op-
tion will increase in price so there will be some profit in the
trade. Sure, if there is a takeover 30 points higher, then this op-
tion won’t provide the same leverage as one that was well out-of-
the-money would have, but how often is a “telegraphed”
takeover going to increase that much in price? Not often, I can
assure you.
Two examples illustrate these points. First, suppose that
there is a takeover rumor in a stock, and the options are not too
expensive. In that case, the option arrays might look something
like this:
These options are trading with an implied volatility of 50%.
That is fairly high for a regular stock, but not necessarily high
Date: September 1
Stock: 44
Options Price Delta
September 35 call: 9
1
⁄
8 0.99
September 40 call: 4
1
⁄
2 0.84
September 45 call: 1
1
⁄
2 0.44
September 50 call:
1
⁄
2 0.13
54 OPTIONS AS DIRECT INDICATORS
for a takeover rumor. In the real world, we would be able to com-
pare the current level of implied volatility with the point at
which implied volatility normally trades, but that’s not impor-
tant for this example.
I would probably buy the Sept 35 call because it barely has
any time value premium, and its delta indicates that it behaves
just like stock. The Sept 40 would be a reasonable choice as well,
although with less than three weeks remaining until expira-
tion, the loss of the half point of time-value premium is a sig-
nificant percentage. Neither the Sept 45 nor the Sept 50 call
would be an acceptable purchase. In many cases, the stock rises
in advance of the actual takeover announcement since the op-
tion volume is publicized in newsletters and the media. Hence, a
takeover might occur at only a slightly higher price. If this
stock were to receive a takeover bid at 46 tomorrow, both the
Sept 45 call and the Sept 50 would lose money. The other two
would profit.
Now let’s look at a similar, but slightly different, example—
one where the options are really expensive, probably because the
rumor has been whipped into a frenzy by the media or perhaps
because the insiders are just so obviously aggressive that they
have kept buying and buying, thereby forcing prices to ex-
tremely high levels:
Date: September 1
Stock: 44
Options Price Delta
September 35 call: 9
3
⁄
8 0.92
September 40 call: 5
1
⁄
2 0.74
September 45 call: 2
3
⁄
4 0.49
September 50 call: 1
1
⁄
4 0.27
WHICH OPTION TO BUY 55
In this case, things are substantially different. Even the
deeply in-the-money Sept 35 call has a little bit of time-value
premium. All of the other options have an excessive amount of
time-value premium. When I see something like this, my two
choices are (1) to buy the Sept 35 call or (2) to buy the underly-
ing stock. Nothing else is a reasonable alternative. You might
think that the extremely overpriced options indicate that the
stock will be taken out at a very high price, but that’s not nec-
essarily so. If the rumors have been circulating heavily in the
chat rooms on the Internet, there is a strong possibility that a
lot of careless buyers have jumped into these calls, thereby in-
flating them beyond all reason. Usually the rumored takeover
price in these chat rooms is well above what turns out to be the
actual takeover price. Consequently, the purchase of options
with a lot of time-value premium is a risky endeavor and should
be avoided.
More Examples
Motorola
This example, illustrated by the graph in Figure 2.7 on page 57,
shows how option volume may “predict” earnings surprises.
This happens for the same reasons that takeovers are predicted
by option volume—someone is privy to inside information in ad-
vance, and to take advantage of the leverage, they trade options
in fairly large size for their own account prior to the event. This
is also illegal, but once again if we are following volume pat-
terns, we can capitalize on the insiders’ trading pattern.
The following data is from the first day of increased option
volume—July 6—and is representative of the pattern that oc-
curred during each of the four days prior to the actual release of
earnings. Since a large volume of puts traded that day, as well
as calls, the data that follows details the trading in all options: