Managing and Mining Graph Data part 10 potx
Bạn đang xem bản rút gọn của tài liệu. Xem và tải ngay bản đầy đủ của tài liệu tại đây (1.75 MB, 10 trang )
Graph Mining: Laws and Generators 71
Symbol Description
𝑁 Number of nodes in the graph
𝐸 Number of edges in the graph
𝑘 Degree for some node
< 𝑘 > Average degree of nodes in the graph
𝐶𝐶 Clustering coefficient of the graph
𝐶𝐶(𝑘) Clustering coefficient of degree-𝑘 nodes
𝛾 Power law exponent: 𝑦(𝑥) ∝ 𝑥
−𝛾
𝑡 Time/iterations since the start of an algorithm
Table 3.1. Table of symbols
ideas. Our focus is on combining sources from all the different fields, to gain
a coherent picture of the current state-of-the-art. The interested reader is also
referred to some excellent and entertaining books on the topic [12, 81, 35].
The organization of this chapter is as follows. In section 2, we discuss graph
patterns that appear to be common in real-world graphs. Then, in section 3, we
describe some graph generators which try to match one or more of these pat-
terns. Typically, we only provide the main ideas and approaches; the interested
reader can read the relevant references for details. In all of these, we attempt to
collate information from several fields of research. Table 3.1 lists the symbols
we will use.
2. Graph Patterns
What are the distinguishing characteristics of graphs? What “rules” and
“patterns” hold for them? When can we say that two different graphs are simi-
lar to each other? In order to come up with models to generate graphs, we need
some way of comparing a natural graph to a synthetically generated one; the
better the match, the better the model. However, to answer these questions, we
need to have some basic set of graph attributes; these would be our vocabulary
in which we can discuss different graph types. Finding such attributes will be
the focus of this section.
What is a “good” pattern? One that can help distinguish between an actual
real-world graph and any fake one. However, we immediately run into several
problems. First, given the plethora of different natural and man-made phe-
nomena which give rise to graphs, can we expect all such graphs to follow any
particular patterns? Second, is there any single pattern which can help differ-
entiate between all real and fake graphs? A third problem (more of a constraint
than a problem) is that we want to find patterns which can be computed effi-
ciently; the graphs we are looking at typically have at least around 10
5
nodes
and 10
6
edges. A pattern which takes 𝑂(𝑁
3
) or 𝑂(𝑁
2
) time in the number of
nodes 𝑁 might easily become impractical for such graphs.
72 MANAGING AND MINING GRAPH DATA
The best answer we can give today is that while there are many differ-
ences between graphs, some patterns show up regularly. Work has focused
on finding several such patterns, which together characterize naturally occur-
ring graphs. A large portion of the literature focuses on two major properties:
power laws and small diameters. Our discussion will address both of these
properties. For each pattern, we also give the computational requirements for
finding/computing the pattern, and some real-world examples of that pattern.
Definitions are provided for key ideas which are used repeatedly. Next, we
will discuss other patterns of interest, both in static snapshots of graphs and
in evolving graphs. Finally, we discuss patterns specific to some well-known
graphs, like the Internet and the WWW.
2.1 Power Laws and Heavy-Tailed Distributions
While the Gaussian distribution is common in nature, there are many cases
where the probability of events far to the right of the mean is significantly
higher than in Gaussians. In the Internet, for example, most routers have a
very low degree (perhaps “home” routers), while a few routers have extremely
high degree (perhaps the “core” routers of the Internet backbone) [43]. Power-
law distributions attempt to model this.
We will divide the following discussion into two parts. First, we will dis-
cuss “traditional” power laws: their definition, how to compute them, and real-
world examples of their presence. Then, we will discuss deviations from pure
power laws, and some common methods to model these.
“Traditional” Power Laws.
Definition 3.1 (Power Law). Two variables 𝑥 and 𝑦 are related by a power
law when:
𝑦(𝑥) = 𝐴𝑥
−𝛾
(3.1)
where 𝐴 and 𝛾 are positive constants. The constant 𝛾 is often called the power
law exponent.
Definition 3.2 (Power Law Distribution). A random variable is distributed
according to a power law when the probability density function (pdf) is given
by:
𝑝(𝑥) = 𝐴𝑥
−𝛾
, 𝛾 > 1, 𝑥 ≥ 𝑥
𝑚𝑖𝑛
(3.2)
The extra 𝛾 > 1 requirement ensures that 𝑝(𝑥) can be normalized. Power laws
with 𝛾 < 1 rarely occur in nature, if ever [66].
Skewed distributions, such as power laws, occur very often. In the Internet
graph, the degree distribution follows such a power law [43]; that is, the count
Graph Mining: Laws and Generators 73
1
10
100
1000
10000
100000
1 10 100 1000 10000
Count
In-degree
Epinions In-degree
1
10
100
1000
10000
100000
1 10 100 1000 10000
Count
Out-degree
Epinions Out-degree
1
10
100
1000
10000
1 10 100 1000 10000
Count
Out-degree
Clickstream Out-degree
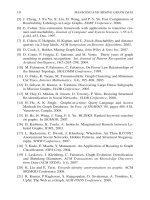
(a) Epinions In-degree (b) Epinions Out-degree (c) Clickstream Out-degree
Figure 3.1. Power laws and deviations: Plots (a) and (b) show the in-degree and out-degree
distributions on a log-log scale for the Epinions graph (an online social network of 75, 888 people
and 508, 960 edges [34]). Both follow power-laws. In contrast, plot (c) shows the out-degree
distribution of a Clickstream graph (a bipartite graph of users and the websites they surf [63]),
which deviates from the power-law pattern.
𝑐
𝑘
of nodes with degree 𝑘, versus the degree 𝑘, is a line on a log-log scale. The
eigenvalues of the adjacency matrix of the Internet graph also show a similar
behavior: when eigenvalues are plotted versus their rank on a log-log scale
(called the scree plot), the result is a straight line. A possible explanation of
this is provided by Mihail and Papadimitriou [61]. The World Wide Web graph
also obeys power laws [51]: the in-degree and out-degree distributions both
follow power-laws, as well as the number of the so-called “bipartite cores”
(≈ communities, which we will see later) and the distribution of PageRank
values [23, 73]. Redner [76] shows that the citation graph of scientific literature
follows a power law with exponent 3. Figures 3.1(a) and 3.1(b) show two
examples of power laws.
The significance of a power law distribution 𝑝(𝑥) lies in the fact that it decay
only polynomially quickly as 𝑥 → ∞, instead of exponential decay for the
Gaussian distribution. Thus, a power law degree distribution would be much
more likely to have nodes with a very high degree (much larger than the mean)
than the Gaussian distribution. Graphs exhibiting such degree distributions are
called scale-free graphs, because the form of 𝑦(𝑥) in Equation 3.1 remains
unchanged to within a multiplicative factor when the variable 𝑥 is multiplied
by a scaling factor (in other words, 𝑦(𝑎𝑥) = 𝑏𝑦(𝑥)). Thus, there is no special
“characteristic scale” for the variables; the functional form of the relationship
remains the same for all scales.
Computation issues:. The process of finding a power law pattern can be
divided into three parts: creating the scatter plot, computing the power law
exponent, and checking for goodness of fit. We discuss these issues below,
using the detection of power laws in degree distributions as an example.
Creating the scatter plot (for the degree distribution):
The algorithm for cal-
culating the degree distributions (irrespective of whether they are power laws
or not) can be expressed concisely in SQL. Assuming that the graph is repre-
74 MANAGING AND MINING GRAPH DATA
sented as a table with the schema Graph(fromnode, tonode), the code for
calculating in-degree and out-degree is given below. The case for weighted
graphs, with the schema Graph(fromnode, tonode, weight), is a simple
extension of this.
SELECT outdegree, count(*)
FROM
(SELECT count(*) AS outdegree
FROM Graph
GROUP BY fromnode)
GROUP BY outdegree
SELECT indegree, count(*)
FROM
(SELECT count(*) AS indegree
FROM Graph
GROUP BY tonode)
GROUP BY indegree
Computing the power law exponent This is no simple task: the power law
could be only in the tail of the distribution and not over the entire distribution,
estimators of the power law exponent could be biased, some required assump-
tions may not hold, and so on. Several methods are currently employed, though
there is no clear “winner” at present.
1 Linear regression on the log-log scale: We could plot the data on a log-
log scale, then optionally “bin” them into equal-sized buckets, and fi-
nally find the slope of the linear fit. However, there are at least three
problems: (i) this can lead to biased estimates [45], (ii) sometimes the
power law is only in the tail of the distribution, and the point where the
tail begins needs to be hand-picked, and (iii) the right end of the distri-
bution is very noisy [66]. However, this is the simplest technique, and
seems to be the most popular one.
2 Linear regression after logarithmic binning: This is the same as above,
but the bin widths increase exponentially as we go towards the tail. In
other words, the number of data points in each bin is counted, and then
the height of each bin is then divided by its width to normalize. Plotting
the histogram on a log-log scale would make the bin sizes equal, and the
power-law can be fitted to the heights of the bins. This reduces the noise
in the tail buckets, fixing problem (iii). However, binning leads to loss of
information; all that we retain in a bin is its average. In addition, issues
(i) and (ii) still exist.
3 Regression on the cumulative distribution: We convert the pdf 𝑝(𝑥) (that
is, the scatter plot) into a cumulative distribution 𝐹 (𝑥):
𝐹 (𝑥) = 𝑃 (𝑋 ≥ 𝑥) =
∞
∑
𝑧=𝑥
𝑝(𝑧) =
∞
∑
𝑧=𝑥
𝐴𝑧
−𝛾
(3.3)
Graph Mining: Laws and Generators 75
The approach avoids the loss of data due to averaging inside a histogram
bin. To see how the plot of 𝐹 (𝑥) versus 𝑥 will look like, we can bound
𝐹 (𝑥):
∫
∞
𝑥
𝐴𝑧
−𝛾
𝑑𝑧 < 𝐹(𝑥) < 𝐴𝑥
−𝛾
+
∫
∞
𝑥
𝐴𝑧
−𝛾
𝑑𝑧
⇒
𝐴
𝛾 − 1
𝑥
−(𝛾−1)
< 𝐹 (𝑥) < 𝐴𝑥
−𝛾
+
𝐴
𝛾 − 1
𝑥
−(𝛾−1)
⇒ 𝐹 (𝑥) sim 𝑥
−(𝛾−1)
(3.4)
Thus, the cumulative distribution follows a power law with exponent
(𝛾 − 1). However, successive points on the cumulative distribution plot
are not mutually independent, and this can cause problems in fitting the
data.
4 Maximum-Likelihood Estimator (MLE): This chooses a value of the power
law exponent 𝛾 such that the likelihood that the data came from the cor-
responding power law distribution is maximized. Goldstein et al [45]
find that it gives good unbiased estimates of 𝛾.
5 The Hill statistic: Hill [48] gives an easily computable estimator, that
seems to give reliable results [66]. However, it also needs to be told
where the tail of the distribution begins.
6 Fitting only to extreme-value data: Feuerverger and Hall [44] propose
another estimator which is claimed to reduce bias compared to the Hill
statistic without significantly increasing variance. Again, the user must
provide an estimate of where the tail begins, but the authors claim that
their method is robust against different choices for this value.
7 Non-parametric estimators: Crovella and Taqqu [31] propose a non-
parametric method for estimating the power law exponent without re-
quiring an estimate of the beginning of the power law tail. While there
are no theoretical results on the variance or bias of this estimator, the
authors empirically find that accuracy increases with increasing dataset
size, and that it is comparable to the Hill statistic.
Checking for goodness of fit
The correlation coefficient has typically been used
as an informal measure of the goodness of fit of the degree distribution to a
power law. Recently, there has been some work on developing statistical “hy-
pothesis testing” methods to do this more formally. Beirlant et al. [15] derive
a bias-corrected Jackson statistic for measuring goodness of fit of the data to
76 MANAGING AND MINING GRAPH DATA
a generalized Pareto distribution. Goldstein et al. [45] propose a Kolmogorov-
Smirnov test to determine the fit. Such measures need to be used more often in
the empirical studies of graph datasets.
Examples of power laws in the real world. Examples of power law degree
distributions include the Internet AS
1
graph with exponent 2.1 − 2.2 [43], the
Internet router graph with exponent s im 2.48 [43, 46], the in-degree and out-
degree distributions of subsets of the WWW with exponents 2.1 and 2.38−2.72
respectively [13, 54, 24], the in-degree distribution of the African web graph
with exponent 1.92 [19], a citation graph with exponent 3 [76], distributions
of website sizes and traffic [2], and many others. Newman [66] provides a
comprehensive list of such work.
Deviations from Power Laws.
Informal description.
While power laws appear in a large number of
graphs, deviations from a pure power law are sometimes observed. We discuss
these below.
Detailed description. Pennock et al. [75] and others have observed devia-
tions from a pure power law distribution in several datasets. Two of the more
common deviations are exponential cutoffs and lognormals.
Exponential cutoffs
Sometimes, the distribution looks like a power law over
the lower range of values along the 𝑥-axis, but decays very fast for higher val-
ues. Often, this decay is exponential, and this is usually called an exponential
cutoff:
𝑦(𝑥 = 𝑘) ∝ 𝑒
−𝑘/𝜅
𝑘
−𝛾
(3.5)
where 𝑒
−𝑘/𝜅
is the exponential cutoff term and 𝑘
−𝛾
is the power law term.
Amaral et al. [10] find such behaviors in the electric power-grid graph of South-
ern California and the network of airports, the vertices being airports and the
links being non-stop connections between them. They offer two possible ex-
planations for the existence of such cutoffs. One, high-degree nodes might
have taken a long time to acquire all their edges and now might be “aged”,
and this might lead them to attract fewer new edges (for example, older actors
might act in fewer movies). Two, high-degree nodes might end up reaching
their “capacity” to handle new edges; this might be the case for airports where
airlines prefer a small number of high-degree hubs for economic reasons, but
are constrained by limited airport capacity.
Lognormals or the “DGX” distribution
Pennock et al. [75] recently found
while the whole WWW does exhibit power law degree distributions, subsets of
Graph Mining: Laws and Generators 77
the WWW (such as university homepages and newspaper homepages) deviate
significantly. They observed unimodal distributions on the log-log scale. Sim-
ilar distributions were studied by Bi et al. [17], who found that a discrete trun-
cated lognormal (called the Discrete Gaussian Exponential or “DGX” by the
authors) gives a very good fit. A lognormal is a distribution whose logarithm
is a Gaussian; it looks like a truncated parabola in log-log scales. The DGX
distribution extends the lognormal to discrete distributions (which is what we
get in degree distributions), and can be expressed by the formula:
𝑦(𝑥 = 𝑘) =
𝐴(𝜇, 𝜎)
𝑘
exp
[
−
(ln 𝑘 − 𝜇)
2
2𝜎
2
]
𝑘 = 1, 2, . . . (3.6)
where 𝜇 and 𝜎 are parameters and 𝐴(𝜇, 𝜎) is a constant (used for normalization
if 𝑦(𝑥) is a probability distribution). The DGX distribution has been used to fit
the degree distribution of a bipartite “clickstream” graph linking websites and
users (Figure 3.1(c)), telecommunications and other data.
Examples of deviations from power laws in the real world
Several data sets
have shown deviations from a pure power law [10, 75, 17, 62]: examples in-
clude the electric power-grid of Southern California, the network of airports,
several topic-based subsets of the WWW, Web “clickstream” data, sales data
in retail chains, file size distributions, and phone usage data.
2.2 Small Diameters
Informal description:. Travers and Milgram [80] conducted a famous ex-
periment where participants were asked to reach a randomly assigned target
individual by sending a chain letter. They found that for all the chains that
completed, the average length of such chains was six, which is a very small
number considering the large population the participants and targets were cho-
sen from. This leads us to believe in the concept of “six degrees of separation”:
the diameter of a graph is an attempt to capture exactly this.
Detailed description. Several (often related) terms have been used to
describe the idea of the “diameter” of a graph:
Expansion and the “hop-plot”: Tangmunarunkit et al. [78] use a well-
known metric from theoretical computer science called “expansion,”
which measures the rate of increase of neighborhood with increasing
ℎ. This has been called the “hop-plot” elsewhere [43].
Definition 3.3 (Hop-plot). Starting from a node 𝑢 in the graph, we find
the number of nodes 𝑁
ℎ
(𝑢) in a neighborhood of ℎ hops. We repeat this
starting from each node in the graph, and sum the results to find the total
78 MANAGING AND MINING GRAPH DATA
1e+06
1e+07
1e+08
1e+09
1e+10
1e+11
1e+12
1 2 3 4 5 6 7 8 9 10
Number of reachable pairs of nodes
Hops
Epinions Hop-plot
Diameter = 6
Figure 3.2. Hop-plot and effective diameter This is the hop-plot of the Epinions graph [34, 28]. We
see that the number of reachable pairs of nodes flattens out at around 6 hops; thus the effective
diameter of this graph is 6.
neighborhood size 𝑁
ℎ
for ℎ hops (𝑁
ℎ
=
∑
𝑢
𝑁
ℎ
(𝑢)). The hop-plot is
just the plot of 𝑁
ℎ
versus ℎ.
Effective diameter or Eccentricity: The hop-plot can be used to calculate
the effective diameter (also called the eccentricity) of the graph.
Definition 3.4 (Effective diameter). This is the minimum number of
hops in which some fraction (say, 90%) of all connected pairs of nodes
can reach each other [79].
Figure 3.2 shows the hop-plot and effective diameter of an example
graph.
Characteristic path length: For each node in the graph, consider the
shortest paths from it to every other node in the graph. Take the average
length of all these paths. Now, consider the average path lengths for all
possible starting nodes, and take their median. This is the characteristic
path length [25].
Average diameter: This is calculated in the same way as the characteris-
tic path length, except that we take the mean of the average shortest path
lengths over all nodes, instead of the median.
While the use of “expansion” as a metric is somewhat vague
2
, most of the
other metrics are quite similar. The advantage of eccentricity is that its defini-
tion works, as is, even for disconnected graphs, whereas we must consider only
the largest component for the characteristic and average diameters. Character-
istic path length and eccentricity are less vulnerable to outliers than average
diameter, but average diameter might be the better if we want worst case anal-
ysis.
A concept related to the hop-plot is that of the hop-exponent:
Faloutsos et al. [43] conjecture that for many graphs, the neighborhood size 𝑁
ℎ
Graph Mining: Laws and Generators 79
grows exponentially with the number of hops ℎ. In other words, 𝑁
ℎ
= 𝑐ℎ
ℋ
for ℎ much less than the diameter of the graph. They call the constant ℋ the
hop-exponent. However, the diameter is so small for many graphs that there
are too few points in the hop-plot for this premise to be verified and to calculate
the hop-exponent with any accuracy.
Computational issues. One major problem with finding the diameter is
the computational cost: all the definitions essentially require computing the
“neighborhood size” of each node in the graph. One approach is to use re-
peated matrix multiplications on the adjacency matrix of the graph; however,
this takes asymptotically 𝑂(𝑁
2.88
) time and 𝑂(𝑁
2
) memory space. Another
technique is to do breadth-first searches from each node of the graph. This
takes 𝑂(𝑁 + 𝐸) space but requires 𝑂(𝑁𝐸) time. Another issue with breadth-
first search is that edges are not accessed sequentially, which can lead to terrible
performance on disk-resident graphs. Palmer et al. [71] find that randomized
breadth-first search algorithms are also ill-suited for large graphs, and they pro-
vide a randomized algorithm for finding the hop-plot which takes 𝑂((𝑁+𝐸)𝑑)
time and 𝑂(𝑁) space (apart from the storage for the graph itself), where 𝑁 is
the number of nodes, 𝐸 the number of edges and 𝑑 the diameter of the graph
(typically very small). Their algorithm offers provable bounds on the quality
of the approximated result, and requires only sequential scans over the data.
They find the technique to be far faster than exact computation, and providing
much better estimates than other schemes like sampling.
Examples in the real world. The diameters of several naturally occur-
ring graphs have been calculated, and in almost all cases they are very small
compared to the graph size. Faloutsos et al. [43] find an effective diameter of
around 4 for the Internet AS level graph and around 12 for the Router level
graph. Govindan and Tangmunarunkit [46] find a 97%-effective diameter of
around 15 for the Internet Router graph. Broder et al. [24] find that the av-
erage path length in the WWW (when a path exists at all) is about 16 if we
consider the directions of links, and around 7 if all edges are considered to be
undirected. Albert et al. [8] find the average diameter of the webpages in the
nd.edu domain to be 11.2. Watts and Strogatz [83] find the average diameters
of the power grid and the network of actors to be 18.7 and 3.65 respectively.
Many other such examples can be found in the literature; Tables 1 and 2 of [7]
and table 3.1 of [65] list some such work.
2.3 Other Static Graph Patterns
Apart from power laws and small diameters, some other patterns have been
observed in large real-world graphs. These include the resilience of such
80 MANAGING AND MINING GRAPH DATA
graphs to random failures, and correlations found in the joint degree distri-
butions of the graphs. Additionally, we observe structural patterns in the edge
weights in static snapshots of graphs. We will explore these topics below.
Resilience.
Informal description.
The resilience of a graph is a measure of its ro-
bustness to node or edge failures. Many real-world graphs are resilient against
random failures but vulnerable to targeted attacks.
Detailed description. There are at least two definitions of resilience:
Tangmunarunkit et al. [78] define resilience as a function of the number
of nodes 𝑛: the resilience 𝑅(𝑛) is the “minimum cut-set” size within
an 𝑛-node ball around any node in the graph (a ball around a node
𝑋 refers to a group of nodes within some fixed number of hops from
node 𝑋). The “minimum cut-set” is the minimum number of edges that
need to be cut to get two disconnected components of roughly equal
size; intuitively, if this value is large, then it is hard to disconnect the
graph and disrupt communications between its nodes, implying higher
resilience. For example, a 2D grid graph has 𝑅(𝑛) ∝
√
𝑛 while a tree
has 𝑅(𝑛) = 1; thus, a tree is less resilient than a grid.
Resilience can be related to the graph diameter: a graph whose diam-
eter does not increase much on node or edge removal has higher re-
silience [71, 9].
Computation issues. Calculating the “minimum cut-set” size is NP-hard,
but approximate algorithms exist [49]. Computing the graph diameter is also
costly, but fast randomized algorithms exist [71].
Examples in the real world. In general, most real-world networks appear
to be resilient against random node/edge removals, but are susceptible to tar-
geted attacks: examples include the Internet Router-level and AS-level graphs,
as well as the WWW [71, 9, 78].
Patterns in weighted graphs.
Informal description.
Edges in a graph often have edge weights. For
instance, the size of packets transferred in a computer network, or length of
phone calls (in seconds) in a phone-call network. These edge weights often
follow patterns, as described in [59] and [5].