Managing and Mining Graph Data part 12 docx
Bạn đang xem bản rút gọn của tài liệu. Xem và tải ngay bản đầy đủ của tài liệu tại đây (1.58 MB, 10 trang )
Graph Mining: Laws and Generators 91
of many real-world graphs. Generalized random graph models extend the basic
random graph model to allow arbitrary degree distributions.
Given a degree distribution, we can randomly assign a degree to each node
of the graph so as to match the given distribution. Edges are formed by ran-
domly linking two nodes till no node has extra degrees left. We describe
two different models below: the PLRG model and the Exponential Cutoffs
model. These differ only in the degree distributions used; the rest of the graph-
generation process remains the same. The graphs thus created can, in gen-
eral, include self-graphs and multigraphs (having multiple edges between two
nodes).
The PLRG model
One of the obvious modifications to the Erd
-
os-R
«
enyi model
is to change the degree distribution from Poisson to power-law. One such
model is the Power-Law Random Graph (PLRG) model of Aiello et al. [3]
(a similar model is the Power Law Out Degree (PLOD) model of Palmer and
Steffan [72]). There are two parameters: 𝛼 and 𝛽. The number of nodes of
degree 𝑘 is given by 𝑒
𝛼
/𝑘
𝛽
.
By construction, the degree distribution is specifically a power law:
𝑝
𝑘
∝ 𝑘
−𝛽
(3.12)
where 𝛽 is the power-law exponent.
The authors show that graphs generated by this model can have several pos-
sible properties, based only on the value of 𝛽. When 𝛽 < 1, the graph is al-
most surely connected. For 1 < 𝛽 < 2, a giant component exists, and smaller
components are of size 𝑂(1). For 2 < 𝛽 < 𝛽
0
sim 3.48, the giant component
exists and the smaller components are of size 𝑂(log 𝑁). At 𝛽 = 𝛽
0
, the
smaller components are of size 𝑂(log 𝑁/ log log 𝑁). For 𝛽 > 𝛽
0
, no giant
component exists. Thus, for the giant component, we have a phase transition
at 𝛽 = 𝛽
0
= 3.48; there is also a change in the size of the smaller components
at 𝛽 = 2.
The Exponential cutoffs model
Another generalized random graph model is
due to Newman et al. [69]. Here, the probability that a node has 𝑘 edges is
given by
𝑝
𝑘
= 𝐶𝑘
−𝛾
𝑒
−𝑘/𝜅
(3.13)
where 𝐶, 𝛾 and 𝜅 are constants.
This model has a power law (the 𝑘
−𝛾
term) augmented by an exponential
cutoff (the 𝑒
−𝑘/𝜅
term). The exponential cutoff, which is believed to be present
in some social and biological networks, reduces the heavy-tail behavior of a
pure power-law degree distribution. The results of this model agree with those
of [3] when 𝜅 → ∞.
92 MANAGING AND MINING GRAPH DATA
Analytic expressions are known for the average path length of this model,
but this typically tends to be somewhat less than that in real-world graphs [7].
Apart from PLRG and the exponential cutoffs model, some other related
models have also been proposed, a notable model generalization being dot-
product models [70]. Another important model is that of Aiello et al. [4], who
assign weights to nodes and then form edges probabilistically based on the
product of the weights of their end-points. The exact mechanics are, however,
close to preferential attachment, and we will discuss later.
Similar models have also been proposed for generating directed and bipartite
random graphs. Recent work has provided analytical results for the sizes of the
strongly connected components and cycles in such graphs [30, 37]. We do not
discuss these any further; the interested reader is referred to [69].
Open questions and discussion. Generalized random graph models retain
the simplicity and ease of analysis of the Erd
-
os-R
«
enyi model, while removing
one of its weaknesses: the unrealistic Poisson degree distribution. However,
most such models only attempt to match the degree distribution of real graphs,
and no other patterns. For example, in most random graph models, the proba-
bility that two neighbors of a node are themselves connected goes as 𝑂(𝑁
−1
).
This is exactly the clustering coefficient of the graph, and goes to zero for
large 𝑁; but for many real-world graphs,
𝐶𝐶
<𝑘>
is independent of 𝑁 (See fig-
ure 9 from [7]). Also, many real world graphs (such as the WWW) exhibit
the existence of communities of nodes, with stronger ties within the commu-
nity than outside; random graphs do not appear to show any such behavior.
Further work is needed to accommodate these patterns into the random graph
generation process.
3.2 Preferential Attachment and Variants
Problem being solved. Generalized random graph models try to model the
power law or other degree distribution of real graphs. However, they do not
make any statement about the processes generating the network. The search for
a mechanism for network generation was a major factor in fueling the growth
of the preferential attachment models, which we discuss below.
Basic Preferential Attachment. In the mid-1950s, Herbert Simon [77]
showed that power law tails arise when “the rich get richer.” Derek Price
applied this idea (which he called cumulative advantage) to the case of net-
works [32], as follows. We grow a network by adding vertices over time. Each
vertex gets a certain out-degree, which may be different for different vertices
but whose mean remains at a constant value 𝑚 over time. Each outgoing edge
from the new vertex connects to an old vertex with a probability proportional
to the in-degree of the old vertex. This, however, leads to a problem since all
Graph Mining: Laws and Generators 93
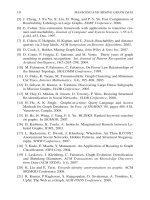
Figure 3.10. The Barab
«
asi-Albert model New nodes are added; each new node prefers to connect
to existing nodes of high degree. The dashed lines show some possible edges for the new node,
with thicker lines implying higher probability.
nodes initially start off with in-degree zero. Price corrected this by adding a
constant to the current in-degree of a node in the probability term, to get
𝑃 (edge to existing vertex 𝑣) =
𝑘(𝑣) + 𝑘
0
∑
𝑖
(𝑘(𝑖) + 𝑘
0
)
where 𝑘(𝑖) represents the current in-degree of an existing node 𝑖, and 𝑘
0
is a
constant.
A similar model was proposed by Barab
«
asi and Albert [13]. It has been a
very influential model, and formed the basis for a large body of further work.
Hence, we will look at the Barab
«
asi-Albert model (henceforth called the BA
model) in detail.
Description of the BA model. The BA model proposes that structure
emerges in network topologies as the result of two processes:
1 Growth: Contrary to several other existing models (such as random
graph models) which keep a fixed number of nodes during the process
of network formation, the BA model starts off with a small set of nodes
and grows the network as nodes and edges are added over time.
2 Preferential Attachment: This is the same as the “rich get richer” idea.
The probability of connecting to a node is proportional to the current
degree of that node.
Using these principles, the BA model generates an undirected network as
follows. The network starts with 𝑚
0
nodes, and grows in stages. In each
stage, one node is added along with 𝑚 edges which link the new node to 𝑚
existing nodes (Figure 3.10). The probability of choosing an existing node as
an endpoint for these edges is given by
𝑃 (edge to existing vertex 𝑣) =
𝑘(𝑣)
∑
𝑖
𝑘(𝑖)
(3.14)
94 MANAGING AND MINING GRAPH DATA
where 𝑘(𝑖) is the degree of node 𝑖. Note that since the generated network is
undirected, we do not need to distinguish between out-degrees and in-degrees.
The effect of this equation is that nodes which already have more edges con-
necting to them, get even more edges. This represents the “rich get richer”
scenario.
There are a few differences from Price’s model. One is that the number of
edges per new node is fixed at 𝑚 (a positive integer); in Price’s model only
the mean number of added edges needed to be 𝑚. However, the major differ-
ence is that while Price’s model generates a directed network, the BA model
is undirected. This avoids the problem of the initial in-degree of nodes being
zero; however, many real graphs are directed, and the BA model fails to model
this important feature.
Properties of the BA model. We will now discuss some of the known
properties of the BA model. These include the degree distribution, diameter,
and correlations hidden in the model.
Degree distribution
The degree distribution of the BA model [36] is given by:
𝑝
𝑘
≈ 𝑘
−3
for large 𝑘. In other words, the degree distribution has a power law “tail” with
exponent 3, independent of the value of 𝑚.
Diameter
Bollob
«
as and Riordan [22] show that for large 𝑁 , the diameter grows
as 𝑂(log 𝑁) for 𝑚 = 1, and as 𝑂(log 𝑁/ log log 𝑁) for 𝑚 ≥ 2. Thus, this
model displays the small-world effect: the distance between two nodes is, on
average, far less than the total number of nodes in the graph.
Correlations between variables
Krapivsky and Redner [52] find two corre-
lations in the BA model. First, they find that degree and age are positively
correlated: older nodes have higher mean degree. The second correlation is in
the degrees of neighboring nodes, so that nodes with similar degree are more
likely to be connected. However, this asymptotically goes to 0 as 𝑁 → ∞.
Open questions and discussion. The twin ideas of growth and preferential
attachment are definitely an immense contribution to the understanding of net-
work generation processes. However, the BA model attempts to explain graph
structure using only these two factors; most real-world graphs are probably
generated by a slew of different factors. The price for this is some inflexibility
in graph properties of the BA model.
The power-law exponent of the degree distribution is fixed at 𝛾 = 3, and
many real-world graphs deviate from this value.
Graph Mining: Laws and Generators 95
The BA model generates undirected graphs only; this prevents the model
from being used for the many naturally occurring directed graphs.
While Krapivsky and Redner show that the BA model should have cor-
relations between node degree and node age (discussed above), Adamic
and Huberman [1] apparently find no such correlations in the WWW.
The generated graphs have exactly one connected component. How-
ever, many real graphs have several isolated components. For example,
websites for companies often have private set of webpages for employ-
ees/projects only. These are a part of the WWW, but there are no paths
to those webpages from outside the set. Military routers in the Internet
router topology are another example.
The BA model has a constant average degree of 𝑚; however, the average
degree of some graphs (such as citation networks) actually increases over
time according to a Densification Power Law [14, 58, 37]
The diameter of the BA model increases as 𝑁 increases; however, many
graphs exhibit shrinking diameters.
Also, further work is needed to confirm the existence or absence of a commu-
nity structure in the generated graphs.
While the basic BA model does have these limitations, its simplicity and
power make it an excellent base on which to build extended models. In fact,
the bulk of graph generators in use today can probably trace their lineage back
to this model. In the next few sections, we will look at some of these extensions
and variations; as we will see, most of these are aimed at removing one or the
other of the aforementioned limitations.
Variants on Preferential Attachment.
Initial attractiveness.
While the BA model generates graphs with a power
law degree distribution, the power law exponent is stuck at 𝛾 = 3. Dorogovt-
sev et al. [36, 35] propose a simple one-parameter extension of the basic model
which allows 𝛾 ∈ [2, ∞). Other methods, such as the AB model described
later, also do this, but they require more parameters. In initial attractiveness,
an extra “initial attractiveness” parameter is added which governs the proba-
bility of “young” sites gaining new edges. Adjusting this parameter will vary
the degree distribution, adding significant flexibility to the BA model.
Internal edges and Rewiring. Albert and Barab
«
asi [6] proposed another
method to add flexibility in the power law exponent. In the original BA model,
one node and 𝑚 edges are added to the graph every iteration. Albert and
96 MANAGING AND MINING GRAPH DATA
Figure 3.11. The edge copying model New nodes can choose to copy the edges of an existing
node. This models the copying of links from other peoples’ websites to create a new website.
Barab
«
asi decouple this addition of nodes and edges, and also extend the model
by introducing the concept of edge rewiring. Starting with a small set of 𝑚
0
nodes, the resulting model (henceforth called the AB model) combines 3 pro-
cesses: adding internal edges, removing/reconnecting (“rewiring”) edges, and
adding new nodes with some edges. This model exhibits either a power-law or
exponential degree distribution, depending on the parameters used.
Edge Copying Models. Several graphs show community behavior, such as
topic-based communities of websites on the WWW. Kleinberg et al. [51] and
Kumar et al. [54] try to model this by using the intuition that most webpage
creators will be familiar with webpages on topics of interest to them, and so
when they create new webpages, they will link to some of these existing topical
webpages. Thus, most new webpages will enhance the “topical community”
effect of the WWW.
The Kleinberg [51] generator creates a directed graph. In this generator,
nodes are independently created and deleted in each distribution, and edges
incident on deleted nodes are also removed. Also, edges may be added to or
deleted from existing nodes. Then, there is the key edge copying mechanism,
where a node may copy edges from another node. An illustration is shown
in Figure 3.11. This is similar to preferential attachment because the pages
with high-degree will be linked to by many other pages, and so have a greater
chance of getting copied.
Kumar et al. [54] propose a very similar model. However, there are some
important differences. Whenever a new node is added, only one new edge is
added. The copying process takes place when head or tail of some existing
edge gets chosen as the endpoint of the new edge. This model may serve to
create “communities” as there may be important nodes on each “topic”.
This and similar models by analyzed by Kumar et al. [53]. In-degree distri-
bution of Kleinberg’s model follows a power law, and both in-and out-degree
of Kumar et al.’s model follow power laws.
The Kleinberg model [51] generates a tree; no “back-edges” are formed
from the old nodes to the new nodes. Also, in the model of Kumar et al. [54],
Graph Mining: Laws and Generators 97
a fixed fraction of the nodes have zero in-degree or zero out-degree; this might
not be the case for all real-world graphs (see Aiello et al. [4] for related issues).
However, the simple idea of copying edges can clearly lead to both power
laws as well as community effects. “Edge copying” models are, thus, a very
promising direction for future research.
Modifying the preferential attachment equation. Chen et al. [29] had
found the AB model somewhat lacking in modeling the Web. Specifically, they
found that the preference for connecting to high-degree nodes is stronger than
that predicted by linear preferential attachment. Bu and Towsley [25] attempt
to address this issue.
The AB model [6] is changed by removing the edge rewiring process, and
modifying the linear preferential attachment equation of the AB model to show
higher preference for nodes with high degrees (as in [29]). This is called the
GLP (Generalized Linear Preference) model. The degree distribution follows
a power law. Also, they also find empirically that the clustering coefficient
for a GLP graph is much closer to that of the Internet than the BA, AB and
Power-Law Random Graph (PLRG [3]) models.
Others such as Krapivsky and Redner [52] have studied non-linear prefer-
ential attachment, finding this tended to produce degree decay faster than a
power law.
Modeling increasing average degree. The average degree of several real-
world graphs (such as citation graphs) increases over time [37, 14, 58], accord-
ing to a Densification Power Law. Barab
«
asi et al. [14] attempt to modify the
basic BA model to accommodate this effect. In the model, a new edge chooses
both its endpoints by preferential attachment. The number of internal nodes
added per iteration is proportional to the the current number of nodes in the
graph. Thus, it leads to the phenomenon of accelerated growth: the average
degree of the graph increases linearly over time.
However, the analysis of this model shows that it has two power-law
regimes. The power law exponent is 𝛾 = 2 for low degrees, and 𝛾 = 3 for
high degrees. In fact, over a long period of time, the exponent converges to
𝛾 = 2.
Node fitness measures. The preferential attachment models noted above
tend to have a correlation between the age of a node and its degree: higher
the age, more the degree [52]. However, Adamic and Huberman find that this
does not hold for the WWW [1]. There are websites which were created late
but still have far higher in-degree than many older websites. Bianconi and
Barab
«
asi [18] try to model this. Their model attaches a fitness parameter to
each node, which does not change over time. The idea is that even a node
98 MANAGING AND MINING GRAPH DATA
which is added late could overtake older nodes in terms of degree, if the newer
node has a much higher fitness value.
The authors analyze the case when the fitness parameters are drawn ran-
domly from a uniform [0, 1] distribution. The resulting degree distribution is
a power law with an extra inverse logarithmic factor. For the case where all
fitness values are the same, this model becomes the simple BA model.
Having a node’s popularity depend on its “fitness” intuitively makes a lot of
sense. Further research is needed to determine the distribution of node fitness
values in real-world graphs.
Generalizing preferential attachment. The BA model is undirected. A
simple adaptation to the directed case is: new edges are created to point from
the new nodes to existing nodes chosen preferentially according to their in-
degree. However, the out-degree distribution of this model would not be a
power law. Aiello et al. [4] propose a very general model for generating di-
rected graphs which give power laws for both in-degree and out-degree distri-
butions. A similar model was also proposed by Bollob
«
as et al. [21]. The work
shows that even a very general version of preferential attachment can lead to
power law degree distributions. Further research is needed to test for all the
other graph patterns, such as diameter, community effects and so on.
PageRank-based preferential attachment. Pandurangan et al. [73] found
that the PageRank [23] values for a snapshot of the Web graph follow a power
law. They propose a model that tries to match this PageRank distribution of
real-world graphs, in addition to the degree distributions. They modify the
basic preferential attachment mechanism by adding a PageRank-based pref-
erential attachment component– not only do edges preferentially connect to
high degree nodes, but also high PageRank nodes. They empirically show that
this model can match both the degree distributions as well as the PageRank
distribution of the Web graph. However, closed-form formulas for the degree
distributions are not provided for this model. The authors also found that the
plain edge-copying model of Kumar et al. [54] could also match the PageR-
ank distribution (in addition to the degree distributions) without specifically
attempting to do so. Thus, this work might be taken to be another alternative
model of the Web.
The Forest Fire model. Leskovec et al. [58] develop a preferential-
attachment based model which matches the Densification Power Law and the
shrinking diameter patterns of graph evolution, in addition to the power law de-
gree distribution. A node chooses an ambassador node uniformly at random,
and then links recursively to the ambassador node’s neighbors.
Graph Mining: Laws and Generators 99
This creates preferential linking without explicitly assigning such probabil-
ity. This method is similar to the edge copying model discussed earlier because
existing links are “copied” to the new node 𝑣 as the fire spreads. This leads to
a community of nodes, which share similar edges.
The Butterfly model. Most preferential-attachment based models will
form a single connected component, when, in real graphs, there are many
smaller components that evolve and occasionally join with each other. Mc-
Glohon et al. [59] develop a model that addresses this. Like in the Forest Fire
model, there is an ambassador mechanism. However, there is no guarantee of
linkage, so a node may become isolated and form its own new component for
other nodes to join to. Additionally, instead of a single ambassador, a node may
choose multiple ambassadors. This will allow components to join together.
The Butterfly model empirically produces power laws for both in- and out-
degree, as well as reproducing the Densification Power Law and shrinking
diameter. Furthermore, it reproduces oscillating patterns of the next-largest
connected components mentioned earlier.
Deviations from power laws.
Problem being solved.
Pennock et al. [75] find that while the WWW
as a whole might exhibit power-law degree distributions, subgraphs of web-
pages belonging to specific categories or topics often show significant devia-
tions from a power law. They attempt to model this deviation from power-law
behavior.
Description and properties. Their model is similar to the BA model,
except for two differences:
Internal edges The 𝑚 new edges added in each iteration need not be
incident on the new node being added that iteration. Thus, the new edges
could be internal edges.
Combining random and preferential attachment Instead of pure prefer-
ential attachment, the endpoints of new edges are chosen according to
a linear combination of preferential attachment and uniform random at-
tachment. The probability of a node 𝑣 being chosen as one endpoint of
an edge is given by:
𝑝(𝑣) = 𝛼
𝑘(𝑣)
2𝑚𝑡
+ (1 − 𝛼)
1
𝑚
0
+ 𝑡
(3.15)
Here, 𝑘(𝑣) represents the current degree of node 𝑣, 2𝑚𝑡 is the total num-
ber of edges at time 𝑡, (𝑚
0
+ 𝑡) is the current number of nodes at time
100 MANAGING AND MINING GRAPH DATA
𝑡, and 𝛼 ∈ [0, 1] is a free parameter. To rephrase the equation, in order
to choose a node as an endpoint for a new edge, we either do prefer-
ential attachment with probability 𝛼, or we pick a node at random with
probability (1 −𝛼).
One point of interest is that even if a node is added with degree 0, there is
always a chance for it to gain new edges via the uniform random attachment
process. The preferential attachment and uniform attachment parts of Equa-
tion 3.15 represent two different behaviors of webpage creators (according to
the authors):
The preferential attachment term represents adding links which the cre-
ator became aware of because they were popular.
The uniform attachment term represents the case when the author adds a
link because it is relevant to him, and this is irrespective of the popularity
of the linked page. This allows even the poorer sites to gain some edges.
Degree distribution
The authors derive a degree distribution function for this
model:
𝑃 (𝑘) ∝ (𝑘 + 𝑐)
−1−
1
𝛼
(3.16)
where 𝑐 is a function of 𝑚 and 𝛼. This gives a power-law of exponent (1+1/𝛼)
in the tail. However, for low degrees, it deviates from the power-law, as the
authors wanted.
Power-law degree distributions have shown up in many real-world graphs.
However, it is clear that deviations in this do show up in practice. This is
one of the few models we are aware of that specifically attempt to model such
deviations, and as such, is a step in the right direction.
Open questions and discussion. This model can match deviations from
power laws in degree distributions. However, further work is needed to test for
other graph patterns, like diameter, community structure and such.
Implementation issues. Here, we will briefly discuss certain implementa-
tion aspects. Consider the BA model. In each iteration, we must choose edge
endpoints according to the linear preferential attachment equation. Naively,
each time we need to add a new edge, we could go over all the existing nodes
and find the probability of choosing each node as an endpoint, based on its cur-
rent degree. However, this would take 𝑂(𝑁) time each iteration, and 𝑂(𝑁
2
)
time to generate the entire graph. A better approach [65] is to keep an array:
whenever a new edge is added, its endpoints are appended to the array. Thus,
each node appears in the array as many times as its degree. Whenever we must
choose a node according to preferential attachment, we can choose any cell of