Managing and Mining Graph Data part 25 potx
Bạn đang xem bản rút gọn của tài liệu. Xem và tải ngay bản đầy đủ của tài liệu tại đây (1.56 MB, 10 trang )
Exact and Inexact Graph Matching: Methodology and Applications 223
basic tree search algorithm is endowed with an efficiently computable heuris-
tic which substantially reduces the search time. In [43] the tree search method
for isomorphism is sped up by means of another heuristic derived from Con-
straint Satisfaction. Other algorithms for exact graph matching, which are not
based on tree search techniques, are Nauty [50], and decision tree based tech-
niques [51], to name just two examples. The reader is referred to [15] for an
exhaustive list of exact graph matching algorithms developed since 1973.
Closely related to graph isomorphism is subgraph isomorphism, which can
be seen as a concept describing subgraph equality. A subgraph isomorphism
is a weaker form of matching in terms of requiring only that an isomorphism
holds between a graph 𝑔
1
and a subgraph of 𝑔
2
. Intuitively, subgraph isomor-
phism is the problem to detect if a smaller graph is identically present in a
larger graph. In Fig. 7.3 (a) and (c), an example of subgraph isomorphism is
given.
Definition 7.4 (Subgraph Isomorphism). Let 𝑔
1
= (𝑉
1
, 𝐸
1
, 𝜇
1
, 𝜈
1
) and
𝑔
2
= (𝑉
2
, 𝐸
2
, 𝜇
2
, 𝜈
2
) be graphs. An injective function 𝑓 : 𝑉
1
→ 𝑉
2
from
𝑔
1
to 𝑔
2
is a subgraph isomorphism if there exists a subgraph 𝑔 ⊆ 𝑔
2
such that
𝑓 is a graph isomorphism between 𝑔
1
and 𝑔.
The tree search based algorithms for graph isomorphism [17, 43, 89], as well
as the decision tree based techniques [51], can also be applied to the subgraph
isomorphism problem. In contrast with the problem of graph isomorphism,
subgraph isomorphism is known to be NP-complete [25]. As a matter of fact,
subgraph isomorphism is a harder problem than graph isomorphism as one has
not only to check whether a permutation of 𝑔
1
is identical to 𝑔
2
, but we have to
decide whether 𝑔
1
is isomorphic to any of the subgraphs of 𝑔
2
with equal size
as 𝑔
1
.
The process of graph matching primarily aims at identifying corresponding
substructures in the two graphs under consideration. Through the graph match-
ing procedure an associated similarity or dissimilarity score can be easily in-
ferred. In view of this, graph isomorphism as well as subgraph isomorphism
provide us with a basic similarity measure, which is 1 (maximum similarity)
for (sub)graph isomorphic, and 0 (minimum similarity) for non-isomorphic
graphs. Hence, two graphs must be completely identical, or the smaller graph
must be identically contained in the other graph, to be deemed similar. Con-
sequently, the applicability of this graph similarity measure is rather limited.
Consider a case where most, but not all, nodes and edges in two graphs are
identical. The rigid concept of (sub)graph isomorphism fails in such a situa-
tion in the sense of considering the two graphs to be totally dissimilar. Due to
this observation, the formal concept of the largest common part of two graphs
is established.
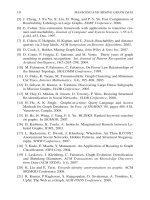
224 MANAGING AND MINING GRAPH DATA
(a) (b) (c)
Figure 7.4. Graph (c) is a maximum common subgraph of graph (a) and (b).
Definition 7.5 (Maximum common subgraph). Let 𝑔
1
= (𝑉
1
, 𝐸
1
, 𝜇
1
, 𝜈
1
)
and 𝑔
2
= (𝑉
2
, 𝐸
2
, 𝜇
2
, 𝜈
2
) be graphs. A common subgraph of 𝑔
1
and 𝑔
2
,
𝑐𝑠(𝑔
1
, 𝑔
2
), is a graph 𝑔 = (𝑉, 𝐸, 𝜇, 𝜈) such that there exist subgraph isomor-
phisms from 𝑔 to 𝑔
1
and from 𝑔 to 𝑔
2
. We call 𝑔 a maximum common subgraph
of 𝑔
1
and 𝑔
2
, 𝑚𝑐𝑠(𝑔
1
, 𝑔
2
), if there exists no other common subgraph of 𝑔
1
and
𝑔
2
that has more nodes than 𝑔.
A maximum common subgraph of two graphs represents the maximal part
of both graphs that is identical in terms of structure and labels. In Fig. 7.4(c)
the maximum common subgraph is shown for the two graphs in Fig. 7.4(a)
and (b). Note that, in general, the maximum common subgraph is not uniquely
defined, that is, there may be more than one common subgraph with a maxi-
mal number of nodes. A standard approach to computing maximum common
subgraphs is based on solving the maximum clique problem in an association
graph [44, 49]. The association graph of two graphs represents the whole set
of possible node-to-node mappings that preserve the edge structure and labels
of both graphs. Finding a maximum clique in the association graph, that is, a
fully connected maximal subgraph, is equivalent to finding a maximum com-
mon subgraph. In [10] the reader can find an experimental comparison of algo-
rithms for maximum common subgraph computation on randomly connected
graphs.
Graph dissimilarity measures can be derived from the maximum common
subgraph of two graphs. Intuitively speaking, the larger a maximum common
subgraph of two graphs is, the more similar are the two graphs. For instance,
in [12] such a distance measure is introduced, defined by
𝑑
MCS
(𝑔
1
, 𝑔
2
) = 1 −
∣mcs(g
1
, g
2
)∣
max{∣𝑔
1
∣, ∣𝑔
2
∣}
(7.1)
Note that, whereas the maximum common subgraph of two graphs is not
uniquely defined, the 𝑑
MCS
distance is. If two graphs are isomorphic, their
𝑑
MCS
distance is 0; on the other hand, if two graphs have no part in common,
their 𝑑
MCS
distance is 1. It has been shown that 𝑑
MCS
is a metric and produces
a value in [0, 1].
A second distance measure which has been proposed in [94], based on the
idea of graph union, is
Exact and Inexact Graph Matching: Methodology and Applications 225
(a) (b) (c)
Figure 7.5. Graph (a) is a minimum common supergraph of graph (b) and (c).
𝑑
WGU
(𝑔
1
, 𝑔
2
) = 1 −
∣mcs(g
1
, g
2
)∣
∣𝑔
1
∣ + ∣𝑔
2
∣ − ∣𝑚𝑐𝑠(𝑔
1
, 𝑔
2
)∣
By “graph union” it is meant that the denominator represents the size of
the union of the two graphs in the set-theoretic sense. This distance measure
behaves similarly to 𝑑
MCS
. The motivation of using graph union in the denom-
inator is to allow for changes in the smaller graph to exert some influence on
the distance measure, which does not happen with 𝑑
MCS
. This measure was
also demonstrated to be a metric and creates distance values in [0, 1].
A similar distance measure [7] which is not normalized to the interval [0, 1]
is:
𝑑
UGU
(𝑔
1
, 𝑔
2
) = ∣𝑔
1
∣ + ∣𝑔
2
∣ − 2 ⋅ ∣𝑚𝑐𝑠(𝑔
1
, 𝑔
2
)∣
Fernandez and Valiente [21] have proposed a distance measure based on
both the maximum common subgraph and the minimum common supergraph
𝑑
MMCS
(𝑔
1
, 𝑔
2
) = ∣𝑀 𝐶𝑆(𝑔
1
, 𝑔
2
)∣ − ∣𝑚𝑐𝑠(𝑔
1
, 𝑔
2
)∣
where 𝑀𝐶𝑆(𝑔
1
, 𝑔
2
) is the minimum common supergraph of graphs 𝑔
1
and 𝑔
2
,
which is the complimentary concept of minimum common subgraph.
Definition 7.6 (Minimum common supergraph). Let 𝑔
1
= (𝑉
1
, 𝐸
1
, 𝜇
1
, 𝜈
1
)
and 𝑔
2
= (𝑉
2
, 𝐸
2
, 𝜇
2
, 𝜈
2
) be graphs. A common supergraph of 𝑔
1
and 𝑔
2
,
𝐶𝑆(𝑔
1
, 𝑔
2
), is a graph 𝑔 = (𝑉, 𝐸, 𝜇, 𝜈) such that there exist subgraph isomor-
phisms from 𝑔
1
to 𝑔 and from 𝑔
2
to 𝑔. We call 𝑔 a minimum common supergraph
of 𝑔
1
and 𝑔
2
, 𝑀𝐶𝑆(𝑔
1
, 𝑔
2
), if there exists no other common supergraph of 𝑔
1
and 𝑔
2
that has less nodes than 𝑔.
In Fig. 7.5(a) the minimum common supergraph of the graphs in Fig. 7.5(b)
and (c) is given. The computation of the minimum common supergraph can be
reduced to the problem of computing a maximum common subgraph [11].
The concept that drives the distance measure above is that the maximum
common subgraph provides a “lower bound” on the similarity of two graphs,
while the minimum supergraph is an “upper bound”. If two graphs are identi-
cal, then both their maximum common subgraph and minimum common super-
graph are the same as the original graphs and ∣𝑔
1
∣ = ∣𝑔
2
∣ = ∣𝑀𝐶𝑆(𝑔
1
, 𝑔
2
)∣ =
∣𝑚𝑐𝑠(𝑔
1
, 𝑔
2
)∣, which leads to 𝑑
MMCS
(𝑔
1
, 𝑔
2
) = 0. As the graphs become
226 MANAGING AND MINING GRAPH DATA
more dissimilar, the size of the maximum common subgraph decreases, while
the size of the minimum supergraph increases. This in turn leads to increasing
values of 𝑑
MMCS
(𝑔
1
, 𝑔
2
). For two graphs with an empty maximum common
subgraph, the distance will become ∣𝑀𝐶𝑆(𝑔
1
, 𝑔
2
)∣ = ∣𝑔
1
∣+ ∣𝑔
2
∣. The distance
𝑑
MMCS
(𝑔
1
, 𝑔
2
) has also been shown to be a metric, but it does not produce val-
ues normalized to the interval [0, 1], unlike 𝑑
MCS
or 𝑑
WGU
. We can also create
a version of this distance measure which is normalized to [0, 1] as follows:
𝑑
MMCSN
(𝑔
1
, 𝑔
2
) = 1 −
∣𝑚𝑐𝑠(𝑔
1
, 𝑔
2
)∣
∣𝑀𝐶𝑆(𝑔
1
, 𝑔
2
)∣
Note that, because of ∣𝑀𝐶𝑆(𝑔
1
, 𝑔
2
)∣ = ∣𝑔
1
∣ + ∣𝑔
2
∣ − ∣𝑚𝑐𝑠(𝑔
1
, 𝑔
2
)∣, 𝑑
UGU
and 𝑑
MMCS
are identical. The same is true for 𝑑
WGU
and 𝑑
MMCSN
.
The main advantage of exact graph matching methods is their stringent def-
inition and solid mathematical foundation. This advantage may turn into a dis-
advantage, however, because in exact graph matching for finding two graphs
𝑔
1
and 𝑔
2
to be similar, it is required that a significant part of the topology
together with the corresponding node and edge labels in 𝑔
1
and 𝑔
2
have to be
identical. In fact, this constraint is too rigid in some applications. For this rea-
son, a large number of error-tolerant, or inexact, graph matching methods have
been proposed, dealing with a more general graph matching problem than the
one of (sub)graph isomorphism.
4. Inexact Graph Matching
Due to the intrinsic variability of the patterns under consideration and the
noise resulting from the graph extraction process, it cannot be expected that
two graphs representing the same class of objects are completely, or at least to
a large part, identical in their structure. Moreover, if the node or edge label al-
phabet 𝐿 is used to describe non-discrete properties of the underlying patterns,
e.g. 𝐿 ⊆ ℝ
𝑛
, it is most probable that the actual graphs differ somewhat from
their ideal model. Obviously, such noise crucially hampers the applicability
of exact graph matching techniques, and consequently exact graph matching is
rarely used in real-world applications.
In order to overcome this drawback, it is advisable to endow the graph
matching framework with a certain tolerance to errors. That is, the match-
ing process must be able to accommodate the differences of the graphs by
relaxing –to some extent– the underlying constraints. In the first part of this
section the concept of graph edit distance is introduced to exemplarily illus-
trate the paradigm of inexact graph matching. In the second part, several other
approaches to inexact graph matching are briefly discussed.
Exact and Inexact Graph Matching: Methodology and Applications 227
g
1
g
2
Figure 7.6. A possible edit path between graph 𝑔
1
and graph 𝑔
2
(node labels are represented by
different shades of gray).
4.1 Graph Edit Distance
Graph edit distance [8, 71] offers an intuitive way to integrate error-
tolerance into the graph matching process and is applicable to virtually all types
of graphs. Originally, edit distance has been developed for string matching [93]
and a considerable amount of variants and extensions to the edit distance have
been proposed for strings and graphs. The key idea is to model structural vari-
ation by edit operations reflecting modifications in structure and labeling. A
standard set of edit operations is given by insertions, deletions, and substitu-
tions of both nodes and edges. Note that other edit operations, such as merging
and splitting of nodes [2], can be useful in certain applications. Given two
graphs, the source graph 𝑔
1
and the target graph 𝑔
2
, the idea of graph edit dis-
tance is to delete some nodes and edges from 𝑔
1
, relabel (substitute) some of
the remaining nodes and edges, and insert some nodes and edges in 𝑔
2
, such
that 𝑔
1
is finally transformed into 𝑔
2
. A sequence of edit operations 𝑒
1
, . . . , 𝑒
𝑘
that transform 𝑔
1
into 𝑔
2
is called an edit path between 𝑔
1
and 𝑔
2
. In Fig. 7.6
an example of an edit path between two graphs 𝑔
1
and 𝑔
2
is given. This edit
path consists of three edge deletions, one node deletion, one node insertion,
two edge insertions, and two node substitutions.
Let Υ(𝑔
1
, 𝑔
2
) denote the set of all possible edit paths between two graphs
𝑔
1
and 𝑔
2
. Clearly, every edit path between two graphs 𝑔
1
and 𝑔
2
is a model
describing the correspondences found between the graphs’ substructures. That
is, the nodes of 𝑔
1
are either deleted or uniquely substituted with a node in 𝑔
2
,
and analogously, the nodes in 𝑔
2
are either inserted or matched with a unique
node in 𝑔
1
. The same applies for the edges. In [58] the idea of fuzzy edit paths
was reported where both nodes and edges can be simultaneously mapped to
several nodes and edges. The optimal fuzzy edit path is then determined by
means of quadratic programming.
To find the most suitable edit path out of Υ(𝑔
1
, 𝑔
2
), one introduces a cost
for each edit operation, measuring the strength of the corresponding operation.
The idea of such a cost is to define whether or not an edit operation represents
a strong modification of the graph. Clearly, between two similar graphs, there
should exist an inexpensive edit path, representing low cost operations, while
for dissimilar graphs an edit path with high costs is needed. Consequently, the
edit distance of two graphs is defined by the minimum cost edit path between
two graphs.
228 MANAGING AND MINING GRAPH DATA
Definition 7.7 (Graph Edit Distance). Let 𝑔
1
= (𝑉
1
, 𝐸
1
, 𝜇
1
, 𝜈
1
) be the
source and 𝑔
2
= (𝑉
2
, 𝐸
2
, 𝜇
2
, 𝜈
2
) the target graph. The graph edit distance
between 𝑔
1
and 𝑔
2
is defined by
𝑑(𝑔
1
, 𝑔
2
) = min
(𝑒
1
, ,𝑒
𝑘
)∈Υ(𝑔
1
,𝑔
2
)
𝑘
∑
𝑖=1
𝑐(𝑒
𝑖
),
where Υ(𝑔
1
, 𝑔
2
) denotes the set of edit paths transforming 𝑔
1
into 𝑔
2
, and 𝑐
denotes the cost function measuring the strength 𝑐(𝑒) of edit operation 𝑒.
The definition of adequate and application-specific cost functions is a key
task in edit distance based graph matching. Prior knowledge of the graphs’ la-
bels is often inevitable for graph edit distance to be a suitable proximity mea-
sure. This fact is often considered as one of the major drawbacks of graph
edit distance. Yet, contrariwise, the possibility to parametrize graph edit dis-
tance by means of the cost function crucially amounts for the versatility of this
dissimilarity model. That is, by means of graph edit distance it is possible to
integrate domain specific knowledge about object similarity, if available, when
defining the costs of the elementary edit operations. Furthermore, if in a partic-
ular case prior knowledge about the labels and their meaning is not available,
automatic procedures for learning the edit costs from a set of sample graphs
are available as well [55, 56].
The overall aim of the cost function is to favor weak distortions over strong
modifications of the graph. Hence, the cost is defined with respect to the un-
derlying node or edge labels, i.e. the cost 𝑐(𝑒) is a function depending on the
edit operation 𝑒. Typically, for numerical node and edge labels the Euclidean
distance can be used to model the cost of a particular substitution operation on
the graphs. For deletions and insertions of both nodes and edges, often a con-
stant cost 𝜏
𝑛𝑜𝑑𝑒
/𝜏
𝑒𝑑𝑔𝑒
is assigned. We refer to this cost function as Euclidean
Cost Function.
The Euclidean cost function defines substitution costs proportional to the
Euclidean distance of two respective labels. The basic intuition behind this
approach is that the further away two labels are, the stronger is the distortion
associated with the corresponding substitution. Note that any node substitution
having a higher cost than 2 ⋅𝜏
𝑛𝑜𝑑𝑒
will be replaced by a composition of a dele-
tion and an insertion of the involved nodes (the same accounts for the edges).
This behavior reflects the basic intuition that substitutions should be favored
over deletions and insertions to a certain degree.
Optimal algorithms for computing the edit distance of graphs 𝑔
1
and 𝑔
2
are
typically based on combinatorial search procedures that explore the space of
all possible mappings of the nodes and edges of 𝑔
1
to the nodes and edges
of 𝑔
2
[8]. A major drawback of those procedures is their computational com-
plexity, which is exponential in the number of nodes of the involved graphs.
Exact and Inexact Graph Matching: Methodology and Applications 229
Consequently, the application of optimal algorithms for edit distance compu-
tations is limited to graphs of rather small size in practice.
To render graph edit distance computation less computationally demanding,
a number of suboptimal methods have been proposed. In some approaches, the
basic idea is to perform a local search to solve the graph matching problem, that
is, to optimize local criteria instead of global, or optimal ones [57, 80]. In [40],
a linear programming method for computing the edit distance of graphs with
unlabeled edges is proposed. The method can be used to derive lower and
upper edit distance bounds in polynomial time. Two fast but suboptimal al-
gorithms for graph edit distance computation are proposed in [59]. The au-
thors propose simple variants of a standard edit distance algorithm that make
the computation substantially faster. In [20] another suboptimal method has
been proposed. The basic idea is to decompose graphs into sets of subgraphs.
These subgraphs consist of a node and its adjacent nodes and edges. The graph
matching problem is then reduced to the problem of finding a match between
the sets of subgraphs. In [67] a method somewhat similar to the method de-
scribed in [20] is proposed. However, while the optimal correspondence be-
tween local substructures is found by dynamic programming in [20], a bipartite
matching procedure [53] is employed in [67].
4.2 Other Inexact Graph Matching Techniques
Several other important classes of error-tolerant graph matching algorithms
have been proposed. Among others, algorithms based on Artificial Neural
Networks, Relaxation Labeling, Spectral Decompositions, and Graph Kernels
have been reported.
Artificial Neural Networks. One class of error-tolerant graph matching
methods employs artificial neural networks. In two seminal papers [24, 81] it
is shown that neural networks can be used to classify directed acyclic graphs.
The algorithms are based on an energy minimization framework, and use some
kind of Hopfield network [84]. Hopfield networks consist of a set of neurons
connected by synapses such that, upon activation of the network, the neuron
output is fed back into the network. By means of an iterative learning pro-
cedure the given energy criterion is minimized. Similar to the approach of
relaxation labeling (see below), compatibility coefficients are used to evaluate
whether two nodes or edges constitute a successful match.
In [83] the optimization procedure is stabilized by means of a Potts MFT
network. In [85] a self-organizing Hopfield network is introduced that learns
most of the network parameters and eliminates the need for specifying them a
priori. In [52, 72] the graph neural network is crucially extended such that also
undirected and acyclic graphs can be processed. The general idea is to repre-
sent the nodes of a graph in an encoding network. In this encoding network
230 MANAGING AND MINING GRAPH DATA
local transition functions and local output functions are employed, expressing
the dependency of a node on its neighborhood and describing how the output
is produced, respectively. As both functions are implemented by feedforward
neural networks, the encoding network can be interpreted as a recurrent neural
network.
Further examples of graph matching based on artificial neural networks can
be found in [37, 73, 101]
Relaxation Labeling. Another class of error-tolerant graph matching
methods employs relaxation labeling techniques. The basic idea of this partic-
ular approach is to formulate the graph matching problem as a labeling prob-
lem. Each node of one graph is to be assigned to one label out of a discrete
set of possible labels, specifying a matching node of the other graph. Dur-
ing the matching process, Gaussian probability distributions are used to model
compatibility coefficients measuring how suitable each candidate label is. The
initial labeling, which is based on the node attributes, node connectivity, and
other information available, is then refined in an iterative procedure until a suf-
ficiently accurate labeling, i.e. a matching of two graphs, is found. Based on
the pioneering work presented in [22], the idea of relaxation labeling has been
refined in several contributions. In [30, 41] the probabilistic framework for
relaxation labeling is endowed with a theoretical foundation. The main draw-
back of the initial formulation of this technique, viz. the fact that node and
edge labels are used only in the initialization of the matching process, is over-
come in [14]. A significant extension of the framework is introduced in [97]
where a Bayesian consistency measure is adapted to derive a graph distance.
In [35] this method is further improved by taking also edge labels into account
in the evaluation of the consistency measure. The concept of Bayesian graph
edit distance, which in fact builds up on the idea of probabilistic relaxation, is
presented in [54]. The concept has also been successfully applied to special
kinds of graphs, such as trees [87].
Spectral Methods. Spectral methods build a further class of graph match-
ing procedures [13, 47, 70, 78, 90, 98]. The general idea of this approach is
based on the following observation. The eigenvalues and the eigenvectors of
the adjacency or Laplacian matrix of a graph are invariant with respect to node
permutation. Hence, if two graphs are isomorphic, their structural matrices
will have the same eigendecomposition. The converse, i.e. deducing from the
equality of eigendecompositions to graph isomorphism, is not true in general.
However, by representing the underlying graphs by means of the eigendecom-
position of their structural matrix, the matching process of the graphs can be
conducted on some features derived from their eigendecomposition. The main
problem of spectral methods is that they are rather sensitive towards structural
Exact and Inexact Graph Matching: Methodology and Applications 231
errors, such as missing or spurious nodes. Moreover, most of these methods
are purely structural, in the sense that they are only applicable to unlabeled
graphs, or they allow only severely constrained label alphabets.
Graph Kernel. Kernel methods were originally developed for vectorial
representations, but the kernel framework can be extended to graphs in a very
natural way. A number of graph kernels have been designed for graph match-
ing [26, 57]. A seminal contribution is the work on convolution kernels, which
provides a general framework for dealing with complex objects that consist
of simpler parts [32, 95]. Convolution kernels infer the similarity of complex
objects from the similarity of their parts.
A second class of graph kernels is based on the analysis of random walks in
graphs. These kernels measure the similarity of two graphs by the number of
random walks in both graphs that have all or some labels in common [5, 27].
In [27] an important result is reported. It is shown that the number of matching
walks in two graphs can be computed by means of the product graph of two
graphs, without the need to explicitly enumerate the walks. In order to han-
dle continuous labels the random walk kernel has been extended in [5]. This
extension allows one to also take non-identically labeled walks into account.
A third class of graph kernels is given by diffusion kernels. The kernels of
this class are defined with respect to a base similarity measure which is used to
construct a valid kernel matrix [42, 79, 92]. This base similarity measure only
needs to satisfy the condition of symmetry and can be defined for any kind of
objects.
Miscellaneous Methods. Several other error-tolerant graph matching
methods have been proposed in the literature, for instance, graph matching
based on the Expectation Maximization algorithm [46], on replicator equa-
tions [61], and on graduated assignment [28]. Random walks in graphs [29,
69], approximate least-squares and interpolation theory algorithms [91], and
random graphs [99] have also been employed for error-tolerant graph match-
ing.
5. Graph Matching for Data Mining and Information
Retrieval
The use of graphs and graph matching has become a promising approach in
data mining and related areas [16]. In fact, querying graph databases has a long
tradition and dates back to the time when the first algorithms for subgraph iso-
morphism detection became available. Yet, the use of conventional subgraph
isomorphism in graph based data mining implicates severe limitations. First
of all, the underlying database graph often includes a rather large number of
attributes, some of which might be irrelevant for a particular query. The second
232 MANAGING AND MINING GRAPH DATA
person(Ina, Rangel,
)
e-mail(Slides,
10/4/00, 2K)
person(John, Arnold,
)
(a) Query graph
person(Ina, Rangel,
-)
e-mail(X, Y, -)
person(John, Arnold,
)
(b) Query graph with variables and don’t care
symbols
person(Ina,
)
e-mail(Slides,
10/4/00, 2K)
person(John, Arnold,
)
person(Jennifer, Fraser,
)
e-mail(Paper,
11/4/00, 5K)
e-mail(Deadline,
8/4/00, 1K)
(c) Database graph
Figure 7.7. Query and database graphs.
restriction arises from the limited answer format provided by conventional sub-
graph isomorphism which is only able to check whether or not a query graph
is embedded in a larger database graph. Thirdly, subgraph isomorphism in its
original mode does not allow constraints that may be imposed on the attributes
of a query to model restrictions or dependencies.
The generalized subgraph isomorphism retrieval procedure described in [6]
overcomes these three restrictions. First, the approach offers the possibility to
mask out attributes in queries. To this end, don’t care values are introduced for
attributes that are irrelevant. Secondly, to make the retrieval of more specific
information from the database graph possible than just a binary decision yes
or no, variables are used. By means of these variables, one is able to retrieve
values of specific attributes from the database graph. Thirdly, the concept of
constrained variables, for example, variables that can assume only values from
a certain interval, allows one to define more specific queries.
The approach to knowledge mining and information retrieval proposed
in [6] is based on the idea of specifying a query by means of a query graph,
which can be used to extract information from a large database graph. In con-
trast with Definition 7.1, the graphs employed are defined in a more general
way. Rather than using just a single label, each node in a graph is labeled by
a type and some attributes. The same accounts for the edges. In Fig. 7.7 (a)
an example of a query graph is shown. In this illustration nodes are of the
type person and labeled with the person’s first and second name, and e-mail
address. Edges are of the type e-mail and labeled with the e-mail’s subject, the
date, and the size. Note that in general there may occur nodes as well as edges
of different type in the same graph.