Managing and Mining Graph Data part 33 pdf
Bạn đang xem bản rút gọn của tài liệu. Xem và tải ngay bản đầy đủ của tài liệu tại đây (1.7 MB, 10 trang )
306 MANAGING AND MINING GRAPH DATA
relative density techniques look for a user-defined number 𝑘 densest regions.
The alert reader may have noticed that relative density discovery is closely
related to clustering and in fact shares many features with it.
Since this book contains another chapter dedicated to graph clustering, we
will focus our attention on absolute density measures. However, we will have
more so say about the relationship between clustering and density at the end of
this section.
2.2 Graph Terminology
Let 𝐺(𝑉, 𝐸) be a graph with ∣𝑉 ∣ vertices and ∣𝐸∣ edges. If the edges are
weighted, then 𝑤(𝑢) is the weight of edge 𝑢. We treat unweighted graphs
as the special case where all weights are equal to 1. Let 𝑆 and 𝑇 be sub-
sets of 𝑉 . For an undirected graph, 𝐸(𝑆) is the set of induced edges on
𝑆: 𝐸(𝑆) = {(𝑢, 𝑣) ∈ 𝐸 ∣𝑢, 𝑣 ∈ 𝑆}. Then, 𝐻
𝑆
is the induced subgraph
(𝑆, 𝐸(𝑆)). Similarly, 𝐸(𝑆, 𝑇 ) designates the set of edges from 𝑆 to 𝑇. 𝐻
𝑆,𝑇
is the induced subgraph (𝑆, 𝑇, 𝐸(𝑆, 𝑇)). Note that 𝑆 and 𝑇 are not necessarily
disjoint from each other. If 𝑆 ∩ 𝑇 = ∅, 𝐻
𝑆,𝑇
is a bipartite graph. If 𝑆 and 𝑇
are not disjoint (possibly 𝑆 = 𝑇 = 𝑉 ), this notation can be used to represent a
directed graph.
A dense component is a maximal induced subgraph which also satisfies
some density constraint. A component 𝐻
𝑆
is maximal if no other subgraph
of 𝐺 which is a superset of 𝐻
𝑆
would satisfy the density constraints. Table
10.1 defines some basic graph concepts and measures that we will use to de-
fine density metrics.
Table 10.1. Graph Terminology
Symbol Description
𝐺(𝑉, 𝐸) graph with vertex set 𝑉 and edge set 𝐸
𝐻
𝑆
subgraph with vertex set 𝑆 and edge set 𝐸(𝑆)
𝐻
𝑆,𝑇
subgraph with vertex set 𝑆 ∪ 𝑇 and edge set 𝐸(𝑆, 𝑇)
𝑤(𝑢) weight of edge 𝑢
𝑁
𝐺
(𝑢) neighbor set of vertex 𝑢 in 𝐺: {𝑣∣ ( 𝑢, 𝑣) ∈ 𝐸}
𝑁
𝑆
(𝑢) only those neighbors of vertex 𝑢 that are in 𝑆: {𝑣∣ (𝑢, 𝑣) ∈ 𝑆}
𝛿
𝐺
(𝑢) (weighted) degree of 𝑢 in 𝐺 :
∑
𝑣∈𝑁
𝐺
(𝑢)
𝑤(𝑣)
𝛿
𝑆
(𝑢) (weighted) degree of 𝑢 in 𝑆 :
∑
𝑣∈𝑁
𝑆
(𝑢)
𝑤(𝑣)
𝑑
𝐺
(𝑢, 𝑣) shortest (weighted) path from 𝑢 to 𝑣 traversing any edges in 𝐺
𝑑
𝑆
(𝑢, 𝑣) shortest (weighted) path from 𝑢 to 𝑣 traversing only edges in 𝐸(𝑆)
We now formally define the density of S, 𝑑𝑒𝑛(𝑆), as the ratio of the total
weight of edges in 𝐸(𝑆) to the number of possible edges among ∣𝑆∣ vertices.
If the graph is unweighted, then the numerator is simply the number of actual
A Survey of Algorithms for Dense Subgraph Discovery 307
edges, and the maximum possible density is 1. If the graph is weighted, the
maximum density is unbounded. The number of possible edges in an undi-
rected graph of size 𝑛 is
(
𝑛
2
)
= 𝑛(𝑛 − 1)/2. We give the formulas for an
undirected graph; the formulas for a directed graph lack the factor of 2.
𝑑𝑒𝑛(𝑆) =
2∣𝐸(𝑆)∣
∣𝑆∣(∣𝑆∣ − 1)
𝑑𝑒𝑛
𝑊
(𝑆) =
2
∑
𝑢,𝑣∈𝑆
𝑤(𝑢, 𝑣)
∣𝑆∣(∣𝑆∣ − 1)
Some authors define density as the ratio of the number of edges to the number
of vertices:
∣𝐸∣
∣𝑉 ∣
. We will refer to this as average degree of S.
Another important metric is the diameter of S, 𝑑𝑖𝑎𝑚(𝑆). Since we have
given two different distance measures, 𝑑
𝑆
and 𝑑
𝐺
, we accordingly offer two
different diameter measures. The first is the standard one, in which we consider
only paths within 𝑆. The second permits paths to stray outside 𝑆, if it offers a
shorter path.
𝑑𝑖𝑎𝑚(𝑆) = 𝑚𝑎𝑥{𝑑
𝑆
(𝑢, 𝑣)∣ 𝑢, 𝑣 ∈ 𝑆}
𝑑𝑖𝑎𝑚
𝐺
(𝑆) = 𝑚𝑎𝑥{𝑑
𝐺
(𝑢, 𝑣)∣ 𝑢, 𝑣 ∈ 𝑆}
2.3 Definitions of Dense Components
We now present a collection of measures that have been used to define dense
components in the literature (Table 10.2). To focus on the fundamentals, we
assume unweighted graphs. In a sense, all dense components are either cliques,
which represent the ideal, or some relaxation of the ideal. There relaxations
fall into three categories: density, degree, and distance. Each relaxation can be
quantified as either a percentage factor or a subtractive amount. While most of
there definitions are widely-recognized standards, the name quasi-clique has
been applied to any relaxation, with different authors giving different formal
definitions. Abello [1] defined the term in terms of overall edge density, with-
out any constraint on individual vertices. This offers considerable flexibility
in the component topology. Several other authors [36, 32, 33] have opted to
define quasi-clique in terms of minimum degree of each vertex. Li et al. [32]
provide a brief overview and comparison of quasi-cliques. In our table, when
the authorship of a specific metric can be traced, it is given. Our list is not
exhaustive; however, the majority of definitions can be reduced to some com-
bination of density, degree, and diameter.
Note that in unweighted graphs, cliques have a density of 1. Density-based
quasi-cliques are only defined for unweighted graphs. We use the term Kd-
clique instead of Mokken’s original name K-clique, because 𝐾-clique is al-
ready defined in the mathematics and computer science communities to mean
a clique with 𝑘 vertices.
308 MANAGING AND MINING GRAPH DATA
Table 10.2. Types of Dense Components
Component Reference Formal definition Description
Clique ∃(𝑖, 𝑗), 𝑖 ∕= 𝑗 ∈ 𝑆 Every vertex connects to every other
vertex in 𝑆.
Quasi-Clique
(density-based)
[1] 𝑑𝑒𝑛(𝑆) ≥ 𝛾 𝑆 has at least 𝛾∣𝑆∣(∣𝑆∣ − 1)/2 edges.
Density may be imbalanced within 𝑆.
Quasi-Clique
(degree-based)
[36] 𝛿
𝑆
(𝑢) ≥ 𝛾 ∗ (𝑘 − 1) Each vertex has 𝛾 percent of the possi-
ble connections to other vertices. Local
degree satisfies a minimum. Compare to
𝐾-core and 𝐾-plex.
K-core [45] 𝛿
𝑆
(𝑢) ≥ 𝑘 Every vertex connects to at least 𝑘 other
vertices in 𝑆. A clique is a (𝑘-1)-core.
K-plex [46] 𝛿
𝑆
(𝑢) ≥ ∣𝑆∣ − 𝑘 Each vertex is missing no more than 𝑘 −
1 edges to its neighbors. A clique is a
1-plex.
Kd-clique [34] 𝑑𝑖𝑎𝑚
𝐺
(𝑆) ≤ 𝑘 The shortest path from any vertex to any
other vertex is not more than 𝑘. An or-
dinary clique is a 1d-clique. Paths may
go outside 𝑆.
K-club [37] 𝑑𝑖𝑎𝑚(𝑆) ≤ 𝑘 The shortest path from any vertex to any
other vertex is not more than 𝑘. Paths
may not go outside 𝑆. Therefore, every
K-club is a K-clique.
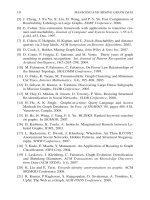
Figure 10.1, a superset of an illustration from Wasserman and Faust [53],
demonstrates each of the dense components that we have defined above.
Cliques: {1,2,3} and {2,3,4}
0.8-Quasi-clique: {1,2,3,4} (includes 5/6 > 0.83 of possible edges)
2-Core: {1,2,3,4,5,6,7}
3-Core: none
2-Plex: {1,2,3,4} (vertices 1 and 3 are missing one edge each)
2d-Cliques: {1,2,3,4,5,6} and {2,3,4,5,6,7} (In the first component,
5 connects to 6 via 7, which need not be a member of the component)
2-Clubs: {1,2,3,4,5}, {1,2,3,4,6}, and {2,3,5,6,7}
2.4 Dense Component Selection
When mining for dense components in a graph, a few additional questions
must be addressed:
A Survey of Algorithms for Dense Subgraph Discovery 309
1
2
3
4 5
6
7
Figure 10.1. Example Graph to Illustrate Component Types
1 Minimum size 𝜎: What is the minimum number of vertices in a dense
component 𝑆? I.e., ∣𝑆∣ ≥ 𝜎.
2 All or top-𝑁?: One of the following criteria should be applied.
Select all components which meet the size, density, degree, and
distance constraints.
Select the 𝑁 highest ranking components that meet the minimum
constraints. A ranking function must be established. This can be
as simple as one of the same metrics used for minimum constraints
(size, density, degree, distance, etc.) or a linear combination of
them.
Select the 𝑁 highest ranking components, with no minimum con-
straints.
3 Overlap: May two components share vertices?
2.5 Relationship between Clusters and Dense
Components
The measures described above set an absolute standard for what constitutes
a dense component. Another approach is to find the most dense components on
a relative basis. This is the domain of clustering. It may seem that clustering,
a thoroughly-studied topic in data mining with many excellent methodologies,
would provide a solution to dense component discovery. However, clustering
is a very broad term. Readers interested in a survey on clustering may wish to
consult either Jain, Murty, and Flynn [24] or Berkhin [8]. In the data mining
310 MANAGING AND MINING GRAPH DATA
community, clustering refers to the task of assigning similar or nearby items
to the same group while assigning dissimilar/distant items to different groups.
In most clustering algorithms, similarity is a relative concept; therefore it is
potentially suitable for relative density measures. However, not all clustering
algorithms are based on density, and not all types of dense components can be
discovered with clustering algorithms.
Partitioning refers to one class of clustering problem, where the objective
is to assign every item to exactly one group. A 𝑘-partitioning requires the
result to have 𝑘 groups. 𝐾-partitioning is not a good approach for identifying
absolute dense components, because the objectives are at odds. Consider the
well-known 𝑘-Means algorithm applied to a uniform graph. It will generate 𝑘
partitions, because it must. However, the partitioning is arbitrary, changing as
the seed centroids change.
In hierarchical clustering, we construct a tree of clusters. Conceptually, as
well as in actual implementation, this can be either agglomerative (bottom-up),
where the closest clusters are merged together to form a parent cluster, or di-
visive (top-down), where a cluster is subdivided into relatively distant child
clusters. In basic greedy agglomerative clustering, the process starts by group-
ing together the two closest items. The pair are now treated as a single item,
and the process is repeated. Here, pairwise distance is the density measure,
and the algorithm seeks to group together the densest pair. If we use divisive
clustering, we can choose to stop subdividing after finding 𝑘 leaf clusters. A
drawback of both hierarchical clustering and partitioning is that they do not
allow for a separate "non-dense" partition. Even sparse regions are forced to
belong to some cluster, so they are lumped together with their closest denser
cores.
Spectral clustering describes a graph as a adjacency matrix 𝑊 , from which
is derived the Laplacian matrix 𝐿 = 𝐷 − 𝑊 (unnormalized) or 𝐿 = 𝐼 −
𝐷
1/2
𝑊 𝐷
−1/2
(normalized), where 𝐷 is the diagonal matrix featuring each ver-
tex’s degree. The eigenvectors of 𝐿 can be used as cluster centroids, with the
corresponding eigenvalues giving an indication of the cut size between clus-
ters. Since we want minimum cut size, the smallest eigenvalues are chosen
first. This ranking of clusters is an appealing feature for dense component
discovery.
None of these clustering methods, however, are suited for an absolute den-
sity criterion. Nor can they handle overlapping clusters. Therefore, some
but not all clustering criteria are dense component criteria. Most clustering
methods are suitable for relative dense component discovery, excluding 𝑘-
partitioning methods.
A Survey of Algorithms for Dense Subgraph Discovery 311
3. Algorithms for Detecting Dense Components in a
Single Graph
In this section, we explore algorithmic approaches for finding dense com-
ponents. First we look at basic exact algorithms for finding cliques and quasi-
cliques and comment on their time complexity. Because the clique problem is
NP-hard, we then consider some more time efficient solutions. The algorithms
can be categorized as follows: Exact enumeration (Section 3.1), Fast Heuristic
Enumeration (Section 3.2), and Bounded Approximation Algorithms (Section
3.3). We review some recent works related to dense component discovery,
concentrating on the details of several well-received algorithms.
The following table (Table 10.3) gives an overview of the major algorithmic
approaches and lists the representative examples we consider in this chapter.
Table 10.3. Overview of Dense Component Algorithms
Algorithm Type Component Type Example Comments
Enumeration Clique [12]
Biclique [35]
Quasi-clique [33] min. degree for each vertex
Quasi-biclique [47]
𝑘-core [7]
Fast Heuristic
Enumeration
Maximal biclique [30] nonoverlapping
Quasi-clique/biclique [13] spectral analysis
Relative density [18] shingling
Maximal quasi-biclique [32] balanced noise tolerance
Quasi-clique, 𝑘-core [52] pruned search; visual results with
upper-bounded estimates
Bounded Max. average degree [14] undirected graph: 2-approx.
Approximation directed graph: 2+𝜖-approx.
Densest subgraph,
𝑛 ≥ 𝑘 [4] 1/3-approx.
Subgraph of known
density 𝜃 [3] finds subgraph with density
Ω(𝜃/ log Δ)
3.1 Exact Enumeration Approach
The most natural way to discover dense components in a graph is to enu-
merate all possible subsets of vertices and to check if some of them satisfy the
definition of dense components. In the following, we investigate some algo-
rithms for discovering dense components by explicit enumeration.
312 MANAGING AND MINING GRAPH DATA
Enumeration Approach. Finding maximal cliques in a graph may be
straightforward, but it is time-consuming. The clique decision problem, decid-
ing whether a graph of size 𝑛 has a clique of size at least 𝑘, is one of Karp’s
21 NP-Complete problems [28]. It is easy to show that the clique optimization
problem, finding a largest clique in a graph, is also NP-Complete, because the
optimization and decision problems each can be reduced in polynomial time
to the other. Our goal is to enumerate all cliques. Moon and Moser showed
that a graph may contain up to 3
𝑛/3
maximal cliques [38]. Therefore, even for
modest-sized graphs, it is important to find the most effective algorithm.
One well-known enumeration algorithm for generating cliques was pro-
posed by Bron and Kerbosch [12]. This algorithm utilizes the branch-and-
bound technique in order to prune branches which are unable to generate a
clique. The basic idea is to extend a subset of vertices, until the clique is max-
imal, by adding a vertex from a candidate set but not in a exclusion set. Let 𝐶
be the set of vertices which already form a clique, 𝐶𝑎𝑛𝑑 be the set of vertices
which may potentially be used for extending 𝐶, and 𝑁𝐶𝑎𝑛𝑑 be the set of ver-
tices which are not allowed to be candidates for 𝐶. 𝑁(𝑣) are the neighbors of
vertex 𝑣. Initially, 𝐶 and 𝑁𝐶𝑎𝑛𝑑 are empty, and 𝐶𝑎𝑛𝑑 contains all vertices
in the graph. Given 𝐶, 𝐶𝑎𝑛𝑑 and 𝑁𝐶𝑎𝑛𝑑, we describe the Bron-Kerbosch
algorithm below. The authors experimentally observed 𝑂(3.14
𝑛
), but did not
prove their theoretical performance.
Algorithm 6 CliqueEnumeration(𝐶,𝐶𝑎𝑛𝑑,𝑁𝐶𝑎𝑛𝑑)
if 𝐶𝑎𝑛𝑑 = ∅ and 𝑁𝐶𝑎𝑛𝑑 = ∅ then
output the clique induced by vertices 𝐶;
else
for all 𝑣
𝑖
∈ 𝐶𝑎𝑛𝑑 do
𝐶𝑎𝑛𝑑 ← 𝐶𝑎𝑛𝑑 ∖ {𝑣
𝑖
};
call 𝐶𝑙𝑖𝑞𝑢𝑒𝐸𝑛𝑢𝑚𝑒𝑟𝑎𝑡𝑖𝑜𝑛(𝐶∪{𝑣
𝑖
}, 𝐶𝑎𝑛𝑑∩𝑁(𝑣
𝑖
), 𝑁𝐶𝑎𝑛𝑑∩𝑁(𝑣
𝑖
));
𝑁𝐶𝑎𝑛𝑑 ← 𝑁 𝐶𝑎𝑛𝑑 ∪ {𝑣
𝑖
};
end for
end if
Makino et al. [35] proposed new algorithms making full use of efficient
matrix multiplication to enumerate all maximal cliques in a general graph or
bicliques in a bipartite graph. They developed different algorithms for different
types of graphs (general graph, bipartite, dense, and sparse). In particular, for
a sparse graph such that the degree of each vertex is bounded by Δ ≪ ∣𝑉 ∣,
an algorithm with 𝑂(∣𝑉 ∣∣𝐸∣) preprocessing time, 𝑂(Δ
4
) time delay (i.e, the
bound of running time between two consecutive outputs) and 𝑂(∣𝑉 ∣ + ∣𝐸∣)
space is developed to enumerate all maximal cliques. Experimental results
demonstrate good performance for sparse graphs.
A Survey of Algorithms for Dense Subgraph Discovery 313
Quasi-clique Enumeration.
Compared to exact cliques, quasi-cliques
provide both more flexibility of the components being sought as well as more
opportunities for pruning the search space. However, the time complexity gen-
erally remains NP-complete. The 𝑄𝑢𝑖𝑐𝑘 algorithm, introduced in [33], pro-
vided an illustrative example. The authors studied the problem of mining max-
imal degree-based quasi-cliques with size at least 𝑚𝑖𝑛
𝑠𝑖𝑧𝑒 and degree of each
vertex at least ⌈𝛾(∣𝑉 ∣−1)⌉. The 𝑄𝑢𝑖𝑐𝑘 algorithm integrates some novel prun-
ing techniques based on degree of vertices with a traditional depth-first search
framework to prune the unqualified vertices as soon as possible. Those pruning
techniques also can be combined with other existing algorithms to achieve the
goal of mining maximal quasi-cliques.
They employ these established pruning techniques based on diameter, min-
imum size threshold, and vertex degree. Let 𝑁
𝐺
𝑘
(𝑣) = {𝑢∣𝑑𝑖𝑠𝑡
𝐺
(𝑢, 𝑣) ≤ 𝑘}
be the set of vertices that are within a distance of 𝑘 from vertex 𝑣, 𝑖𝑛𝑑𝑒𝑔
𝑋
(𝑢)
denotes the number of vertices in 𝑋 that are adjacent to 𝑢, and 𝑒𝑥𝑑𝑒𝑔
𝑋
(𝑢) rep-
resents the number of vertices in 𝑐𝑎𝑛𝑑
𝑒𝑥𝑡𝑠(𝑋) that are adjacent to 𝑢. All ver-
tices are sorted in lexicographic order, then 𝑐𝑎𝑛𝑑
𝑒𝑥𝑡𝑠(𝑋) is the set of vertices
after the last vertex in 𝑋 which can be used to extend 𝑋. For the pruning tech-
nique based on graph diameter, the vertices which are not in ∩
𝑣∈𝑋
𝑁
𝐺
𝑘
(𝑣) can
be removed from 𝑐𝑎𝑛𝑑
𝑒𝑥𝑡𝑠(𝑋). Considering the minimum size threshold,
the vertices whose degree is less than ⌈𝛾(𝑚𝑖𝑛
𝑠𝑖𝑧𝑒 − 1)⌉ should be removed.
In addition, they introduce five new pruning techniques. The first two tech-
niques consider the lower and upper bound of the number of vertices that can
be used to extend current 𝑋. The first pruning technique is based on the upper
bound of the number of vertices that can be added to 𝑋 concurrently to form a
𝛾-quasi-clique. In other words, given a vertex set 𝑋, the maximum number of
vertices in 𝑐𝑎𝑛𝑑
𝑒𝑥𝑡𝑠(𝑋) that can be added into 𝑋 is bounded by the minimal
degree of the vertices in 𝑋; The second one is based on the lower bound of
the number of vertices that can be added to 𝑋 concurrently to form a 𝛾-quasi-
clique. The third technique is based on critical vertices. If we can find some
critical vertices of 𝑋, then all vertices in 𝑐𝑎𝑛𝑑
𝑒𝑥𝑡𝑠(𝑋) and adjacent to critical
vertices are added into 𝑋. Technique 4 is based on cover vertex 𝑢 which maxi-
mizes the size of 𝐶
𝑋
(𝑢) = 𝑐𝑎𝑛𝑑 𝑒𝑥𝑡𝑠(𝑋) ∩𝑁
𝐺
(𝑢)∩(∩
𝑣∈𝑋∧(𝑢,𝑣)∋𝐸
𝑁
𝐺
(𝑣)).
Lemma 10.1. [33] Let 𝑋 be a vertex set and 𝑢 be a vertex in 𝑐𝑎𝑛𝑑
𝑒𝑥𝑡𝑠(𝑋)
such that 𝑖𝑛𝑑𝑒𝑔
𝑋
(𝑢) ≥ ⌈𝛾 × ∣𝑋∣⌉. If for any vertex 𝑣 ∈ 𝑋 such that
(𝑢, 𝑣) ∈ 𝐸, we have 𝑖𝑛𝑑𝑒𝑔
𝑋
(𝑣) ≥ ⌈𝛾 × ∣𝑋∣⌉, then for any vertex set 𝑌
such that 𝐺(𝑌 ) is a 𝛾-quasi-clique and 𝑌 ⊆ (𝑋 ∪(𝑐𝑎𝑛𝑑
𝑒𝑥𝑡𝑠(𝑋) ∩𝑁
𝐺
(𝑢) ∩
(∩
𝑣∈𝑋∧(𝑢,𝑣)∋𝐸
𝑁
𝐺
(𝑣)))), 𝐺(𝑌 ) cannot be a maximal 𝛾-quasi-clique.
From the above lemma, we can prune the 𝐶
𝑋
(𝑢) of cover vertex 𝑢 from
𝑐𝑎𝑛𝑑
𝑒𝑥𝑡𝑠(𝑋) to reduce the search space. The last technique, the so-called
lookahead technique, is to check if 𝑋 ∪ 𝑐𝑎𝑛𝑑
𝑒𝑥𝑡𝑠(𝑋) is 𝛾-quasi-clique. If
314 MANAGING AND MINING GRAPH DATA
so, we do not need to extend 𝑋 anymore and reduce some computational cost.
See Algorithm 𝑄𝑢𝑖𝑐𝑘 above.
Algorithm 7 Quick(𝑋, 𝑐𝑎𝑛𝑑 𝑒𝑥𝑡𝑠(𝑋), 𝛾, 𝑚𝑖𝑛 𝑠𝑖𝑧𝑒)
find the cover vertex 𝑢 of 𝑋 and sort vertices in 𝑐𝑎𝑛𝑑 𝑒𝑥𝑡𝑠(𝑋);
for all 𝑣 ∈ 𝑐𝑎𝑛𝑑
𝑒𝑥𝑡𝑠(𝑋) − 𝐶
𝑋
(𝑢) do
apply minimum size constraint on ∣𝑋∣ + ∣𝑐𝑎𝑛𝑑
𝑒𝑥𝑡𝑠(𝑋)∣;
apply lookahead technique (technique 5) to prune search space;
remove the vertices that are not in 𝑁
𝐺
𝑘
(𝑣);
𝑌 ← 𝑋 ∪ {𝑢};
calculate the upper bound and lower bound of the number vertices to be
added to 𝑌 in order to form 𝛾-quasi-clique;
recursively prune unqualified vertices (techniques 1,2);
identify critical vertices of 𝑌 and apply pruning (technique 3);
apply existing pruning techniques to further reduce the search space;
end for
return 𝛾-quasi-cliques;
𝑲-Core Enumeration. For 𝑘-cores, we are happily able to escape
𝑁𝑃 -complete time complexity; greedy algorithms with polynomial time exist.
Batagelj et al. [7] developed a efficient algorithm running in 𝑂(𝑚) time, based
on the following observation: given a graph 𝐺 = (𝑉, 𝐸), if we recursively
eliminate the vertices with degree less than 𝑘 and their incident edges, the re-
sulting graph is a 𝑘-core. The algorithm is quite simple and can be considered
as a variant of [29]. This algorithm attempts to assign each vertex with a core
number to which it belongs. At the beginning, the algorithm places all vertices
in a priority queue based on minimim degree. For each iteration, we eliminate
the first vertex 𝑣 (i.e, the vertex with lowest degree) from the queue. After then,
we assign the degree of 𝑣 as its core number. Considering 𝑣’s neighbors whose
degrees are greater than that of 𝑣, we decrease their degrees by one and reorder
the remaining vertices in the queue. We repeat such procedure until the queue
is empty. Finally, we output the 𝑘-cores based on their assigned core numbers.
3.2 Heuristic Approach
As mentioned before, it is impractical to exactly enumerate all maximal
cliques, especially for some real applications like protein-protein interaction
networks which have a very large number of vertices. In this case, fast heuris-
tic methods are available to address this problem. These methods are able to
efficiently identify some dense components, but they cannot guarantee to dis-
cover all dense components.
A Survey of Algorithms for Dense Subgraph Discovery 315
Shingling Technique.
Gibson et al. [18] propose an new algorithm based
on shingling for discovering large dense bipartite subgraphs in massive graphs.
In this paper, a dense bipartite subgraph is considered a cohesive group of
vertices which share many common neighbors. Since this algorithm utilizes
the shingling technique to convert each dense component with arbitrary size
into shingles with constant size, it is very efficient and practical for single large
graphs and can be easily extended for streaming graph data.
We first provide some basic knowledge related to the shingling technique.
Shingling was firstly introduced in [11] and has been widely used to esti-
mate the similarity of web pages, as defined by a particular feature extraction
scheme. In this work, shingling is applied to generate two constant-size finger-
prints for two different subsets 𝐴 and 𝐵 from set 𝑆 of a universe 𝑈 of elements,
such that the similarity of 𝐴 and 𝐵 can be computed easily by comparing fin-
gerprints of 𝐴 and 𝐵, respectively. Assuming 𝜋 is a random permutation of
the elements in the ordered universe 𝑈 which contains 𝐴 and 𝐵, the probabil-
ity that the smallest element of 𝐴 and 𝐵 is the same, is equal to the Jaccard
coefficient. That is,
𝑃 𝑟[𝜋
−1
(𝑚𝑖𝑛
𝑎∈𝐴
{𝜋(𝑎)}) = 𝜋
−1
(𝑚𝑖𝑛
𝑏∈𝐵
{𝜋(𝑏)})] =
∣𝐴 ∩ 𝐵∣
∣𝐴 ∪ 𝐵∣
Given a constant number 𝑐 of permutations 𝜋
1
, ⋅⋅⋅ , 𝜋
𝑐
of 𝑈, we generate a
fingerprinting vector whose 𝑖-th element is 𝑚𝑖𝑛
𝑎∈𝐴
𝜋
𝑖
(𝑎). The similarity be-
tween 𝐴 and 𝐵 is estimated by the number of positions which have the same
element with respect to their corresponding fingerprint vectors. Furthermore,
we can generalize this approach by considering every 𝑠-element subset of en-
tire set instead of the subset with only one element. Then the similarity of
two sets 𝐴 and 𝐵 can be measured by the fraction of these 𝑠-element subsets
that appear in both. This actually is an agreement measure used in information
retrieval. We say each 𝑠-element subset is a shingle. Thus this feature extrac-
tion approach is named the (𝑠, 𝑐) shingling algorithm. Given a 𝑛-element set
𝐴 = {𝑎
𝑖
, 0 ≤ 𝑖 ≤ 𝑛} where each element 𝑎
𝑖
is a string, the (𝑠, 𝑐) shingling
algorithm tries to extract 𝑐 shingles such that the length of each shingle is exact
𝑠. We start from converting each string 𝑎
𝑖
into a integer 𝑥
𝑖
by a hashing func-
tion. Following that, given two random integer vectors 𝑅, 𝑆 with size 𝑐, we
generate a 𝑛-element temporary set 𝑌 = {𝑦
𝑖
, 0 ≤ 𝑖 ≤ 𝑛} where each element
𝑦
𝑖
= 𝑅
𝑗
× 𝑥
𝑖
+ 𝑆
𝑗
. Then the 𝑠 smallest elements of 𝑌 are selected and con-
catenated together to form a new string 𝑦. Finally, we apply a hash function
on string 𝑦 to get one shingle. We repeat such procedure 𝑐 times in order to
generate 𝑐 shingles.
Remember that our goal is to discover dense bipartite subgraphs such that
vertices in one side share some common neighbors in another side. Figure
10.2 illustrates a simple scenario in a web community where each web page