Managing and Mining Graph Data part 34 pot
Bạn đang xem bản rút gọn của tài liệu. Xem và tải ngay bản đầy đủ của tài liệu tại đây (1.71 MB, 10 trang )
316 MANAGING AND MINING GRAPH DATA
Figure 10.2. Simple example of web graph
Figure 10.3. Illustrative example of shingles
in the upper part links to some other web pages in the lower part. We can de-
scribe each upper web page (vertex) by the list of lower web pages to which it
links. In order to put some vertices into the same group, we have to measure
the similarity of the vertices which denotes to what extent they share common
neighbors. With the help of shingling, for each vertex in the upper part, we can
generate constant-size shingles to describe its outlinks (i.e, its neighbors in the
lower part). As shown in Figure 10.3, the outlinks to the lower part are con-
verted to shingles 𝑠
1
, 𝑠
2
, 𝑠
3
, 𝑠
4
. Since the size of shingles can be significantly
smaller than the original data, much computational cost can be saved in terms
of time and space.
In the paper, Gibson et al. repeatedly employ the shingling algorithm for
converting dense component into constant-size shingles. The algorithm is a
two-step procedure. Step 1 is recursive shingling, where the goal is to exact
some subsets of vertices where the vertices in each subset share many com-
mon neighbors. Figure 10.4 illustrates the recursive shingling process for a
graph (Γ(𝑉 ) is the outlinks of vertices 𝑉 ). After the first shingling process,
for each vertex 𝑣 ∈ 𝑉 , its outlinks Γ(𝑣) are converted into a constant size of
first-level shingles 𝑣
′
. Then we can transpose the mapping relation 𝐸
0
to 𝐸
1
so
that each shingle in 𝑣
′
corresponds to a set of vertices which share this shingle.
In other words, a new bipartite graph is constructed where each vertex in one
A Survey of Algorithms for Dense Subgraph Discovery 317
Figure 10.4. Recursive Shingling Step
part represents one shingle, and each vertex in another part is the original ver-
tex. If there is a edge from shingle 𝑣
′
to vertex 𝑣, 𝑣
′
is one of the shingles for
𝑣’s outlinks generated by shingling. From now on, 𝑉 is considered as Γ(𝑉
′
).
Following the same procedure, we apply shingling on 𝑉
′
and Γ(𝑉
′
). After
the second shingling process, 𝑉 is converted into a constant-size 𝑉
′′
, so-called
second-level shingles. Similar to the transposition in the first shingling pro-
cess, we transpose 𝐸
1
to 𝐸
2
and obtain many pairs < 𝑣
′′
, Γ(𝑣
′′
) > where 𝑣
′′
is second-level shingles and Γ(𝑣
′′
) are all the first-level shingles that share a
second-level shingle. Step 2 is clustering, where the aim is to merge first-level
shingles which share some second-level shingles. Essentially, merges a num-
ber of biclique subsets into one dense component. Specifically, given all pairs
< 𝑣
′′
, Γ(𝑣
′′
) >, a traditional algorithm, namely 𝑈 𝑛𝑖𝑜𝑛𝐹 𝑖𝑛𝑑, is used to merge
some first-level shingles in Γ(𝑉
′′
) such that any two first-level shingles at least
share one second-level shingle. To the end, we map the clustering results back
to the vertices of the original graph and generate one dense bipartite subgraph
for each cluster. The entire algorithm is presented in Algorithm
DiscoverDens-
eSubgraph
.
GRASP Algorithm. As mentioned in Table 10.2, Abello et al. [1] were
one of the first to formally define quasi-dense components, namely 𝛾-cliques,
and to investigate their discovery. They utilize a existing framework known
as a Greedy Randomized Adaptive Search Procedure (GRASP). Their paper
makes two major contributions. First, they propose a novel evaluation measure
318 MANAGING AND MINING GRAPH DATA
Algorithm 8 DiscoverDenseSubgraph(𝑐
1
, 𝑠
1
, 𝑐
2
, 𝑠
2
)
apply recursive shingling algorithms to obtain first- and second-level shin-
gles;
let 𝑆 =< 𝑠, Γ(𝑠) > be first-level shingles;
let 𝑇 =< 𝑡, Γ(𝑡) > be second-level shingles;
apply clustering approach to get the clustering result 𝒞 in terms of first-level
shingles;
for all 𝐶 ∈ 𝒞 do
output ∪
𝑠∈𝐶
Γ(𝑠) as a dense subgraph;
end for
on potential improvement of adding a new vertex to a current quasi-clique.
This measure enables the construction of quasi-cliques incrementally. Second,
a semi-external memory algorithm incorporating edge pruning and external
breath first search traversal is introduced to handle very large graphs. The basic
idea is to decompose a large graph into several small components, then process
each of them using GRASP. In the following, we concentrate our efforts on
discussing the first point and its usage in GRASP. Interested readers can refer
to [1] for the details of the second algorithm.
GRASP is a multi-start iterative process, with two steps per iteration, ini-
tial construction and local optimization. The initial construction step aims to
produce a feasible solution for subsequent processing. For local optimization,
we examine the neighborhood of the current solution in terms of the solution
space, and try to find a better local solution. A comprehensive survey of the
GRASP approach can be found in [41]. In this paper, Abello et al. proposed a
incremental algorithm to build a maximal 𝛾-clique, which serves as the initial
feasible solution in GRASP. Before we move to the algorithm, we first define
the potential of a vertex set 𝑅 as
𝜙(𝑅) = ∣𝐸(𝑅)∣ −𝛾
(
∣𝑅∣
2
)
and the potential of 𝑅 with respect to a disjoint vertices set 𝑆 to be
𝜙
𝑆
(𝑅) = 𝜙(𝑆 ∪ 𝑅)
Furthermore, considering a graph 𝐺 = (𝑉, 𝐸) and a 𝛾-clique induced by ver-
tices set 𝑆 ⊂ 𝑉 , we call a vertex 𝑥 ∈ (𝑉 ∖𝑆) a 𝛿-vertex with respect to 𝑆 if and
only if the graph induced by 𝑆 ∪ {𝑥} is a 𝛾-clique. Then, the set of 𝛾-vertices
with respect to 𝑆 is denoted as 𝒩
𝛾
(𝑆). Given this, the incremental algorithm
tries to add a good vertex in 𝒩
𝛾
(𝑆) into 𝑆. To facilitate our discussion, a
potential difference of a vertex 𝑦 ∈ 𝒩
𝛾
(𝑆) ∖ {𝑥} is defined to be
𝛿
𝑆,𝑥
(𝑦) = 𝜙
𝑆∪{𝑥}
({𝑦}) −𝜙
𝑆
({𝑦})
A Survey of Algorithms for Dense Subgraph Discovery 319
The above equation can also expressed as
𝛿
𝑆,𝑥
(𝑦) = 𝑑𝑒𝑔(𝑥)∣
𝑆
+ 𝑑𝑒𝑔(𝑦)∣
{𝑥}
− 𝛾(∣𝑆∣+ 1)
where 𝑑𝑒𝑔(𝑥)∣
𝑆
is the degree of 𝑥 in the graph induced by vertex set 𝑆. This
equation implies that the potential of 𝑦 which is a 𝛾-neighbor of 𝑥 does not
decrease when 𝑥 is included in 𝑆. Here the 𝛾-neighbors of vertex 𝑥 are the
neighbors of 𝑥 with 𝑑𝑒𝑔(𝑥)∣
𝑆
greater than 𝛾∣𝑆∣. The total effect caused by
adding vertex 𝑥 to current 𝛾-clique 𝑆 is
Δ
𝑆,𝑥
=
∑
𝑦 ∈𝒩
𝛾
(𝑆)∖{𝑥}
𝛿
𝑆,𝑥
(𝑦) = ∣𝒩
𝛾
({𝑥})∣ + ∣𝒩
𝛾
(𝑆)∣(𝑑𝑒𝑔(𝑥)∣
𝑆
− 𝛾(∣𝑆∣+ 1))
We see that the vertices with a large number of 𝛾-neighbors and high degree
with respect to 𝑆 are preferred to be selected. A greedy algorithm to build
a maximal 𝛾-clique is outlined in Algorithm DiscoverMaximalQuasi-Clique.
The time complexity of this algorithm is 𝑂(∣𝑆∣∣𝑉 ∣
2
), where 𝑆 the vertex set
used to induce a maximal 𝛾-clique.
Algorithm 9 DiscoverMaximalQuasi-clique(𝑉, 𝐸, 𝛾)
𝛾
∗
← 1, 𝑆
∗
← ∅;
select a vertex 𝑥 ∈ 𝑉 and add into 𝑆
∗
;
while 𝛾
∗
≥ 𝛾 do
𝑆 ← 𝑆
∗
;
if 𝒩
𝛾
∗
(𝑆) ∕= ∅ then
select 𝑥 ∈ 𝒩
𝛾
∗
(𝑆);
else
if 𝒩(𝑆) ∖𝑆 = ∅ then
return 𝑆;
end if
select 𝑥 ∈ 𝒩(𝑆) ∖ 𝑆;
end if
𝑆
∗
← 𝑆 ∪ {𝑥};
𝛾
∗
← 2∣𝐸(𝑆
∗
)∣/(∣𝑆
∗
∣(∣𝑆
∗
∣ − 1));
end while
return 𝑆;
Then applying GRASP, a local search procedure tries to improve the gen-
erated maximal 𝛾-clique. Generally speaking, given current 𝛾-clique induced
by vertex set 𝑆, this procedure attempts to substitute two vertices within 𝑆
with one vertex outside 𝑆 in order to improve aforementioned Δ
𝑆,𝑥
. GRASP
guarantees to obtain a local optimum.
320 MANAGING AND MINING GRAPH DATA
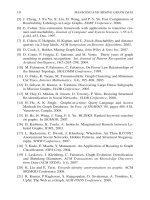
Visualization of Dense Components. Wang et al. [52] combine theoret-
ical bounds, a greedy heuristic for graph traversal, and visual cues to develop
a mining technique for clique, quasi-clique, and 𝑘-core components. Their ap-
proach is named CSV for Cohesive Subgraph Visualization. Figure 10.5 shows
a representative plot and how it is interpreted.
Traversal Order
C_seen(v
i
)
k
Contains w connected vertices with
degree 1 k.
May contain a clique of size 123456k,w).
w
Figure 10.5. Example of CSV Plot
A key measure in CSV is co-cluster size 𝐶𝐶(𝑣, 𝑥), meaning the (estimated)
size of the largest clique containing both vertices 𝑣 and 𝑥. Then, 𝐶(𝑣) =
𝑚𝑎𝑥{𝐶𝐶(𝑣, 𝑥), ∀𝑥 ∈ 𝑁 (𝑣)}.
At the top level of abstraction, the algorithm is not difficult. We maintain a
priority queue of vertices observed so far, sorted by 𝐶(𝑣) value. We traverse
the graph and draw a density plot by iterating the following steps:
1 Remove the top vertex from the queue, making this the current vertex 𝑣.
2 Plot 𝑣.
3 Add 𝑣’s neighbors to the priority queue.
Now for some details. If this is the 𝑖-th iteration, plot the point (𝑖, 𝐶
𝑠𝑒𝑒𝑛
(𝑣
𝑖
)),
where 𝐶
𝑠𝑒𝑒𝑛
(𝑣
𝑖
) is the largest value of 𝐶(𝑣
𝑖
) observed so far. We say "seen so
far" because we may not have observed all of 𝑣 neighbors yet, and even when
A Survey of Algorithms for Dense Subgraph Discovery 321
we have, we are only estimating clique sizes. Next, some neighbors of 𝑣 may
already be in the queue. In this case, update their 𝐶 values and reprioritize.
Due to the estimation method described below, the new estimate is no worse
that the previous one.
Since an exact determination of 𝐶𝐶(𝑣, 𝑥) is computationally expensive,
CSV takes several steps to efficiently find a good estimate of the actual clique
size. First, to reduce the clique search space, the graph’s vertices and edges are
pre-processed to map them to a multi-dimensional space. A certain number of
vertices are selected as pivot points. Then each vertex is mapped to a vector:
𝑣 → 𝑀(𝑣) = {𝑑(𝑣, 𝑝
1
), ⋅⋅⋅ , 𝑑(𝑣, 𝑝
𝑝
)}, where 𝑑(𝑣, 𝑝
𝑖
) is the shortest distance
in the graph from 𝑣 to pivot 𝑝
𝑖
. The authors prove that all the vertices of a
clique map to the same unit cell, so we can search for cliques by searching
individual cells.
Second, CSV further prunes the vertices within each occupied cell. Do the
following for each vertex 𝑣 in each occupied cell: For each neighbor 𝑥 of 𝑣,
identify the set of vertices 𝑌 which connect to both 𝑣 and 𝑥. Construct the
induced subgraph 𝑆(𝑣, 𝑥, 𝑌 ). If there is a clique, it must be a subgraph of 𝑆.
Sort 𝑌 by decreasing order of degree in 𝑆. To be in a 𝑘-clique, a vertex must
have degree ≥ 𝑘 − 1. Consequently, we step through the sorted 𝑌 list and
eliminate the remainder when the threshold 𝛿
𝑆
(𝑦
𝑖
) < 𝑖 − 1 is reached. The
size of the remaining list is an upper bound estimate for 𝐶(𝑣) and 𝐶𝐶(𝑣, 𝑥).
With relatively minor modification, the same general approach can be used for
quasi-cliques and 𝑘-cores.
The slowest step in CSV is searching the cells for pseudo-cliques, with over-
all time complexity 𝑂(∣𝑉 ∣
2
𝑙𝑜𝑔∣𝑉 ∣2
𝑑
). This becomes exponential when the
graph is a single large clique. However, when tested on two real-life datasets,
DBLP co-authorship and SMD stock market networks, 𝑑 << ∣𝑉 ∣, so perfor-
mance is polynomial.
Other Heuristic Approaches. We give a brief overview of three addi-
tional heuristic approaches. Li et al. [32] studied the problem of discovering
dense bipartite subgraphs with so-called balanced noise tolerance, meaning
that each vertex in one part is allowed no more than a certain number or a cer-
tain percentage of missing edges to the other part. This definition can avoid
the density skew found within density-based quasi-cliques. Li et al. observed
that their type of maximal quasi-biclique cannot be trivially expanded from
traditional maximal bicliques. Some useful properties such as bounded clo-
sure and the fixed point property are utilized to develop an efficient algorithm,
𝜇 − 𝐶𝑜𝑚𝑝𝑙𝑒𝑡𝑒𝑄𝐵, for discovering maximal quasi-bicliques with balanced
noise tolerance. Given a bipartite graph, the algorithm looks for maximal
quasi-bicliques where the number of vertices in each part exceeds a specified
value 𝑚𝑠 ≥ 𝜇. Two cases are considered. If 𝑚𝑠 ≥ 2𝜇, the problem is con-
322 MANAGING AND MINING GRAPH DATA
verted into the problem to find exact maximal 𝜇-quasi bicliques that has been
well discussed in [47]. On the other hand, if 𝑚𝑠 < 2𝜇, a depth-first search for
𝜇-tolerance maximal quasi-bicliques whose vertex size is between 𝑚𝑠 and 2𝜇
is conducted to achieve the goal.
A spectral analysis method [13] is used to uncover the functionality of a
certain dense component. To begin, the similarity matrix for a protein-protein
interaction network is defined, and the corresponding eigenvalues and eigen-
vectors are calculated. In particular, each eigenvector with positive eigenvalue
is identified as a quasi-clique, while each eigenvector with negative eigenvalue
is considered a quasi-biclique. Given these dense components, a statistical
test based on p-value is applied to measure whether a dense component is en-
riched with proteins from a particular category more than would be expected
by chance. Simply speaking, the statistical test ensures that the existence of
each dense component is significant with respect to a specific protein category.
If so, that dense component annotated with the corresponding protein function-
ality.
Kumar et al. [30] focus on enumerating emerging communities which have
little or no representation in newsgroups or commercial web directories. They
define an (𝑖, 𝑗) biclique, where the number of vertices in each part are 𝑖 and 𝑗,
respectively, to be the 𝑐𝑜𝑟𝑒 of interested communities. Therefore, this paper
aims to extract a non-overlapping maximal set of 𝑐𝑜𝑟𝑒𝑠 for interested com-
munities. A stream-based algorithm combining a set of pruning techniques
is presented to process huge raw web data and eventually generate the appro-
priate cores. Some open problems like how to automatically extract semantic
information and organize them into a useful structure are also discussed.
3.3 Exact and Approximation Algorithms for Discovering
Densest Components
In this section, we focus on the problem of finding the densest components,
i.e., the quasi-cliques with the highest values of 𝑔𝑎𝑚𝑚𝑎. We first look at
exact solutions, utilizing max-flow/min-cut related algorithms. To reach faster
performance, we then consider several greedy approximation algorithms that
guarantee. These bounded-approximation algorithms are able to efficiently
handle the large graphs and obtain guaranteed reasonable results.
Exact Solution for Discovering Densest Subgraph. We first consider
density of a graph defined as its average degree. Using this definition, Gold-
berg [19] showed that the problem of finding the densest subgraph can be ex-
actly reduced to a sequence of max-flow/min-cut problems. Given a value 𝑔,
algorithm constructs a network and finds a min-cut on it. The resulting sizes
tell us whether there is a subgraph with density at least 𝑔. Given a graph 𝐺
A Survey of Algorithms for Dense Subgraph Discovery 323
with 𝑛 vertices and 𝑚 edges, the construction of its corresponding cut network
are as follows:
1 Add two vertices source 𝑠 and sink 𝑡 to undirected 𝐺;
2 Replace each undirected edge with two directed edges with capacity 1
such that each endpoint is the source and target of those two edges, re-
spectively;
3 Add directed edges with capacity 𝑚 from 𝑠 to all vertices in 𝐺, and add
directed edges with capacity 𝑚 + 2𝑔 − 𝑑
𝑖
from all vertices in 𝐺 to 𝑡,
where 𝑑
𝑖
is the degree of vertex 𝑣
𝑖
in the original graph.
We apply the max-flow/min-cut algorithm to decompose the vertices of the
new network into two non-overlapping sets 𝑆 and 𝑇, such that 𝑠 ∈ 𝑆 and
𝑡 ∈ 𝑇 . Let 𝑉
𝑠
= 𝑆 ∖ {𝑠}. Goldberg proved that there exists a subgraph with
density at least 𝑔 if 𝑉
𝑠
∕= ∅. The following theorem formally presents this
result:
Theorem 10.2. Given 𝑆 and 𝑇 which are generated by the algorithm for max-
flow min-cut problem, if 𝑉
𝑠
∕= ∅, then there is no subgraph with density 𝐷 such
that 𝑔 ≤ 𝐷. If 𝑉
𝑠
= ∅, then there exists a subgraph with density 𝐷 such that
𝑔 ≥ 𝐷.
The remaining issue is to enumerate all possible values of density and apply
the max-flow/min-cut algorithm for each value. Goldberg observed that the
difference between any two subgraphs is no more than
1
𝑛(𝑛−1)
. Combined
with binary search, this observation provides a effective stop criteria to reduce
the search space. The sketch of the entire algorithm is outlined in Algorithm
FindDensestSubgraph.
Greedy Approximation Algorithm with Bound. In [14], Charikar
describes exact and greedy approximation algorithms to discover subgraphs
which can maximize two different notions of density, one for undirected graphs
and one for directed graphs. The density notion utilized for undirected graphs
is the average degree of the subgraph, such that density 𝑓 (𝑆) of the subset 𝑆
is
∣𝐸(𝑆)∣
∣𝑆∣
. For directed graphs, the criteria first proposed by Kannan and Vinay
[27] is applied. That is, given two subsets of vertices 𝑆 ⊆ 𝑉 and 𝑇 ⊆ 𝑉 , the
density of subgraph 𝐻
𝑆,𝑇
is defined as 𝑑(𝑆, 𝑇 ) =
∣𝐸(𝑆,𝑇 )∣
√
∣𝑆∣∣𝑇 ∣
. Here, 𝑆 and 𝑇 are
not necessarily disjoint. This paper studies the optimization problem of dis-
covering a subgraph 𝐻
𝑠
induced by a subset 𝑆 with maximum 𝑓 (𝑆) or 𝐻
𝑆,𝑇
induced by two subsets 𝑆 and 𝑇 with maximum 𝑑(𝑆, 𝑇 ), respectively.
The author shows that finding a subgraph 𝐻
𝑆
in undirected graph with max-
imum 𝑓 (𝑆) is equivalent to solving the following linear programming (LP)
problem:
324 MANAGING AND MINING GRAPH DATA
Algorithm 10 FindDensestSubgraph(𝐺)
𝑚𝑖𝑛𝑑 ← 0; 𝑚𝑎𝑥𝑑 ← 𝑚;
𝑉
𝑠
← ∅;
while 𝑚𝑎𝑥𝑑 − 𝑚𝑖𝑛𝑑 ≥
1
𝑛(𝑛−1)
do
𝑔 ←
𝑚𝑎𝑥𝑑+𝑚𝑖𝑛𝑑
2
;
Construct new network as we have mentioned;
Generate 𝑆 and 𝑇 utilizing max-flow min-cut algorithm;
if 𝑆 = {𝑠} then
𝑚𝑎𝑥𝑑 ← 𝑔;
else
𝑚𝑖𝑛𝑑 ← 𝑔;
𝑉
𝑠
← 𝑆 − {𝑠};
end if
end while
return subgraph induced by 𝑉
𝑠
;
(1) 𝑚𝑎𝑥
∑
𝑖𝑗
𝑥
𝑖𝑗
(2) ∀𝑖𝑗 ∈ 𝐸 𝑥
𝑖𝑗
≤ 𝑦
𝑖
(3) ∀𝑖𝑗 ∈ 𝐸 𝑥
𝑖𝑗
≤ 𝑦
𝑗
(4)
∑
𝑖
𝑦
𝑖
≤ 1
(5) 𝑥
𝑖𝑗
, 𝑦
𝑖
≥ 0
A Survey of Algorithms for Dense Subgraph Discovery 325
From a graph viewpoint, we assign each vertex 𝑣
𝑖
with weight
∑
𝑗
𝑥
𝑖𝑗
, and
𝑚𝑖𝑛(𝑦
𝑖
, 𝑦
𝑗
) is the threshold for the weight of all edges (𝑣
𝑖
, 𝑣
𝑗
) incident to
vertex 𝑣
𝑖
. Then 𝑥
𝑖𝑗
can be considered as the weight of edge (𝑣
𝑖
, 𝑣
𝑗
) which
vertex 𝑣
𝑖
distributes. Weights are normalized so that the sum of threshold for
edges incident to vertex 𝑣
𝑖
,
∑
𝑖
𝑦
𝑖
, is bounded by 1. In this sense, finding
the optimal solution of
∑
𝑖𝑗
𝑥
𝑖𝑗
is equivalent to finding a set of edges such that
the weights of their incident vertices mostly distribute to them. Charikar shows
that the optimality of the above LP problem is exactly equivalent to discovering
the densest subgraph in a undirected graph.
Intuitively, the complexity of this LP problem depends highly on the num-
ber of edges and vertices in the graph (i.e., the number of inequality con-
straints in LP). It is impractical for large graphs. Therefore, Charikar pro-
poses an efficient greedy algorithm and proves that this algorithm produces a
2-approximation for 𝑓 (𝐺). This greedy algorithm is a simple variant of [29].
Let 𝑆 is a subset of 𝑉 and 𝐻
𝑆
is its induced subgraph with density 𝑓 (𝐻
𝑆
).
Given this, we outline this greedy algorithm as follows:
1 Let 𝑆 be the subset of vertices, initialized as 𝑉 ;
2 Let 𝐻
𝑆
be the subgraph induced by vertices 𝑆;
3 For each iteration, eliminate the vertex with lowest degree in 𝐻
𝑆
from 𝑆
and recompute its density;
4 For each iteration, measure the density of 𝐻
𝑆
and record it as a candidate
for densest component
Similar techniques are also applied to finding the densest subgraph in a di-
rected graph. The greedy algorithm for directed graphs takes 𝑂(𝑚 + 𝑛) time.
According to the analysis, Charikar claims that we have to run the greedy al-
gorithm for 𝑂(
log 𝑛
𝜖
) values of c in order to get a 2 + 𝜖 approximation, where
𝑐 = ∣𝑆∣/∣𝑇 ∣ and 𝑆, 𝑇 are two subset of vertices in the graph.
A variant of this approach is presented in [25]. Jin et al. developed an
approximation algorithm for discovering the densest subgraph by introducing
a new notion of rank subgraph. The rank subgraph can be defined as follows:
Definition 10.3. (Rank Subgraph) [25]. Given an undirected graph 𝐺 =
(𝑉, 𝐸) and a positive integer 𝑑, we remove all vertices with degree less than d
and their incident edges from 𝐺. Repeat this procedure until no vertex can be
eliminated and form a new graph 𝐺
𝑑
. Each vertex in 𝐺
𝑑
is adjacent to at least
𝑑 vertices in 𝐺
𝑑
. If 𝐺
𝑑
has no vertices, it is denoted 𝐺
∅
. Given this, construct
a subgraph sequence 𝐺 ⊇ 𝐺
1
⊇ 𝐺
2
⋅⋅⋅ ⊇ 𝐺
𝑙
⊃ 𝐺
𝑙+1
= 𝐺
∅
, where 𝐺
𝑙
∕= 𝐺
∅
and contains at least 𝑙 + 1 vertices. Define 𝑙 as the rank of the graph 𝐺, and
𝐺
𝑙
as the rank subgraph of 𝐺.