Managing and Mining Graph Data part 40 doc
Bạn đang xem bản rút gọn của tài liệu. Xem và tải ngay bản đầy đủ của tài liệu tại đây (1.93 MB, 10 trang )
Mining Graph Patterns 377
In graph mining, it is useful to have sparse weight vectors 𝑤
𝑖
such that only
a limited number of patterns are used for prediction. To this aim, we introduce
the sparseness to the pre-weight vectors 𝑣
𝑖
as
𝑣
𝑖𝑗
= 0, 𝑖𝑓 ∣𝑣
𝑖𝑗
∣ ≤ 𝜖, 𝑗 = 1, , 𝑑.
Due to the linear relationship between 𝑣
𝑖
and 𝑤
𝑖
, 𝑤
𝑖
becomes sparse as well.
Then we can sort ∣𝑣
𝑖𝑗
∣ in the descending order, take the top-𝑘 elements and set
all the other elements to zero.
It is worthwhile to notice that the residual of regression up to the (𝑖 − 1)-th
features,
𝑟
𝑖𝑘
= 𝑦
𝑘
−
𝑖−1
𝑗=1
𝛼
𝑗
𝑤
𝑇
𝑗
𝑥
𝑘
, (3.6)
is equal to the 𝑘-th element of 𝑟
𝑖
. It can be verified by substituting the definition
of 𝛼
𝑗
in Eq.(3.5) into Eq.(3.6). So in the non-deflation algorithm, the pre-
weight vector 𝑣 is obtained as the direction that maximizes the covariance with
residues. This observation highlights the resemblance of PLS and boosting
algorithms.
Graph PLS: Branch-and-Bound Search. In this part, we discuss how to
apply the non-deflation PLS algorithm to graph data. The set of training graphs
is represented as (𝐺
1
, 𝑦
1
), ,(𝐺
𝑛
, 𝑦
𝑛
). Let 𝒫 be the set of all patterns, then the
feature vector of each graph 𝐺
𝑖
is encoded as a ∣𝒫∣-dimensional vector 𝑥
𝑖
.
Since ∣𝒫∣ is a huge number, it is infeasible to keep the whole design matrix.
So the method sets 𝑋 as an empty matrix first, and grows the matrix as the
iteration proceeds. In each iteration, it obtains the set of patterns 𝑝 whose
pre-weight ∣𝑣
𝑖𝑝
∣ is above the threshold, which can be written as
𝑃
𝑖
= {𝑝∣∣
𝑛
𝑗=1
𝑟
𝑖𝑗
𝑥
𝑗𝑝
∣ ≥ 𝜖}. (3.7)
Then the design matrix is expanded to include newly introduced patterns. The
pseudo code of gPLS is described in Algorithm 16.
The pattern search problem in Eq.(3.7) is exactly the same as the one solved
in gboost through a branch-and-bound search. In this problem, the gain func-
tion is defined as 𝑠(𝑝) = ∣
𝑛
𝑗=1
𝑟
𝑖𝑗
𝑥
𝑗𝑝
∣. The pruning condition is described
as follows.
Theorem 12.11. Define ˜𝑦
𝑖
= 𝑠𝑔𝑛(𝑟
𝑖
). For any pattern 𝑝
′
such that 𝑝 ⊆ 𝑝
′
,
𝑠(𝑝
′
) < 𝜖 holds if
max{𝑠
+
(𝑝), 𝑠
−
(𝑝)} < 𝜖, (3.8)
378 MANAGING AND MINING GRAPH DATA
where
𝑠
+
(𝑝) = 2
{𝑖∣˜𝑦
𝑖
=+1,𝑥
𝑖,𝑗
=1}
∣𝑟
𝑖
∣ −
𝑛
𝑖=1
𝑟
𝑖
,
𝑠
−
(𝑝) = 2
{𝑖∣˜𝑦
𝑖
=−1,𝑥
𝑖,𝑗
=1}
∣𝑟
𝑖
∣ +
𝑛
𝑖=1
𝑟
𝑖
.
Algorithm 16 gPLS
Input: Training examples (𝐺
1
, 𝑦
1
), (𝐺
2
, 𝑦
2
), , (𝐺
𝑛
, 𝑦
𝑛
)
Output: Weight vectors 𝑤
𝑖
, 𝑖 = 1, , 𝑚
1: 𝑟
1
= 𝑦, 𝑋 = ∅;
2: for 𝑖 = 1, , 𝑚 do
3: 𝑃
𝑖
= {𝑝∣∣
𝑛
𝑗=1
𝑟
𝑖𝑗
𝑥
𝑗𝑝
∣ ≥ 𝜖};
4: 𝑋
𝑃
𝑖
: design matrix restricted to 𝑃
𝑖
;
5: 𝑋 ← 𝑋 ∪𝑋
𝑃
𝑖
;
6: 𝑣
𝑖
= 𝑋
𝑇
𝑟
𝑖
/𝜂;
7: 𝑤
𝑖
= 𝑣
𝑖
−
𝑖−1
𝑗=1
(𝑤
𝑇
𝑗
𝑋
𝑇
𝑋𝑣
𝑖
)𝑤
𝑗
;
8: 𝑡
𝑖
= 𝑋𝑤
𝑖
;
9: 𝑟
𝑖+1
= 𝑟
𝑖
− (𝑦
𝑇
𝑡
𝑖
)𝑡
𝑖
;
3.4 LEAP: A Structural Leap Search Approach
Yan et al. [31] proposed an efficient algorithm which mines the most signif-
icant subgraph pattern with respect to an objective function. A major contri-
bution of this study is the proposal of a general approach for significant graph
pattern mining with non-monotonic objective functions. The mining strategy,
called LEAP (Descending Leap Mine), explored two new mining concepts: (1)
structural leap search, and (2) frequency-descending mining, both of which are
related to specific properties in pattern search space. The same mining strat-
egy can also be applied to searching other simpler structures such as itemsets,
sequences and trees.
Structural Leap Search. Figure 12.4 shows a search space of subgraph
patterns. If we examine the search structure horizontally, we find that the sub-
graphs along the neighbor branches likely have similar compositions and fre-
quencies, hence similar objective scores. Take the branches 𝐴 and 𝐵 as an
example. Suppose 𝐴 and 𝐵 split on a common subgraph pattern 𝑔. Branch 𝐴
Mining Graph Patterns 379
proximity
A
B
g
Figure 12.4. Structural Proximity
contains all the supergraphs of 𝑔 ⋄ 𝑒 and 𝐵 contains all the supergraphs of 𝑔
except those of 𝑔 ⋄ 𝑒. For a graph 𝑔
′
in branch B, let 𝑔
′′
= 𝑔
′
⋄ 𝑒 in branch 𝐴.
LEAP assumes each input graph is assigned either a positive or a negative
label (e.g., compounds active or inactive to a virus). One can divide the graph
dataset into two subsets: a positive set 𝐷
+
and a negative set 𝐷
−
. Let 𝑝(𝑔)
and 𝑞(𝑔) be the frequency of a graph pattern 𝑔 in positive graphs and negative
graphs. Many objective functions can be represented as a function of 𝑝 and 𝑞
for a subgraph pattern 𝑔, as 𝐹 (𝑔) = 𝑓(𝑝(𝑔), 𝑞(𝑔)).
If in a graph dataset, 𝑔 ⋄ 𝑒 and 𝑔 often occur together, then 𝑔
′′
and 𝑔
′
might
also occur together. Hence, likely 𝑝(𝑔
′′
) sim 𝑝(𝑔
′
) and 𝑞(𝑔
′′
) sim 𝑞(𝑔
′
), which
means similar objective scores. This is resulted by the structural and embed-
ding similarity between the starting structures 𝑔 ⋄𝑒 and 𝑔. We call it structural
proximity: Neighbor branches in the pattern search tree exhibit strong similar-
ity not only in pattern composition, but also in their embeddings in the graph
datasets, thus having similar frequencies and objective scores. In summary, a
conceptual claim can be drawn,
𝑔
′
sim 𝑔
′′
⇒ 𝐹 (𝑔
′
) sim 𝐹(𝑔
′′
). (3.9)
According to structural proximity, it seems reasonable to skip the whole
search branch once its nearby branch is searched, since the best scores be-
tween neighbor branches are likely similar. Here, we would like to emphasize
“likely” rather than “surely”. Based on this intuition, if the branch 𝐴 in Figure
12.4 has been searched, 𝐵 could be “leaped over” if 𝐴 and 𝐵 branches satisfy
some similarity criterion. The length of leap can be controlled by the frequency
difference of two graphs 𝑔 and 𝑔 ⋄𝑒. The leap condition is defined as follows.
Let 𝐼(𝐺, 𝑔, 𝑔 ⋄ 𝑒) be an indicator function of a graph 𝐺: 𝐼(𝐺, 𝑔, 𝑔 ⋄ 𝑒) = 1,
for any supergraph 𝑔
′
of 𝑔, if 𝑔
′
⊆ 𝐺, ∃𝑔
′′
= 𝑔
′
⋄𝑒 such that 𝑔
′′
⊆ 𝐺; otherwise
0. When 𝐼(𝐺, 𝑔, 𝑔 ⋄𝑒) = 1, it means if a supergraph 𝑔
′
of 𝑔 has an embedding
in 𝐺, there must be an embedding of 𝑔
′
⋄ 𝑒 in 𝐺. For a positive dataset 𝐷
+
,
let 𝐷
+
(𝑔, 𝑔 ⋄ 𝑒) = {𝐺∣𝐼(𝐺, 𝑔, 𝑔 ⋄ 𝑒) = 1, 𝑔 ⊆ 𝐺, 𝐺 ∈ 𝐷
+
}. In 𝐷
+
(𝑔, 𝑔 ⋄ 𝑒),
380 MANAGING AND MINING GRAPH DATA
𝑔
′
⊃ 𝑔 and 𝑔
′′
= 𝑔
′
⋄𝑒 have the same frequency. Define Δ
+
(𝑔, 𝑔⋄𝑒) as follows,
Δ
+
(𝑔, 𝑔 ⋄ 𝑒) = 𝑝(𝑔) −
∣𝐷
+
(𝑔, 𝑔 ⋄ 𝑒)∣
∣𝐷
+
∣
.
Δ
+
(𝑔, 𝑔 ⋄𝑒) is actually the maximum frequency difference that 𝑔
′
and 𝑔
′′
could
have in 𝐷
+
. If the difference is smaller than a threshold 𝜎, then leap,
2Δ
+
(𝑔, 𝑔 ⋄ 𝑒)
𝑝(𝑔 ⋄𝑒) + 𝑝(𝑔)
≤ 𝜎 and
2Δ
−
(𝑔, 𝑔 ⋄ 𝑒)
𝑞(𝑔 ⋄ 𝑒) + 𝑞(𝑔)
≤ 𝜎. (3.10)
𝜎 controls the leap length. The larger 𝜎 is, the faster the search is. Structural
leap search will generate an optimal pattern candidate and reduce the need for
thoroughly searching similar branches in the pattern search tree. Its goal is
to help program search significantly distinct branches, and limit the chance of
missing the most significant pattern.
Algorithm 17 Structural Leap Search: sLeap(𝐷, 𝜎, 𝑔
★
)
Input: Graph dataset 𝐷, difference threshold 𝜎
Output: Optimal graph pattern candidate 𝑔
★
1: 𝑆 = {1 − edge graph };
2: 𝑔
★
= ∅; 𝐹 (𝑔
★
) = −∞;
3: while 𝑆 ∕= ∅ do
4: 𝑆 = 𝑆 ∖ {𝑔};
5: if 𝑔 was examined then
6: continue;
7: if ∃𝑔 ⋄𝑒, 𝑔 ⋄ 𝑒 ≺ 𝑔,
2Δ
+
(𝑔,𝑔⋄𝑒)
𝑝(𝑔⋄𝑒)+𝑝(𝑔)
≤ 𝜎,
2Δ
−
(𝑔,𝑔⋄𝑒)
𝑞(𝑔⋄𝑒)+𝑞(𝑔 )
≤ 𝜎 then
8: continue;
9: if 𝐹 (𝑔) > 𝐹 (𝑔
★
) then
10: 𝑔
★
= 𝑔;
11: if
ˆ
𝐹 (𝑔) ≤ 𝐹 (𝑔
★
) then
12: continue;
13: 𝑆 = 𝑆 ∪ {𝑔
′
∣𝑔
′
= 𝑔 ⋄𝑒};
14: return 𝑔
★
;
Algorithm 17 outlines the pseudo code of structural leap search (sLeap).
The leap condition is tested on Lines 7-8. Note that sLeap does not guarantee
the optimality of result.
Frequency Descending Mining. Structural leap search takes advantages of
the correlation between structural similarity and significance similarity. How-
ever, it does not exploit the possible relationship between patterns’ frequency
Mining Graph Patterns 381
and patterns’ objective scores. Existing solutions have to set the frequency
threshold very low so that the optimal pattern will not be missed. Unfortu-
nately, low-frequency threshold could generate a huge set of low-significance
redundant patterns with long mining time.
Although most of objective functions are not correlated with frequency
monotonically or anti-monotonically, they are not independent of each other.
Cheng et al. [4] derived a frequency upper bound of discriminative measures
such as information gain and Fisher score, showing a relationship between fre-
quency and discriminative measures. According to this analytical result, if all
frequent subgraphs are ranked in increasing order of their frequency, significant
subgraph patterns are often in the high-end range, though their real frequency
could vary dramatically across different datasets.
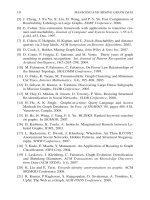
0 0.2 0.4 0.6 0.8 1
0
0.2
0.4
0.6
0.8
1
2.25
1.8
1.35
0.899
0.449
0.449
0.899
1.35
1.8
2.7
p (positive frequency)
q (negative frequency)
Figure 12.5. Frequency vs. G-test score
Figure 12.5 illustrates the relationship between frequency and G-test score
for an AIDS Anti-viral dataset [31]. It is a contour plot displaying isolines of
G-test score in two dimensions. The X axis is the frequency of a subgraph 𝑔
in the positive dataset, i.e., 𝑝(𝑔), while the Y axis is the frequency of the same
subgraph in the negative dataset, 𝑞(𝑔). The curves depict G-test score. Left
upper corner and right lower corner have the higher G-test scores. The “circle”
marks the highest G-score subgraph discovered in this dataset. As one can see,
its positive frequency is higher than most of subgraphs.
[Frequency Association]Significant patterns often fall into the high-
quantile of frequency.
To profit from frequency association, an iterative frequency-descending
mining method is proposed in [31]. Rather than performing mining with
very low frequency, the method starts the mining process with high frequency
threshold 𝜃 = 1.0, calculates an optimal pattern candidate 𝑔
★
whose frequency
is at least 𝜃, and then repeatedly lowers down 𝜃 to check whether 𝑔
★
can be
382 MANAGING AND MINING GRAPH DATA
improved further. Here, the search leaps in the frequency domain, by leveling
down the minimum frequency threshold exponentially.
Algorithm 18 Frequency-Descending Mine: fLeap(𝐷, 𝜀, 𝑔
★
)
Input: Graph dataset 𝐷, converging threshold 𝜀
Output: Optimal graph pattern candidate 𝑔
★
1: 𝜃 = 1.0;
2: 𝑔 = ∅; 𝐹(𝑔) = −∞;
3: do
4: 𝑔
★
= 𝑔;
5: 𝑔=fpmine(𝐷, 𝜃);
6: 𝜃 = 𝜃/2;
7: while (𝐹 (𝑔) − 𝐹 (𝑔
★
) ≥ 𝜀)
8: return 𝑔
★
= 𝑔;
Algorithm 18 (fLeap) outlines the frequency-descending strategy. It starts
with the highest frequency threshold, and then lowers the threshold down till
the objective score of the best graph pattern converges. Line 5 executes a
frequent subgraph mining routine, fpmine, which could be FSG [20], gSpan
[32] etc. fpmine selects the most significant graph pattern 𝑔 from the frequent
subgraphs it mined. Line 6 implements a simple frequency descending method.
Descending Leap Mine. With structural leap search and frequency-
descending mining, a general mining pipeline is built for mining significant
graph patterns in a complex graph dataset. It consists of three steps as follows.
Step 1. perform structural leap search with threshold 𝜃 = 1.0, generate an
optimal pattern candidate 𝑔
★
.
Step 2. repeat frequency-descending mining with structural leap search until
the objective score of 𝑔
★
converges.
Step 3. take the best score discovered so far; perform structural leap search
again (leap length 𝜎) without frequency threshold; output the discov-
ered pattern.
3.5 GraphSig: A Feature Representation Approach
Ranu and Singh [24] proposed GraphSig, a scalable method to mine signif-
icant (measured by p-value) subgraphs based on a feature vector representation
of graphs. The first step is to convert each graph into a set of feature vectors
where each vector represents a region within the graph. Prior probabilities of
Mining Graph Patterns 383
features are computed empirically to evaluate statistical significance of pat-
terns in the feature space. Following the analysis in the feature space, only a
small portion of the exponential search space is accessed for further analysis.
This enables the use of existing frequent subgraph mining techniques to mine
significant patterns in a scalable manner even when they are infrequent. The
major steps of GraphSig are described as follows.
Sliding Window across Graphs. As the first step, random walk with
restart (abbr. RWR) is performed on each node in a graph to simulate sliding
a window across the graph. RWR simulates the trajectory of a random walker
that starts from the target node and jumps from one node to a neighbor. Each
neighbor has an equal probability of becoming the new station of the walker.
At each jump, the feature traversed is updated which can either be an edge label
or a node label. A restart probability 𝛼 brings the walker back to the starting
node within approximately
1
𝛼
jumps. The random walk iterates till the feature
distribution converges. As a result, RWR produces a continuous distribution
of features for each node where a feature value lies in the range [0, 1], which is
further discretized into 10 bins. RWR can therefore be visualized as placing a
window at each node of a graph and capturing a feature vector representation of
the subgraph within it. A graph of 𝑚 nodes is represented by 𝑚 feature vectors.
RWR inherently takes proximity of features into account and preserves more
structural information than simply counting occurrence of features inside the
window.
Calculating P-value of A Feature Vector. To calculate p-value of a fea-
ture vector, we model the occurrence of a feature vector 𝑥
in a feature vector
space formulated by a random graph. The frequency distribution of a vector is
generated using the prior probabilities of features obtained empirically. Given
a feature vector 𝑥
= [𝑥
1
, , 𝑥
𝑛
], the probability of 𝑥 occurring in a random
feature vector 𝑦
= [𝑦
1
, , 𝑦
𝑛
] can be expressed as a joint probability
𝑃 (𝑥
) = 𝑃 (𝑦
1
≥ 𝑥
1
, , 𝑦
𝑛
≥ 𝑥
𝑛
). (3.11)
To simplify the calculation, we assume independence of the features. As a
result, Eq.(3.11) can be expressed as a product of the individual probabilities,
where
𝑃 (𝑥
) =
𝑛
∏
𝑖=1
𝑃 (𝑦
𝑖
≥ 𝑥
𝑖
). (3.12)
Once 𝑃 (𝑥
) is known, the support of 𝑥 in a database of random feature vectors
can be modeled as a binomial distribution. To illustrate, a random vector can
be viewed as a trial and 𝑥
occurring in it as “success". A database consisting
𝑚 feature vectors will involve 𝑚 trials for 𝑥
. The support of 𝑥 in the database
384 MANAGING AND MINING GRAPH DATA
is the number of successes. Therefore, the probability of 𝑥 having a support 𝜇
is
𝑃 (𝑥
; 𝜇) = 𝐶
𝜇
𝑚
𝑃 (𝑥)
𝜇
(1 −𝑃 (𝑥))
𝑚−𝜇
. (3.13)
The probability distribution function (abbr. pdf) of 𝑥
can be generated from
Eq.(3.13) by varying 𝜇 in the range [0, 𝑚]. Therefore, given an observed sup-
port 𝜇
0
of 𝑥, its p-value can be calculated by measuring the area under the pdf
in the range [𝜇
0
, 𝑚], which is
𝑝-𝑣𝑎𝑙𝑢𝑒(𝑥, 𝜇
0
) =
𝑚
∑
𝑖=𝜇
0
𝑃 (𝑥; 𝑖). (3.14)
Identifying Regions of Interest. With the conversion of graphs into feature
vectors, and a model to evaluate significance of a graph region in the feature
space, the next step is to explore how the feature vectors can be analyzed to
extract the significant regions. Based on the feature vector representation, the
presence of a “common" sub-feature vector among a set of graphs points to a
common subgraph. Similarly, the absence of a “common" sub-feature vector
indicates the non-existence of any common subgraph. Mathematically, the
floor of the feature vectors produces the “common" sub-feature vector.
Definition 12.12 (Floor of vectors). The floor of a set of vectors {𝑣
1
, , 𝑣
𝑚
}
is a vector 𝑣
𝑓
where 𝑣
𝑓
𝑖
= 𝑚𝑖𝑛(𝑣
1
𝑖
, , 𝑣
𝑚
𝑖
) for 𝑖 = 1, , 𝑛, 𝑛 is the number
of dimensions of a vector. Ceiling of a set of vectors is defined analogously.
The next step is to mine common sub-feature vectors that are also signif-
icant. Algorithm 19 presents the FVMine algorithm which explores closed
sub-vectors in a bottom-up, depth-first manner. FVMine explores all possible
common vectors satisfying the significance and support constraints.
With a model to measure the significance of a vector, and an algorithm to
mine closed significant sub-feature vectors, we integrate them to build the sig-
nificant graph mining framework. The idea is to mine significant sub-feature
vectors and use them to locate similar regions which are significant. Algorithm
20 outlines the GraphSig algorithm.
The algorithm first converts each graph into a set of feature vectors and
puts all vectors together in a single set 𝐷
′
(lines 3-4). 𝐷
′
is divided into sets,
such that 𝐷
′
𝑎
contains all vectors produced from RWR on a node labeled 𝑎.
On each set 𝐷
′
𝑎
, FVMine is performed with a user-specified support and p-
value thresholds to retrieve the set of significant sub-feature vectors (line 7).
Given that each sub-feature vector could describe a particular subgraph, the
algorithm scans the database to identify the regions where the current sub-
feature vector occurs. This involves finding all nodes labeled 𝑎 and described
by a feature vector such that the vector is a super-vector of the current sub-
feature vector 𝑣
(line 9). Then the algorithm isolates the subgraph centered
Mining Graph Patterns 385
Algorithm 19 FVMine(𝑥, 𝑆, 𝑏)
Input: Current sub-feature vector 𝑥, supporting set 𝑆 of 𝑥,
current starting position 𝑏
Output: The set of all significant sub-feature vectors 𝐴
1: if 𝑝-𝑣𝑎𝑙𝑢𝑒(𝑥
) ≤ 𝑚𝑎𝑥𝑃 𝑣𝑎𝑙𝑢𝑒 then
2: 𝐴 ← 𝐴 + 𝑥;
3: for 𝑖 = 𝑏 to 𝑚 do
4: 𝑆
′
← {𝑦∣𝑦 ∈ 𝑆, 𝑦
𝑖
> 𝑥
𝑖
};
5: if ∣𝑆
′
∣ < 𝑚𝑖𝑛 𝑠𝑢𝑝 then
6: continue;
7: 𝑥
′
= 𝑓𝑙𝑜𝑜𝑟(𝑆
′
);
8: if ∃𝑗 < 𝑖 such that 𝑥
′
𝑗
> 𝑥
𝑗
then
9: continue;
10: if 𝑝-𝑣𝑎𝑙𝑢𝑒(𝑐𝑒𝑖𝑙𝑖𝑛𝑔(𝑆
′
), ∣𝑆
′
∣) ≥ 𝑚𝑎𝑥𝑃 𝑣𝑎𝑙𝑢𝑒 then
11: continue;
12: 𝐹 𝑉 𝑀𝑖𝑛𝑒(𝑥
′
, 𝑆
′
, 𝑖);
at each node by using a user-specified radius (line 12). This produces a set
of subgraphs for each significant sub-feature vector. Next, maximal subgraph
mining is performed with a high frequency threshold since it is expected that
all of graphs in the set contain a common subgraph (line 13). The last step
also prunes out false positives where dissimilar subgraphs are grouped into a
set due to the vector representation. For the absence of a common subgraph,
when frequent subgraph mining is performed on the set, no frequent subgraph
will be produced and as a result the set is filtered out.
4. Mining Representative Orthogonal Graphs
In this section we will discuss ORIGAMI, an algorithm proposed by Hasan
et al. [10], which mines a set of 𝛼-orthogonal, 𝛽-representative graph patterns.
Intuitively, two graph patterns are 𝛼-orthogonal if their similarity is bounded
by a threshold 𝛼. A graph pattern is a 𝛽-representative of another pattern if
their similarity is at least 𝛽. The orthogonality constraint ensures that the re-
sulting pattern set has controlled redundancy. For a given 𝛼, more than one set
of graph patterns qualify as an 𝛼-orthogonal set. Besides redundancy control,
representativeness is another desired property, i.e., for every frequent graph
pattern not reported in the 𝛼-orthogonal set, we want to find a representative
of this pattern with a high similarity in the 𝛼-orthogonal set.
The set of representative orthogonal graph patterns is a compact summary of
the complete set of frequent subgraphs. Given user specified thresholds 𝛼, 𝛽 ∈
386 MANAGING AND MINING GRAPH DATA
Algorithm 20 GraphSig(𝐷, 𝑚𝑖𝑛 𝑠𝑢𝑝, 𝑚𝑎𝑥𝑃 𝑣𝑎𝑙𝑢𝑒)
Input: Graph dataset 𝐷, support threshold 𝑚𝑖𝑛 𝑠𝑢𝑝,
p-value threshold 𝑚𝑎𝑥𝑃 𝑣𝑎𝑙𝑢𝑒
Output: The set of all significant sub-feature vectors 𝐴
1: 𝐷
′
← ∅;
2: 𝐴 ← ∅;
3: for each 𝑔 ∈ 𝐷 do
4: 𝐷
′
← 𝐷
′
+ 𝑅𝑊 𝑅(𝑔);
5: for each node label 𝑎 in 𝐷 do
6: 𝐷
′
𝑎
← {𝑣∣𝑣 ∈ 𝐷
′
, 𝑙𝑎𝑏𝑒𝑙(𝑣) = 𝑎};
7: 𝑆 ← 𝐹 𝑉 𝑀𝑖𝑛𝑒(𝑓𝑙𝑜𝑜𝑟(𝐷
′
𝑎
), 𝐷
′
𝑎
, 1);
8: for each vector 𝑣
∈ 𝑆 do
9: 𝑉 ← {𝑢∣𝑢 𝑖𝑠 𝑎 𝑛𝑜𝑑𝑒 𝑜𝑓 𝑙𝑎𝑏𝑒𝑙 𝑎, 𝑣
⊆ 𝑣𝑒𝑐𝑡𝑜𝑟(𝑢)};
10: 𝐸 ← ∅;
11: for each node 𝑢 ∈ 𝑉 do
12: 𝐸 ← 𝐸 + 𝐶𝑢𝑡𝐺𝑟𝑎𝑝ℎ(𝑢, 𝑟𝑎𝑑𝑖𝑢𝑠);
13: 𝐴 ← 𝐴 + 𝑀𝑎𝑥𝑖𝑚𝑎𝑙
𝐹 𝑆𝑀 (𝐸, 𝑓 𝑟𝑒𝑞);
[0, 1], the goal is to mine an 𝛼-orthogonal, 𝛽-representative graph pattern set
that minimizes the set of unrepresented patterns.
4.1 Problem Definition
Given a collection of graphs 𝐷 and a similarity threshold 𝛼 ∈ [0, 1], a
subset of graphs ℛ ⊆ 𝐷 is 𝛼-orthogonal with respect to 𝐷 iff for any
𝐺
𝑎
, 𝐺
𝑏
∈ ℛ, 𝑠𝑖𝑚(𝐺
𝑎
, 𝐺
𝑏
) ≤ 𝛼 and for any 𝐺
𝑖
∈ 𝐷∖ℛ there exists a 𝐺
𝑗
∈ ℛ,
𝑠𝑖𝑚(𝐺
𝑖
, 𝐺
𝑗
) > 𝛼.
Given a collection of graphs 𝐷, an 𝛼-orthogonal set ℛ ⊆ 𝐷 and a simi-
larity threshold 𝛽 ∈ [0, 1], ℛ represents a graph 𝐺 ∈ 𝐷, provided that there
exists some 𝐺
𝑎
∈ ℛ, such that 𝑠𝑖𝑚(𝐺
𝑎
, 𝐺) ≥ 𝛽. Let Υ(ℛ, 𝐷) = {𝐺∣𝐺 ∈
𝐷 𝑠.𝑡. ∃𝐺
𝑎
∈ ℛ, 𝑠𝑖𝑚(𝐺
𝑎
, 𝐺) ≥ 𝛽}, then ℛ is a 𝛽-representative set for
Υ(ℛ, 𝐷).
Given 𝐷 and ℛ, the residue set of ℛ is the set of unrepresented patterns in
𝐷, denoted as △(ℛ, 𝐷) = 𝐷∖{ℛ ∪ Υ(ℛ, 𝐷)}.
The problem defined in [10] is to find the 𝛼-orthogonal, 𝛽-representative set
for the set of all maximal frequent subgraphs ℳ which minimizes the residue
set size. The mining problem can be decomposed into two subproblems of
maximal subgraph mining and orthogonal representative set generation, which
are discussed separately. Algorithm 21 shows the algorithm framework of
ORIGAMI.