Commodity Trading Advisors: Risk, Performance Analysis, and Selection Chapter 20 pot
Bạn đang xem bản rút gọn của tài liệu. Xem và tải ngay bản đầy đủ của tài liệu tại đây (126.84 KB, 9 trang )
358
CHAPTER
20
Incorporating CTAs into
the Asset Allocation Process:
A Mean-Modified Value
at Risk Framework
Maher Kooli
V
alue at risk has become a heavily used risk management tool, and an
important approach for setting capital requirements for banks. In this
study, we examine the effect of including a CTA in a traditional portfolio.
Using a mean-modified value at risk framework, we examine the case of a
Canadian pension fund and compute the optimal portfolio by minimizing the
modified value at risk at a given confidence level.
INTRODUCTION
For the individual or the institutional investor who is simultaneously
performance-oriented and risk-conscious, the key question is how best to
achieve a higher overall rate of return with acceptable risk. The answer may
be a diversified investment portfolio with some portion of the total assets
invested in alternative investments. According to a survey by Nakakubo
(2002), the alternative investment market reached $550 to $600 billion at the
end of 2001. Pension funds also are increasing the proportion of alternative
investments in their asset allocation.
For many institutional investors, alternative investments are viewed
largely as private, illiquid, alternative investments that include venture capi-
tal, leveraged buyout, distressed securities, private equity, private debt, oil and
gas programs, and timber or farmland. However, other alternative investment
vehicles, such as hedge funds and commodity trading advisors (CTAs), also
have observed a dramatic increase in investment and often provide access to
c20_gregoriou.qxd 7/27/04 12:03 PM Page 358
Incorporating CTAs into the Asset Allocation Process 359
investment not easily available from traditional stock and bond investment.
For instance, the Managed Accounts Reports (MAR) cites an increase in man-
aged futures
1
from less than $1 billion in 1980 to almost $35 billion in 1999;
hedge fund investment is now estimated to be over $300 billion. Further, Lint-
ner (1983) uses the composite performance of 15 trading advisors and show
that the return/risk ratio of a portfolio of trading advisors (or futures funds)
is higher than a well-diversified stock/bond portfolio. Furthermore, he finds a
low correlation between the returns of trading advisors and those of stocks,
bonds, or a combined stock/bond portfolio. Lintner examines the 1979 to
1982 period. Schneeweis and Spurgin (1997) show that various CTA and
hedge fund, energy-based investment provide risk and return opportunities
not available from a wide range of traditional commodity investments or real
estate investments. The Chicago Mercantile Exchange (1999) showed that for
the 1980 to 1998 period, managed futures investments (as measured by the
Barclay CTA Index) had a compound annual return of 15.8 percent. That
compares very favorably with the 17.7 percent return that common stocks
had during the same period, one of the strongest stock markets in U.S. his-
tory. Further, it exceeded the 11.8 percent return on bonds. Moreover, during
a similar period (1980 to 1997), analysis shows that a portfolio that com-
prised some managed futures had similar profitability with far less risk. Liang
(2003) finds that CTAs are good hedging instruments for hedge funds, fund
of funds, and equity markets when the others are not well hedged. This is
especially true in down markets. Schneeweis and Georgiev (2002), in exam-
ining the benefits of managed funds, show that CTAs reduce portfolio volatil-
ity risk, enhance portfolio returns in economic environments in which
traditional stock and bond investment media offer limited opportunities, and
participate in a wide variety of new financial products and markets not avail-
able in traditional investor products. However, they note that for managed
futures to grow as an investment alternative, individuals need to increase their
knowledge and comfort level regarding the use of managed futures in their
investment portfolios. For instance, there is still some confusion about the
performance of CTAs as supply has expanded. In this study we first analyze
the risk and return benefits of CTAs, as an alternative investment, using a
more precise measure of risk. Then, we show how CTAs can be integrated
into existing investment strategies and how to determine the optimal propor-
tion of assets to invest in such products.
1
The term “managed futures” describes an industry made up of professional money
managers known as commodity trading advisors. These trading advisors manage
client assets on a discretionary basis using global futures markets as an investment
medium.
c20_gregoriou.qxd 7/27/04 12:03 PM Page 359
360 PROGRAM EVALUATION, SELECTION, AND RETURNS
MEAN-MODIFIED VALUE AT RISK FRAMEWORK
Investment decisions are made to achieve an optimal risk/return trade-off
from the available opportunities. To meet this objective, the portfolio man-
ager has to identify the set of assets that are the most efficient, in the sense
of providing the lowest level of risk for a desired level of expected return,
and then to select one combination that is consistent with the risk aversion
of the investor. Mean-variance analysis has been increasingly applied to
asset allocation and is now the standard formulation of the investment deci-
sion problem. Although the principle of identifying portfolios with the
required risk and return characteristics is clear, the proper definition of risk
is vague. Risk may be defined differently according to the sensibility and the
objectives of the portfolio manager. One manager might define risk as
the probability of underperformance relative to some benchmark level of
return, while another may be more sensitive to the overall magnitude of a
loss. In a mean-variance framework, risk is defined in terms of the possible
variation of expected portfolio returns. The focus on standard deviation as
the appropriate measure for risk implies that investors weigh the probabil-
ity of negative returns equally against positive returns. However, it is highly
unlikely that the perception of investors to downside risk faced on invest-
ments is the same as the perception to the upward potential. Thus, investors
needed a more precise measure of downside risk.
With the value at risk (VaR) approach, it is possible to measure the
amount of portfolio wealth that can be lost over a given period of time with
a certain probability. VaR has become a widely used risk management tool.
The Basel Accord of 1988, for example, requires commercial banks to com-
pute VaR in setting their minimum capital requirements (see Jorion 2001).
One of the main advantages of VaR is that it works across different asset
classes such as stocks and bonds. Further, VaR often is used as an ex-post
measure to evaluate the current exposure to market risk and determine
whether this exposure should be reduced.
Our objective consists in drawing the efficient frontiers based on the
VaR framework. We also use the Cornish-Fisher (1937) expansion to
adjust the traditional VaR with the skewness and kurtosis of the return dis-
tribution, which often deviates from normality.
2
We call the VaR with the
Cornish-Fisher expansion modified VaR. Favre and Galeano (2002b) show
that risk measured only with volatility will be lower than risk measured
2
Mina and Ulmer (1999) provide four methods—Johnson transformations, Cornish-
Fisher expansion, Fourier method, partial Monte-Carlo—to compute the VaR for
nonnormally distributed assets.
c20_gregoriou.qxd 7/27/04 12:03 PM Page 360
Incorporating CTAs into the Asset Allocation Process 361
with volatility, skewness, and kurtosis. Thus, results with modified VaR will
be less biased. For details on obtaining the normal VaR, the Cornish-Fisher
expansion to VaR, and other VaR methods, see Christoffersen (2003).
CHARACTERISTICS OF CTA
Before we engage in a detailed analysis of the risk-return properties of the
CTA, a word of caution is necessary: Unlike traditional asset classes (bonds
and equity), where performance data and benchmarks are readily and reli-
ably available, the infrastructure and reliability of performance data for
alternative investments, in general, and CTAs, in particular, are still rather
underdeveloped. In this chapter, the CTA Qualified Universe index
3
(CTA
QU) is used to give an overall picture of CTA, as it is more representative
of the performance of trading advisors as a whole and cannot be criticized
as having selection bias.
The sample portfolio is made up of CTA, Canadian, U.S., and interna-
tional equities as well as domestic bonds. Canadian equities are represented
by the Standard & Poor’s (S&P)/Toronto Stock Exchange index, the CTA
by the CTA QU Index (from CISDM database), the U.S. equities asset by
the S&P 500 Index, the international equities asset by the Morgan Stanley
Capital Index for Europe, Asia, and the Far East (MSCI EAFE), and the
bonds by the Scotia McLeod universe bond index. We use monthly data
from January 1990 to February 2003.
Within the assets considered (see Table 20.1), the CTA index is less
risky than the S&P 500, the S&P/TSX, and the MSCI EAFE indices. In
addition, CTA QU index possesses a higher Sharpe ratio than equity indices,
indicating that CTAs offer superior risk-adjusted returns. These estimates
may understate true risk, so monthly modified Sharpe ratios (using VaR
instead of standard deviation) is also presented and confirms the advantage
of the CTA QU index. Using VaR and modified VaR to measure risk, the
CTAs are still less risky than equity indices. For instance, a one percent VaR
of −5.3 percent for CTA QU index means that there is a 1 percent chance
that the loss will be greater that 5.3 percent next month (or a 99 percent
chance that it will be less than 5.3 percent).
Besides very attractive risk adjusted return characteristics, one of the
most important features of CTAs is their favorable correlation structure to
traditional assets classes (see Table 20.2). By including CTAs in their port-
folios, traditional asset managers are given the opportunity to produce
more consistent returns with lower levels of risk in their global portfolio by
3
See www.cisdm.org for data and description of CTA Qualified Universe Index.
c20_gregoriou.qxd 7/27/04 12:03 PM Page 361
362 PROGRAM EVALUATION, SELECTION, AND RETURNS
means of diversification. CTA QU index has negative correlation to equity
markets (−0.19 correlation to MSCI EAFE, −0.13 correlation to the S&P
500, and −0.12 correlation to the TSX/S&P). Furthermore, CTAs demon-
strate remarkably low correlation with the bond market (0.20). Thus,
including CTAs in a diversified asset portfolio may provide additional
diversification benefits.
TABLE 20.1 Characteristics of CTA and Traditional Asset Classes, January
1990 to February 2003
Annual Annual Excess
Assets Mean Volatility Skewness Kurtosis
CTA QU Index 11.8% 10.2% 0.7 2.2
SCM Bond Index 9.8% 5.5% −0.2 0.7
S&P/TSX Index 7.3% 15.7% −0.7 2.3
S&P 500 Index 11.1% 15.2% −0.5 0.6
MSCI EAFE Index 1.9% 16.4% −0.5 0.8
Monthly Monthly Monthly
Normal Modified Sharpe Modified
Assets VaR VaR Ratio Sharp Ratio
CTA QU Index −5.9% −5.3% 0.18 0.10
SCM Bond Index −2.9% −3.4% 0.23 0.11
S&P/TSX Index −9.9% −13.9% 0.04 0.01
S&P 500 Index −9.3% −11.2% 0.11 0.04
MSCI EAFE Index −10.8% −13.1% −0.05 −0.02
TABLE 20.2 Correlations Across CTA and Traditional Asset Classes,
January 1990 to February 2003
CTA QU S&P/ S&P MSCI
Index SCM TSX 500 EAFE
CTA QU Index 1
SCM Bond Index 0.20 1
S&P/TSX −0.12 0.32 1
S&P 500 −0.13 0.26 0.75 1
MSCI EAFE −0.19 0.20 0.66 0.70 1
c20_gregoriou.qxd 7/27/04 12:03 PM Page 362
Incorporating CTAs into the Asset Allocation Process 363
INCORPORATING CTA TO THE ASSET
ALLOCATION PROCESS
In this section, we show the results obtained by applying the mean-VaR
framework explained previously. We compute the efficient frontier and the
optimal portfolio allocation for a Canadian pension fund assuming that the
portfolio manager has a VaR limit, that is, the manager does not want to
lose more than a specified amount each month, with a specified probability
(typically 1 or 5 percent).
The individual asset classes can vary within specific limits. As a result,
a relatively conservative asset allocation was chosen to match the alloca-
tions of conservative investors, pension funds, and institutions. The
weightings of individual asset classes are then changed within the permit-
ted margins to minimize the normal VaR (see Table 20.3). This first step
permits us to examine the effect of including a CTA in a traditional port-
folio. In the second step, modified VaR values are used to measure risk
more precisely.
Table 20.4 shows that CTAs take the place of U.S equities. Once the
weights of the tangent portfolios are obtained, we compute the monthly
returns that each portfolio would have yielded from January 1990 to Feb-
ruary 2003. Based on these monthly returns, we compute the average return
over the period and the modified VaR. We obtain the results shown in Table
20.5, which shows that while the average return of the portfolio with 10
percent CTA is less than the one with 0 percent CTA, the level of risk, meas-
ured with the modified VaR, is decreased by adding CTA. The modified
Sharpe ratio is also improved by adding CTA investments in the traditional
portfolio.
TABLE 20.3
Upper and Lower Limits for
Individual Asset Classes
Asset Class Minimum Maximum
Commodity
trading advisors 0% 10%
Canadian equities 10% 40%
U.S. equities 0% 30%
International
equities 0% 30%
Canadian bonds 25% 50%
c20_gregoriou.qxd 7/27/04 12:03 PM Page 363
364 PROGRAM EVALUATION, SELECTION, AND RETURNS
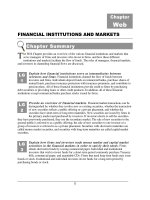
Further, Figure 20.1 shows the degree to which the sample portfolio
with a CTA portion of maximum 10 percent is represented too positively if
we do not take into account the skewness and kurtosis of the return distri-
butions—in other words, if we do not use modified VaR. It is assumed that
the investor is seeking an annual return of 7.2 percent with this sample
portfolio. Our calculation using the Cornish-Fisher expansion shows that
the investor will underestimate the risk by 14.28 percent if he or she is look-
ing to achieve this return with normal VaR.
The crucial question for an investor is whether including CTAs as an
alternative investment makes sense for his or her portfolio. To assess this,
we use both normal and modified VaR with traditional and nontraditional
portfolios (with CTA).
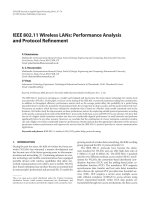
The arrows in Figure 20.2 show the shift in efficiency lines or, rather,
the positive effect on including CTA QU index in a traditional portfolio.
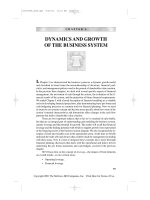
Figure 20.3 shows the added value of CTAs if skewness and kurtosis are
taken into account (by using modified VaR as a risk measurement). The two
TABLE 20.4
Portfolio Weights from Mean-VaR
Optimization
No CTA CTA Investment
Asset Class Available Limit of 10%
CTA QU Index 0% 10%
MSCI EAFE 6% 8%
S&P 500 29% 17%
SCM
Bond Index 50% 50%
S&P/TSX 15% 15%
Total 100% 100%
TABLE 20.5 Average Return, Modified VaR, and Modified Sharpe Ratio
Average Modified Modified
Return VaR Sharpe Ratio
Portfolio with 0% CTA 0.593% 5.93% 0.100
Portfolio with 10% CTA 0.581% 4.56% 0.128
c20_gregoriou.qxd 7/27/04 12:03 PM Page 364
Incorporating CTAs into the Asset Allocation Process 365
figures show the classic picture, as can be seen in a mean-variance dia-
gram. It is obvious that including CTAs with high negative skewness and
kurtosis values in a portfolio does bring a benefit in the sense of better
risk-adjusted returns.
0.45%
0.50%
0.55%
0.60%
0.65%
0.70%
0.75%
0.80%
0.85%
0.00% 1.00% 2.00% 3.00% 4.00% 5.00% 6.00% 7.00% 8.00% 9.00% 10.00%
Normal and Modified VaR
Monthly Returns
Efficient frontier with modified VaR. Efficient frontier with normal VaR.
Annual return of 7.20%
a
b
a
b
FIGURE 20.1 Pension Fund Portfolio with 10% CTA
0.40%
0.45%
0.50%
0.55%
0.60%
0.65%
0.00% 1.00% 2.00% 3.00% 4.00% 5.00% 6.00% 7.00% 8.00% 9.00%
Normal VaR
Monthly Returns
with CTA without CTA
FIGURE 20.2 Pension Fund Portfolio with and without 10% CTA
c20_gregoriou.qxd 7/27/04 12:03 PM Page 365
366 PROGRAM EVALUATION, SELECTION, AND RETURNS
CONCLUSION
Nowadays it is clear that a traditional strategy that divides investments into
asset classes is no longer sufficient. The results of this study provide impor-
tant information to the investment community about the benefits of CTAs.
We show that an efficiently allocated portfolio consisting of CTAs and tra-
ditional assets should provide a better reward/risk ratio than an investment
in traditional assets. We showed, as did Favre and Galeano (2002), that it
is possible to use modified VaR risk measure to build a portfolio composed
of traditional and alternative assets and that has the lowest probability of
losing more than the modified VaR at a defined confidence level. However,
investors must be very cautious in CTA selection. There are various CTAs
with different characteristics and strategies. These differences need to be a
major consideration, perhaps even more important than the decision of
whether to invest in the asset class itself. Finally, analysis of alternative
methods of measuring risk for alternative investments, in general, and CTA
and hedge funds, in particular, is, of course, required.
0.40%
0.45%
0.50%
0.55%
0.60%
0.65%
0.70%
0.75%
0.00% 2.00% 4.00% 6.00% 8.00% 10.00%
Modified VaR
Monthly Returns
without CTA
with CTA
FIGURE 20.3 Pension Fund Portfolio with and without 10% CTA
c20_gregoriou.qxd 7/27/04 12:03 PM Page 366