Commodity Trading Advisors: Risk, Performance Analysis, and Selection Chapter 21 pdf
Bạn đang xem bản rút gọn của tài liệu. Xem và tải ngay bản đầy đủ của tài liệu tại đây (191.67 KB, 10 trang )
367
CHAPTER
21
ARMA Modeling
of CTA Returns
Vassilios N. Karavas and L. Joe Moffitt
I
n this chapter, we extend previous attempts to model hedge fund returns
using ARMA models to the case of CTAs. We show that for the period
1996 to 2003, the return series of the largest CTAs are stationary and that
ARMA models in certain cases provide adequate representation of the
return series. Comparing to the hedge fund case, we see that a higher order
of ARMA model usually is required. We also test for structural changes in
the return processes, and we fit similar models for the period 2000 to 2003.
Results appear to be no drastically different from those reported in previ-
ous studies for hedge funds.
INTRODUCTION
The period 1996 to 2003 offered a number of surprises to investors, with
the excellent performance of the equity market during the first four years of
the period and the subsequent drawdown for three consecutive years until
2003, when the long-expected economic recovery finally appeared. Com-
modity trading advisors (CTAs) did not suffer many years of losses, and
definitely not at the magnitude of the equity markets’ losses. The CTA
indices showed that all years (included in this study) were profitable for the
CTAs with the exception of 1999, when small losses were reported. CTAs
offered investors a safe harbor for the years during which control was lost
in the equity markets. In the next section we show pieces of historical evi-
dence that CTAs were more stable over time, from a performance point of
view, not only when compared to equity markets but also when compared
to hedge funds.
Over the past few years, a large number of hedge fund managers were
dragged toward an increased equity exposure, which in several cases
c21_gregoriou.qxd 7/27/04 12:04 PM Page 367
368 PROGRAM EVALUATION, SELECTION, AND RETURNS
0%
1996 1997 1998 1999 2000 2001 2002 2003
Nasdaq Annual Return CSFB MF Annual Return CSFB Composite CSFB CA
CSFB Short Bias CSFB Em.M CSFB EMN CSFB ED
CSFB DS CSFB ED Multi CSFB MA CSFB FIA
CSFB GM CSFB L/S CSFB MF CSFB Multi
–
100%
–80%
–60%
–40%
–20%
20%
40%
60%
80%
100%
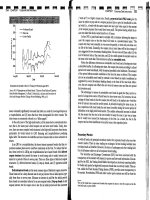
FIGURE 21.2 CTA and Hedge Fund Strategies Correlations with Nasdaq
appeared to be rather catalytic for their existence, as the expected economic
recovery, after the tech boom, did not arrive until 2003. In Figures 21.1 to
21.3, it is obvious that CTAs (as proxied by Credit Suisse First Boston Man-
aged Futures Index [CSFB MF]) have strongly resisted the downward trend
in equity markets. At the same time they have offered positive returns
except in 1999, when they suffered mild losses. Figure 21.1 shows the
annual correlation of each of the hedge fund strategies and CTAs relative to
S&P 500. It also shows how the changes in the correlation with the S&P
1996 1997 1998 1999 2000 2001 2002 2003
S&P 500 Annual Return CSFB MF Annual Return CSFB Composite CSFB CA
CSFB Short Bias CSFB Em.M CSFB EMN CSFB ED
CSFB DS CSFB ED Multi CSFB MA CSFB FIA
CSFB GM CSFB L/S CSFB MF CSFB Multi
–
100%
–80%
–60%
–40%
–20%
0%
20%
40%
60%
80%
100%
FIGURE 21.1 CTA and Hedge Fund Strategies Correlations with S&P 500
c21_gregoriou.qxd 7/27/04 12:04 PM Page 368
ARMA Modeling of CTA Returns 369
have affected the annual returns of the CSFB MF. Figures 21.2 and 21.3
show the corresponding results for Nasdaq and Lehman Aggregate Bond
Index respectively.
These historical performance comparative results indicate that CTAs
are an investment vehicle worth exploring and can offer unique risk/return
characteristics in a stock/bond portfolio as well as in a stock/bond hedge
funds portfolio. A number of studies have explored the benefits of managed
futures (CISDM 2002), so we limit the analysis of managed futures to
showing the importance of modeling their return series.
In the next section we examine whether CTAs generate stationary
return time series, and we attempt to fit auto-regressive moving average
(ARMA) models.
METHODOLOGY
We test for second-order (weak) stationarity in our return time series .
In other words, we test whether its first and second moments and its auto-
correlations are invariant in time. For comparison purposes, we carry out all
the tests that appeared in Gregoriou and Rouah (2003a) for hedge funds,
among others. However, we examine a more complete set of CTAs that sat-
isfy certain track record and assets under management requirements, as we
have included all the CTAs that report their performance in the database from
the Center for International Securities and Derivatives Markets (CISDM). We
also extend the analysis to the manager’s excess returns as a proxy for deter-
mining stationarity of manager’s alpha. We use the Augmented Dickey-Fuller
y
t
t
{}
=
∞
1
–
100%
–80%
–60%
–40%
–20%
0%
20%
40%
60%
80%
100%
1996 1997 1998 1999 2000 2001 2002 2003
Lehman Agg Annual Return CSFB MF Annual Return CSFB Composite CSFB CA
CSFB Short Bias CSFB Em.M CSFB EMN CSFB ED
CSFB DS CSFB ED Multi CSFB MA CSFB FIA
CSFB GM CSFB L/S CSFB MF CSFB Multi
FIGURE 21.3 CTA and Hedge Fund Strategies Correlations with Lehman
Aggregate
c21_gregoriou.qxd 7/27/04 12:04 PM Page 369
370 PROGRAM EVALUATION, SELECTION, AND RETURNS
(ADF) test to test for the presence of a unit root in the series. In our exam-
ples, intercept and time trend have been taken into account.
(21.1)
After we test for stationarity, we model the return series using
ARMA(p,q) processes of different orders using correlograms for each series
as a guide. Finally we perform stability tests using the Chow test to investi-
gate possible structural changes in the parameters of the specified ARMA
processes.
DATA
For this study we have chosen the 10 largest CTAs from the CISDM data-
base that have complete data series (monthly) for the period from January
1996 to December 2003. Their average assets under management were over
$100 million during the fourth quarter of 2003. For comparison purposes,
we required that the return series are complete, and we wanted to examine
CTAs with relatively long historical track records and that are of significant
size (based on the most recent information available). The effects of length
of track record as well as fund size have been extensively examined by
Schneeweis, Kazemi, and Karavas (2003a, b) for hedge funds. Although
similar analysis for CTAs, to the best of our knowledge, is not available, we
anticipate that the benefits of larger hedge funds with long track records
apply to CTAs, too. Briefly, a long track record provides evidence of man-
ager performance under different market conditions, while high assets
under management indicate that the strategy followed can be replicable at
larger scale. The latter is important especially for CTAs because of the
impact on prices due to trade of high volumes of specific futures; managers
with low assets under management impact the prices to a lesser extent.
For the calculation of the excess returns used in the tests, we calculated
the excess CTA monthly return from the CISDM Equally Weighted Trading
Advisor Qualified Universe Index (CISDM CTA). The CISDM CTA Index
is the median return of all CTAs and commodity pool operators (CPOs)
reporting to the CISDM CTA database. At the end of 2003, there existed
approximately 600 CTAs and CPOs each having approximately an equal
share in the database.
The CTA returns, as well the returns of the CSFB/Tremont and CISDM
indices, used in this analysis have not been adjusted to eliminate biases inher-
∆∆yty y
ttitit
i
N
=+ +− + +
−−
=
∑
µλ γ ϕ ε
()1
1
1
c21_gregoriou.qxd 7/27/04 12:04 PM Page 370
ARMA Modeling of CTA Returns 371
ent in them. A description of potential biases in the indices, some of which
apply to the databases as well, can be found in Karavas and Siokos (2004).
The following tables provide descriptive statistics for the data set used
in the simulations as well as for the corresponding excess returns. As we see
in Table 21.1, CTAs offer a wide range of performance characteristics. It is
noteworthy to see that the risk-adjusted return as proxied by the informa-
tion ratio varies significantly relative to the information ratio of the CISDM
CTA index. This means that across the 10 largest CTAs in existence for at
least eight years, the majority of them offer returns that are not justified for
the amount of risk they undertake (see Table 21.2). Information ratios in
bold denote values below the information ratio of the CISDM CTA index.
RESULTS
The ADF tests showed that for all CTAs included in this study, the error terms
were white noise; thus all series were stationary. With the exception of one
CTA (#3), we could reject the null hypothesis of unit root for all CTAs at 99
percent confidence level (#3: at 90 percent). All the ADF tests were run for
four lags; the results are shown in Table 21.3. Similar tests were performed
on CTAs’ excess returns and are shown in Table 21.4. The results using CTA
returns were consistent with those in Gregoriou and Rouah (2003a) for hedge
funds. Those authors did not examine excess returns, however, this study
shows that the added alpha relative to the strategy (as proxied by the CISDM
CTA index) for the 10 largest funds is indeed stationary.
Using the correlograms, we determined that in several cases the auto-
correlations did not fade after the first lag, so more lags needed to be
included in the models. As we see in Table 21.3, the CTA returns studied
carry the effect of previous months return levels. The table shows the dif-
ferent orders of ARMA models that have been utilized to better represent
the corresponding return series. In certain cases (CTA: 2, 5, 10) the repre-
sentation is adequate, evidenced by relatively high R
2
values and significant
coefficients. For CTA #9, although there is a relatively high R
2
, the MA
process is noninvertible. For CTA #3, although we have not rejected the
existence of unit root at 95 percent, we have used an ARMA (2,2) model
with a low R
2
. We note that CTAs #2 and #3 are the only ones that are low
negatively correlated with the CTA Index.
Table 21.4 presents similar results to Table 21.3 using excess returns.
The benefit of studying CTAs’ excess returns is it allows us to see whether
and how individual CTAs outperform the strategy to which they belong. It
is rather useful when managers of specific strategies are evaluated for inclu-
c21_gregoriou.qxd 7/27/04 12:04 PM Page 371
TABLE 21.1 Statistics for the 10 Largest CTAs, January 1996 to December 2003
Correlation AUM
b
in
Annualized Information Monthly Monthly % of % of with millions
Annualized Rate of Standard Min Max Profitable Non-profitable CISDM (USD)
Return Deviation Ratio
a
Return Return Months Months CTA Q3-03
CTA1 17.04% 14.47% 1.18 −9.62% 12.22% 65% 35% 0.81 $4,523
CTA2 5.92% 5.98% 0.99 −5.50% 9.65% 68% 32% −0.12 $2,103
CTA3 15.73% 14.77% 1.07 −11.97% 9.44% 63% 38% −0.11 $1,463
CTA4 8.60% 6.00% 1.43 −2.29% 10.39% 69% 31% 0.05 $1,385
CTA5 12.79% 10.32% 1.24 −4.49% 9.48% 58% 42% 0.54 $1.192
CTA6 16.58% 12.58% 1.32 −7.95% 16.50% 58% 42% 0.78 $1,134
CTA7 15.35% 13.84% 1.11 −10.33% 9.54% 60% 40% 0.83 $ 950
CTA8 11.20% 14.42% 0.78 −9.68% 11.01% 56% 44% 0.79 $ 890
CTA9 20.87% 15.53% 1.34 −6.99% 14.36% 61% 39% 0.75 $ 839
CTA10 11.22% 15.11% 0.74 −8.03% 12.23% 55% 45% 0.52 $ 821
CISDM 9.60% 9.26% 1.04 −4.45% 7.80% 59% 41% 1.00
a
CTA information ratios that are lower than the CISDM CTA index information ratio are in bold.
b
Assets under management.
372
c21_gregoriou.qxd 7/27/04 12:04 PM Page 372
ARMA Modeling of CTA Returns 373
sion in portfolios of CTAs (CPOs) or in portfolio of mixed strategies and
the objective is to maximize alpha.
Table 21.2 shows that CTA #2 has underperformed the CISDM CTA
Index, but Table 21.4 shows its series (excess returns) appears to be sta-
tionary. Excess returns of CTA #9 and #10 are adequately represented by
the ARMA models shown in Table 21.4, as evidenced by high R
2
and sig-
nificant coefficients. Both CTAs have outperformed the CISDM CTA Index,
but they were the most volatile of the 10 CTAs and the index.
We then performed a stability test on the ARMA model parameters to
investigate possible structural changes. For this purpose we utilized the
Chow test before and after January 2000. The justification for this break-
point is that 1999 was a very profitable year for the equity indices; CTAs
did not perform as well afterward.
Chow test statistics appear in Table 21.3. The F-statistics for three
CTAs are relatively high, indicating structural changes. For CTA #9, we did
not test for structural changes as the MA process was noninvertible, and the
model did not fit better even for the period 2000 to 2003.
For the three CTAs with relatively high F-statistics, we fitted the corre-
sponding ARMA models for the period 2000 to 2003. As shown in Table 21.5,
TABLE 21.2
Statistics for the Excess Returns of the 10 Largest CTAs, January
1996 to December 2003
% of % of
Months Months
with with
Annualized Annualized Monthly Monthly Positive Negative
Excess Standard Min Max Excess Excess
Return Deviation Return Return Return Return
CTA1 7.07% 8.90% −5.42% 8.25% 60% 40%
CTA2 −4.26% 11.60% −8.71% 11.28% 49% 51%
CTA3 4.58% 18.30% −12.73% 11.08% 59% 41%
CTA4 −1.73% 10.79% −9.26% 7.81% 50% 50%
CTA5 2.59% 9.43% −5.59% 6.86% 60% 40%
CTA6 6.46% 7.83% −4.04% 9.29% 57% 43%
CTA7 5.51% 8.01% −5.96% 5.96% 55% 45%
CTA8 1.66% 9.10% −6.96% 6.43% 52% 48%
CTA9 10.59% 10.54% −4.59% 10.98% 59% 41%
CTA10 1.34% 13.01% −12.43% 12.21% 48% 52%
c21_gregoriou.qxd 7/27/04 12:04 PM Page 373
374
TABLE 21.3 CTA Returns: ARMA Models
Chow
ADF AR(1) AR(2) AR(3) AR(4) MA(1) MA(2) MA(3) F-Stat
Tests MA1 A2 A3 A4 B1 B2 B3 R
2
p-value
CTA1
−5.6629
0.0144 −0.4447 −0.8778 0.4511 0.9799
0.04
1.49
CTA1: p-value 0.0006 0.0000 0.0000 0.0000 0.0000 0.20
CTA2
−5.6161
0.0015 −0.5618 −0.5106 0.7482 0.6638 −0.6249 −0.9581
0.31
1.40
CTA2: p-value 0.2288 0.0000 0.0000 0.0000 0.0000 0.0000 0.0000 0.22
CTA3
−3.4275
0.0141 1.1231 −0.7910 −1.1684 0.9799
0.06
2.25
CTA3: p-value 0.0055 0.0000 0.0000 0.0000 0.0000 0.06
CTA4
−5.7926
0.0065 −0.8322 −0.1493 −0.8378
0.03
3.95
CTA4: p-value 0.0000 0.0000 0.1632 0.0000 0.01
CTA5
−4.9350
0.0096 −0.4473 −0.9215 0.5598 1.0430 0.1529
0.15
0.23
CTA5: p-value 0.0034 −0.0000 −0.0000 0.0000 0.0000 0.0000 0.97
CTA6
−4.9529
0.0138 −0.9249 0.9801
0.01
1.95
CTA6: p-value 0.0005 0.0000 0.0000 0.13
CTA7
−4.7019
0.0111 −0.8566 0.9740
0.03
0.53
CTA7: p-value 0.0000 0.0000 0.0000 0.66
CTA8
−5.4682
0.0097 0.9402 −0.1479 −0.9814
0.06
2.21
CTA8: p-value 0.0000 0.0000 0.1546 0.0000 0.07
CTA9
−5.1140
0.0160 −0.8977 −1.1274
0.20
CTA9: p-value 0.0003 0.0000 0.0000
CTA10
−4.5596
0.0098 −1.5509 −1.3294 −0.5811 −0.2769 1.3508 0.9344
0.15
0.34
CTA10: p-value 0.0006 0.0000 0.0000 0.0022 0.0039 0.0000 0.0000 0.93
All ADF tests are at 99 percent confidence level. CTA3 rejects hypothesis of unit root at 90 percent.
c21_gregoriou.qxd 7/27/04 12:04 PM Page 374
TABLE 21.4 CTA Excess Returns: ARMA Models
ADF AR(1) AR(2) AR(3) AR(4) MA(1) MA(2) MA(3) MA(4)
Tests MA1 A2 A3 A4 B1 B2 B3 B4 R
2
CTA Exc1
−4.7461
0.0059 −0.7203 0.7109
0.01
CTA Exc1: p-value 0.0259 0.0191 0.0262
CTA Exc2
−5.3094
−0.0043 −0.7132 −0.8592
0.07
CTA Exc2: p-value 0.0178 0.0000 0.0000
CTA Exc3
−4.3574
0.0051 −0.5293 −0.7877 0.5947 0.9800
0.12
CTA Exc3: p-value 0.3588 0.0000 0.0000 0.0000 0.0000
CTA Exc4
−5.3569
−0.0012 −0.3677 −0.8945 −0.4187 0.9617
0.03
CTA Exc4: p-value 0.7033 0.0000 0.0000 0.0000 0.0000
CTA Exc5
−4.1900
0.0025 1.0716 −0.7539 −1.2220 0.9638
0.07
CTA Exc5: p-value 0.3855 0.0000 0.0000 0.0000 0.0000
CTA Exc6
−4.2616
0.0046 −0.5997 −0.4724 −0.7067 0.5722 0.5721 0.9661
0.11
CTA Exc6: p-value 0.0473 0.0000 0.0000 0.0000 0.0000 0.0000 0.0000
CTA Exc7
−4.8709
0.0051 −0.7890 −0.5644 −0.8271 0.6983
0.01
CTA Exc7: p-value 0.0572 0.0039 0.0376 0.0009 0.0053
CTA Exc8
−5.1742
0.0014 −0.4560 0.5768
0.00
CTA Exc8: p-value 0.6276 0.1771 0.0706
CTA Exc9
−3.9901
0.0100 0.5498 0.9293 0.1356 −0.6643 −0.4929 − 1.0160 −0.4115 0.9248
0.16
CTA Exc9: p-value 0.0000 0.0000 0.0000 0.2974 0.0000 0.0000 0.0000 0.0000 0.0000
CTA Exc10
−6.7692
0.0016 0.7768 −0.5202 −1.1091 0.3889
0.20
CTA Exc10: p-value 0.2435 0.0000 0.0004 0.0000 0.0300
All ADF tests are at 99 percent confidence level. CTA9 rejects hypothesis of unit root at 95 percent.
375
c21_gregoriou.qxd 7/27/04 12:04 PM Page 375
376 PROGRAM EVALUATION, SELECTION, AND RETURNS
there is a significant improvement for CTA #3 and #8 (evidenced by the
increased R
2
). For CTA #4, ARMA (1,1) (results not shown) appear to bet-
ter model the return series during 2000 to 2003 than the ARMA (2,1)
model utilized for 1996 to 2003 and 2000 to 2003.
CONCLUSION
In this study, we investigated the return series behavior of the 10 largest
CTAs in the CISDM database and utilized a number of ARMA models.
Results showed that the series are in general stationary (using ADF tests),
as are the excess returns of the same CTAs relative to the CISDM CTA
Index. ARMA models for the largest CTAs tended to be of higher orders
than those in the case of hedge funds (Gregoriou and Rouah 2003b). In
spite of the significant parameters in most cases, very few of these CTA
models were accompanied by substantial R
2
. Unfortunately, this implies
that the models have little forecasting power. A few indicated possible struc-
tural changes, evidenced by Chow tests. For two CTAs the same models
offered a better representation for the period after the breakpoint (January
2000), while for the third CTA a different ARMA model appears to offer
better results.
TABLE 21.5 CTA Returns, 2000 to 2003: ARMA Models
AR(1) AR(2) MA(1) MA(2)
MA1 A2 A1 A2 R
2
CTA3 0.0123 −0.8042 −0.6546 0.9994 0.9800
0.16
CTA3: p-value 0.0895 0.0000 0.0000 0.0000 0.0000
CTA4 0.0050 −0.5734 0.0956 0.8731
0.04
CTA4: p-value 0.0288 0.0126 0.5748 0.0000
CTA8 0.0120 −0.7018 −0.1482 0.9529
0.09
CTA8: p-value 0.0831 0.0000 0.3521 0.0000
c21_gregoriou.qxd 7/27/04 12:04 PM Page 376