Encyclopedia of Global Resources part 18 ppt
Bạn đang xem bản rút gọn của tài liệu. Xem và tải ngay bản đầy đủ của tài liệu tại đây (160.49 KB, 10 trang )
Rice is produced on about 3 million hectares,
though the 11 million metric tons produced aremainly
consumed within Brazil. Similarly, the 3.9 million
metric tons of cotton grown on 1.1 million hectares of
land support Brazil’s significant textile industry. In
2005, approval was given for cotton farmers to use ge-
netically modified strains. Brazil is one of the top-ten
producers of textiles.
Two other major Brazilian exports include coffee
and orange juice. In 2007, coffee was grown on 2.3
million hectares, mainly in the states of São Paulo and
Minas Gerais, with a production of 2.2 million metric
tons. Oranges were cultivated on 0.8 million hectare,
mostly in the state of São Paulo, from which 18.2 mil-
lion metric tons were produced. Brazil is the world’s
largest producer of coffee and is responsible for about
one-third of world production. It is also a leading
exporter, mainly to the United States and Europe;
in 2007, exports comprised twenty-eight million 60-
kilogram bags, which earned$3.4billion.Brazilisalso
the world’s biggest producer of orange juice; produc-
tion in 2005 amounted to 1.4 million metric tons out
of a world total of 2.4 million metric tons. Only about
2 percent is consumed internally, while the other 98
percent is exported.
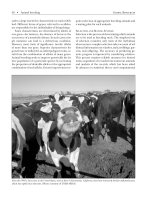
Cattle meat (notably beef and veal), pork, and
chickens/chicken meat are important components
of Brazil’s agriculture and export earnings. Cattle
ranches are prevalent in the west-central region,
though ranching has expanded north, and illegal
grazing is now a major cause of Amazon deforesta-
tion. Brazil has the largest cattle industry in the world,
with more than 200 million head of cattle. It is also a
leading exporterof beef, mainly to Europe and Chile,
with exports amounting to 80 million metric tons per
month, and the industry continues to expand. Pig
rearing is also important in Brazil’s agricultural sec-
tor, with about 34 million head. The three southern
140 • Brazil Global Resources
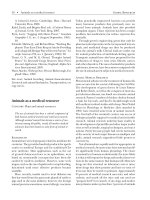
The Brazilian Amazon jungle is a source of numerous natural resources but has suffered from major deforestation. (©Paura/Dreams
-
time.com)
states dominate production, but pig rearing has spread
to the center-west region, especially in the state of
Mato Grosso. Russia and Eastern Europe constitute
the major overseas markets; domestic demand is also
high. Chicken meat is another significant export, no-
tably to Asia. In 2007,Brazilhadalmost1billionchick-
ens and is second to the United States as an exporter
of chicken meat. The value of its exports was $5 billion
in 2007. It produces 12 million metric tons annually.
Wood and Wood Products
As well as being home to the world’s largest extent of
tropical forest in the Amazon basin, Brazil has 6.2 mil-
lion hectares of plantation forests, comprising fast-
growing pine and eucalyptus. These were planted
mainly between 1967 and 1987, a process stimulated
by tax incentives, as some 70 percent of the land used
is publicly owned. The plantations produce all of
Brazil’s pulp and paper, which generated about $3 bil-
lion, or 40 percent of the total GDP earned by the for-
est sector. Most sawn wood is produced from natural
forests, of which Brazil has lost an area the size of
France.
A conflict of interestbetweenconservationandfor-
estry has arisen, especially in relation to the serious
problem of illegal felling. Approximately 30 percent
of the Amazon forest has protected status, and most
wood is removed from the 25 percent that is privately
owned. Prior to extraction, landowners must have a
management plan and a permit from Brazil’s environ-
ment agency. Only 5 percent of wood is approved
by the international Forest Stewardship Council. Am-
azonian forests, especially those in the states of Pará,
Mato Grosso, and Rondônia, generate more timber
than any other forests in the world. Most of this
wood is used within Brazil itself. Many other forest
products are significant resources, including char-
coal, fuelwood, nuts, fruits, oil plants, and rubber.
Other Resources
Brazil produces a range of precious and semiprecious
stones, including diamond, emerald, topaz, tourma-
line, beryl, and amethyst. These come mainly from
the states of Minas Gerais, Rio Grande do Sul, Bahia,
Goiás, Pará, Tocantins, Paraíba, and Piauí. Both raw
and cut stones are exported, especially to the United
States, and they also support an internal jewelry in-
dustry.
Brazil is a significant producer of graphite, mag
-
nesite, and potash and has abundant sand and gravel
deposits. It has almost 30 percent of the world’s graph
-
ite reserves, which are widely distributed. The richest
deposits are in Minas Gerais, Ceará, and Bahia. About
22 percent is exported, and the remainder is used do-
mestically in the steel industry and for battery produc-
tion. Reserves of magnesite are also extensive, rank-
ing Brazil fourth in the world. The deposits occur in
the Serra das Éguas, in the state of Bahia. About 30
percent is exported and 70 percent is used in a variety
of Brazil’s industries, especially steel manufacture. In
2005, some 403 metric tons of potash were produced
from Sergipe and Amazonas, where deposits of sil-
vinite are located. This makes Brazil the world’s ninth
largest producer, though it continues to import most
of its potassium fertilizer. Phosphate deposits also sup-
ply fertilizer, and in 2006, Brazil’s production com-
prised almost 6 million metric tons, making it the
twelfth largest producer in the world. It contributes
substantially to crop production, as Brazil is the world’s
fourth largest consumer of fertilizers, and is also used
for manufacturing detergents.
A. M. Mannion
Further Reading
Brazilian Development Bank and Center for Strategic
Studies and Management Science, Technology, and
Innovation. Sugarcane Bioethanol: Energy for Sustain-
able Development. Rio de Janeiro: Author, 2008.
Goulding, Michael, Ronaldo Barthem, and Efrem
Jorge Gondim Ferreira. Smithsonian Atlas of the Am-
azon. Washington,D.C.:SmithsonianBooks,2003.
Lusty, Paul. South America Mineral Production, 1997-
2006: A Product of the World Mineral Statistics Data-
base. Nottingham, Nottinghamshire, England: Brit-
ish Geological Survey, 2008.
Web Sites
Energy Information Administration
Country Analysis Briefs: Brazil
/>Oil.html
Infomine
Brazil: Great Potential
/>InternationalMining/IMMay2006a.pdf
See also: Agricultural products; Agriculture indus
-
try; Biofuels; Ethanol; Timber industry.
Global Resources Brazil • 141
Brick
Category: Products from resources
Brick as a building material has a long history. Its
qualities of durability and ease of manufacture—as
well as the fact that suitable clay is widely available—
have made it desirable.
Definition
Brick has been used as a building material since be-
fore the advent of written history. Bricks are durable,
fireproof, and decorative. They also have high heat-
and sound-insulating qualities. The clay from which
bricks may be made is widespread on the Earth’s sur-
face. Clay can be used directly if it is relatively free of
impurities. In such cases the clay is formed,dried,and
fired. Clays that are suitable but contain some unde-
sirable elements, such as roots or pebbles, can be re-
fined through removal of the unwanted material.
Overview
Clay resources for brick making are usually mined by
open-pit or strip mining. In small mining operations,
hand labor may serve to remove the overlying earth
material (overburden). In larger operations, a combi-
nation of mechanical devices is used. Graders and
drag lines may be used to remove the overburden and
expose the clay. Once the clay has been removed, it is
ready for preparation.
The complexity of clay preparation depends on
the quality of the clay. Primary preparation involves
crushingtherawmaterial,removingstones,andblend-
ing different clays if desired. Secondary preparation
grinds the crushed lumps to the desired fineness. At
this stage, more blending may occur; storage of the
milled clay follows.
The manufacture of bricks begins when the pro-
cessed clay is moistened enough to permit formation
of bricks. In some instances hand molding is used; in
other cases the brick material may be extruded and
cut into lengths of the desired size. Once the bricks
have been produced, they must be dried prior to fir-
ing. The preliminary drying is necessary to reducethe
water content, because too much water could cause
problems resulting from expansion during the firing
process. Drying is done by placing the bricks either in
a protected place to allow natural drying or in an arti
-
ficially heated dryer.
Following the drying process, the bricks are ready
for firing. Firing removes the remaining moisture from
the bricks and, as the intensity of the heating increases,
renders the brick stable and able to resist weathering.
The firing itself can be done in the open, with the fuel
and prepared bricks intermixed. More controlled fir-
ing takes place with the use of kilns, in which the firing
occurs under closed, controlled conditions. Follow-
ing firing, the bricks are allowed to cool slowly to pre-
vent damage and are then ready for use.
Jerry E. Green
See also: Cement and concrete; Clays; Open-pit min-
ing; Strip mining.
Bromine
Category: Mineral and other nonliving resources
Where Found
Bromine is widely distributed in small quantities in
the Earth’s crust. The oceans contain most of the
world’s bromine, and it is also found in inland evap-
oritic (salt) lakes. Recoveredfromundergroundbrines
in Arkansas, bromine became that state’s most impor-
tant mineral commodity and made the United States
the producer of one-third of the world’s bromine. In
descending order, Israel, China, Jordan, and Japan
account for most of the balance.
Primary Uses
The use of bromine in flame retardants is a quickly
expanding industry. Bromine is also used in agricul-
tural applications, water treatment and sanitizing,
petroleum additives, well-drilling fluids, dyes, photo-
graphic compounds, and pharmaceuticals.
Technical Definition
Bromine (abbreviated Br), atomic number 35, be-
longs to Group VII (the halogens) of the periodic ta-
ble of the elements and resembles chlorine and io-
dine in its chemical properties. It has two naturally
occurring isotopes: bromine 79 (50.69 percent) and
bromine 81 (49.31 percent). Bromine is the only non-
metal that is liquid at roomtemperature.Avolatileliq-
uid, it is deep red in color with a density of 3.14 grams
per cubic centimeter,afreezingpointof−7.3°Celsius,
and a boiling point of 58.8° Celsius. A diatomic ele
-
142 • Brick Global Resources
ment, bromine exists as paired bromine atoms in its
elemental form.
Description, Distribution, and Forms
Bromine has an abundance of 2.5 parts per million in
the Earth’s crust, ranking it forty-sixth in order of
abundance of the elements. It is more prevalent in the
oceans, at 65 parts per million. In salt lakes such as the
Dead Sea, at 4,000 parts per million, and Searles Lake
in California, at 85 parts per million, bromine is more
abundant than in the oceans. The most concentrated
sources of bromine are brine wells; one in Arkansas
has 5,000 parts per million.
As a halogen, bromine needs one electron to
achieve filled “s” (sharp) and “p” (principal) shells.
Thus, bromine exists in nature as a bromide ion with a
negative 1 charge. High concentrations of bromine in
plants have not been noted. However, marine plants
do have a relatively higher concentration than land
plants.
Bromine, along with chlorine, tops the list of ele
-
ments suspected of causing ozone depletion in the
stratosphere. Because of this, the Environmental Pro-
tection Agency has listed methyl bromide and hy-
drobromofluorocarbons as a class I ozone-depleting
substances. This classification means a limit to the
productionofthesecompoundsintheUnitedStates.
Because availability has become more common be-
cause of pesticides and gasoline additives, the human
intake of bromine has increased. There have not been
toxicity problems, however, as bromine is retained for
only short periods before it is excreted in urine. Plant
and animals alike show little toxic reaction to bro-
mine.
History
Antoine-Jérôme Balard first established bromine as
an element. He had extracted bromine from brine by
saturating it with chlorine and distilling. When at-
tempts to decompose the new substance failed, he
Global Resources Bromine • 143
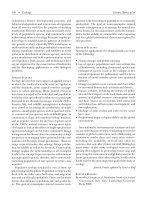
Data from the U.S. Geological Survey, . U.S. Government Printing Office, 2009.Source: Mineral Commodity Summaries, 2009
2,000
135,000
1,600
1,500
165,000
20,000
70,000
3,000
Withheld
Metric Tons of Bromine Content
175,000150,000125,000100,00075,00050,00025,000
Ukraine
Israel
India
Germany
China
Azerbaijan
Japan
Jordan
United States
U.S. data were withheld to avoid disclosure of company proprietary data.Note:
World Bromine Production, 2008
correctly deduced that bromine was an element and
published his results in 1826. Balard wanted to call the
new element “muride,” but the French Academy did
not like the name. Bromine, from the Greek bromos,
for stink or bad odor, was chosen instead. The first
mineral of bromine found was bromyrite (silver bro-
mide), found in Mexico in 1941. Silver bromide was
used as the light-sensitive material in early photo-
graphic emulsions from about 1840, and potassium
bromide began to be used in 1857 as a sedative and an
anticonvulsant. The purple pigment known as Tyrian
purple and referred to in Ezekiel in the Old Testa-
ment of the Bible is a bromine compound. Originally
the dye was obtained from the small purple snail
Murex brandaris.
Obtaining Bromine
Acidified solutions of bromine (either brines or sea-
water) are pumped into the top of a ceramic-filled
tower. As the solution falls through the tower, the bro-
mine reacts with chlorine. The chlorine becomes
chloride ions dissolved in solution. The bromide ions
in solution become bromine molecules. The bromine
is then steamed out (collected in steam) or blown out
(collected in air) by the steam or air passing through
the tower. The bromine condenses and is separated
from the gases at the top of the tower. It then can be
purified or reacted with other substances to form bro-
mine compounds. In Israel, the brine comes from the
production of chemicals such as sodium chloride or
potash and contains about 14,000 parts per million.
Yearlyworldproductionofbrominein2008wasabout
400,000 metric tons (excluding U.S. production).
Uses of Bromine
Flame retardants use the highest percentage of the
bromine produced, about 45. These products are
used in circuit boards, television cabinets, wire, cable,
textile coverings, wood treatments, fabric treatments,
polyurethane foam insulation, and polyester resins.
Bromine compounds are used in portable fire
extinguishers as well as in closed spaces such as com-
puter rooms. Use of bromine in agriculture as pesti-
cides such as ethylene bromide, dibromochloropro-
pane, or methyl bromide accounts for 10 percent of
the total produced. Methyl bromide is a very effec-
tive nematocide (worm killer) as well as herbicide, fun-
gicide, and insecticide. Bromine is also used in treating
water and sanitizing water equipment such as swim
-
ming pools, hot tubs, water cooling towers, and food
washing appliances. Bromine is more efficient than
other materials becauseithasahigherbiocidalactivity.
In the 1970’s, the principal use of bromine was
in ethylene dibromide, a scavenger for lead. With the
decreased use of leaded gasoline, less ethylene
dibromide is needed. High-density drilling fluids made
with bromine compounds accountforanother20per-
cent. Dyes and photography usage account for 5 per-
cent. Silver bromide is still the main light-sensitive
compound used in film. The pharmaceutical industry
uses about 4 percent of the bromine produced. Be-
cause bromine is very reactive, forming compounds
with every group except the noble gases, new uses for
bromine will undoubtedly be found.
C. Alton Hassell
Further Reading
Greenwood, N. N., and A. Earnshaw. “The Halogens:
Fluorine, Chloride, Bromine, Iodine, and Asta-
tine.” In Chemistry of the Elements. 2d ed. Boston:
Butterworth-Heinemann, 1997.
Henderson, William. “The Group 17 (Halogen) Ele-
ments: Fluorine, Chlorine, Bromine, Iodine, and
Astatine.” In Main Group Chemistry. Cambridge, En-
gland: Royal Society of Chemistry, 2000.
Jacobson, Mark Z. “Effects of Bromine on Global
Ozone Reduction.” In Atmospheric Pollution: History,
Science, and Regulation. New York: Cambridge Uni-
versity Press, 2002.
Kogel, Jessica Elzea, et al., eds. “Bromine.” In Indus-
trial Minerals and Rocks: Commodities, Markets, and
Uses. 7th ed. Littleton, Colo.: Society for Mining,
Metallurgy, and Exploration, 2006.
Krebs, Robert E. The History and Use of Our Earth’s
Chemical Elements: A Reference Guide. Illustrations by
Rae Déjur. 2d ed. Westport, Conn.: Greenwood
Press, 2006.
Massey, A. G. “Group 17: The Halogens: Fluorine,
Chlorine, Bromine, Iodine, and Astatine.” In Main
Group Chemistry. 2d ed. New York: Wiley, 2000.
Weeks, Mary Elvira. Discovery of the Elements: Collected
Reprints of a Series of Articles Published in the “Journal
of Chemical Education.” Kila,Mont.:Kessinger,2003.
Web Site
U.S. Geological Survey
Bromine: Statistics and Information
/>commodity/bromine/index.html#myb
144 • Bromine Global Resources
See also: Agriculture industry; Air pollution and air
pollution control; Atmosphere; Clean Air Act; Envi-
ronmental Protection Agency; Herbicides; Oceans;
Ozone layer and ozone hole debate; Pesticides and
pest control.
Bronze
Category: Products from resources
Bronze is a term applied to a variety of alloys that con-
tain copper; the oldest of these, which was the first me-
tallic alloy produced, is an alloy of copper and tin.
Other alloying elements include tin, nickel, phospho-
rus, zinc, and lead.
Background
A variety of related alloys are called bronze. The one
with the longest history is an alloy composed primar-
ily of copper, with a smaller percentage of tin. Various
forms of bronze have been smelted for thousands of
years; in fact, bronze was the first true metallic alloy
developed. Bronze replaced the use of copper as the
material of choice for tools, weapons, jewelry, and
other items in the ancient Near East and other early
centers of civilization. Although eventually it was
largely replaced by iron and finally by various steel al-
loys, bronze still is employed extensively for a variety
of industrial uses worldwide.
History
The first metal used by ancient metallurgists was cop-
per, because surface deposits of this metallic element
in its native, or naturally pure, form were once rela-
tively plentiful in certain areas. However, objects pro-
duced from pure or nearly pure copper possess sev-
eral drawbacks, chief among them are softness and
lack of resistance to damage. Archaeological finds
from the Near East dating back at least to around 3000
b.c.e. indicate that early metalworkers discovered that
by adding other metals in small percentages, they
could produce a new, stronger metal that also boasted
several other favorable characteristics: a lower melt-
ing point (950° Celsius instead of the 1,084° Celsius
required for copper), greater ease of flowage into
molds in the casting process, and elimination of the
troublesome bubbles that plagued the casting of pure
copper.
Through experimentation, early metallurgists dis
-
covered that the ideal metal proportions for bronze
were about 10 percent tin and 90 percent copper. The
invention of bronze led to a veritable explosion of
metal-casting industries that produced elaborate and
intricate bronze artifacts and ushered in a period of
flourishing mining and trading networks linking far-
flung areas for bronze production. Some bronze-
producing centers, such as sites in ancient China, ex-
perimented with bronzeusingotheradmixtures,such
as lead. Eventually, with the development of hotter
smelting furnaces and other techniques, bronze was
replaced for most of its applications by a still harder
metal, iron, and then by the various alloys of steel.
Various bronze alloys, however, have always been
employed for some uses even while other metals be-
came the primary choice for most metal applications.
Statuary made from bronze, for example, has always
enjoyed popularity. In addition, the modern industrial
world uses various types of bronze for cast products
such as pumps, gears, nuts, tubes, rods, and machine
or motor bearings. Modern bronze alloys typically do
not have a tin content in excess of 12 percent, as per-
centages above that ratio produce alloys with declin-
ing ductility (the capaciity for being easily shaped or
molded), and they tend to become very brittle.
Specialized Bronzes
Some specialized modernbronze alloys are produced
with small percentages of lead, nickel, phosphorus,
zinc, and even aluminum. Copper-tin-lead bronzes,
for example, are used for machine bearings that must
withstand both a heavy load and frictional heat. The
lead is added to produce a desired degree of elasticity.
A bronze combining copper, tin, and phosphorus is
smelted with a percentage of phosphorus in the range
of 0.1 to 0.5 percent. The phosphorus in this alloy al-
lows the molten metal to flow more freely and makes
casting easier. It also helps deoxidize the melt during
the smelting process and produces a bronze with
great resistance to wear.Phosphor bronzes,asthey are
termed, are used in machine gear wheels, an applica-
tion where hardness and wear resistance are desired.
Another type of bronze that is similarly employed is
zinc bronze. The zinc typically makes up 2 to 6 per-
cent of the alloy, which also includes copper and tin.
Another term for zinc bronze is “gunmetal” bronze,
and if the alloy has the specific formula 88 percent
copper, 10 percent tin, and 2 percent zinc it is termed
“admiralty gunmetal” bronze.
Global Resources Bronze • 145
Yet another type of bronze is copper-tin-nickel
bronze, in which the proportion of nickel is usually 1
to 2 percent of the alloy. Nickel bronze is designed to
withstand high temperatures and strongly resist cor-
rosion. It possesses a microstructure that is more
closely grained than most bronzes, while having both
added toughness and strength. Other types of bronze
alloys include aluminum bronzes, which typically are
1 to 14 percent aluminum and usually have smaller
percentages of other metals, such as iron, nickel, and
manganese. Aluminum bronzes are used in the pro-
duction of special wires, strips, tubings, and sheets for
which ductile strength is desirable.
A by-product of exposure to the elements of bronze
alloys that are less resistant to corrosion is the produc-
tion of a thin greenish or greenish-blue crust or pa-
tina called “verdigris.” This crust, often seen on out-
door statuary, fixtures, and fountains, is composed
typically of either copper sulfide or copper chloride.
Frederick M. Surowiec
Further Reading
Callister, William D. “Nonferrous Alloys.” In Materials
Science and Engineering: An Introduction. 7th ed. New
York: John Wiley & Sons, 2007.
Cverna, Fran, ed. “Bronzes.” In Worldwide Guide to
Equivalent Nonferrous Metals and Alloys. 4th ed. Ma-
terials Park, Ohio: ASM International, 2001.
Hummel, Rolf E. Understanding Materials Science: His-
tory, Properties, Applications. 2d ed. New York:
Springer, 2004.
Raymond, Robert. Out of the Fiery Furnace:The Impact of
Metals on the History of Mankind. University Park:
Pennsylvania State University Press, 1986.
Simons, Eric N. An Outline of Metallurgy. New York:
Hart, 1969.
See also: Alloys; Aluminum; Brass; Copper; Iron;
Manganese; Nickel; Oxides; Steel; Tin.
Buildings and appliances, energy-
efficient
Category: Environment, conservation, and
resource management
Before the 1970’s, buildings and appliances were de
-
signed without thought to efficient energy usage or
their environmental impact. Then came a growing
awareness that the burning of fossil fuels for energy re-
leases gases that pollute the environment, causes acid
rain, and contributes to global warming. Environ-
mental and health concerns and energy costs led to the
increased development of renewable, or “clean energy,”
resources: solar, wind, hydro, geothermal, and bio-
mass. Movements toward “green buildings,” energy
management systems (EMS’s), and intelligent control
systems developed.
Background
In 1990, the energy used in American buildings for
heating, cooling, lighting, and operating appliances
amounted to roughly 36 percent of U.S. energy use
and cost nearly $200 billion. About two-thirds of this
amount was fuel energy,includingthefuel energy lost
in generating and delivering electricity. Electricity is
considered worth the extra cost because it is quiet,
convenient, and available in small units. Because of
continuing improvements in space conditioning, ap-
pliances, and the controls for both, building and ap-
pliance energy use could be cut by half or even three-
quarters.
Insulation
“Space conditioning” is the warming and cooling of
rooms and buildings. Ways to make it more efficient
include improving insulation, siting, heat storage,
heaters, and coolers. Structures gain and lose heat in
three ways: air movement, conduction, and radiation.
Insulating a building requires isolating it from these
processes. The most important consideration is re-
ducing a building’s air flow, and walls and ceilings are
the primary reducers. The space-conditioning load of
a structure may be construed as the number of “air
changes” per hour. The next level of consideration is
heat conduction through walls, windows, ceilings,
and floors. Heat conduction can be slowed by con-
structingabuildingwiththickerwallsor by using insu-
lating materials that conduct heat more slowly. A ma-
terial’s insulating ability is measured by its resistance
to conduction, called its R value. A major innovation
during the 1970’s was the practice of framing houses
with 5-by-15-centimeter (2-by-6-inch) studs instead of
the standard two-by-fours. That design allowed insula-
tion to be 50 percent thicker.
Windows are a major heat conductor. One window
can conduct as much heat as an entire wall. During
the 1980’s in the United States, the amount of heat
146 • Buildings and appliances, energy-efficient Global Resources
lost through windows was estimated to have equaled
half the energy that was obtained from Alaskan oil
fields. Double-paned and even triple-paned windows
(with air space between the panes) to reduce this loss
became more common. To reduce conduction fur-
ther, the air between panes can be partiallyevacuated,
or the space can be filled with a less conductive gas,
such as xenon. Finally, windows can also have coatings
that reflectinfrared(heat)radiation,therebykeeping
summer heat out and holding heat inside during
winter.
Beginning in the 1970’s, Canadian researchers
worked to develop “superinsulated” houses: struc-
tures so well insulated that they hardly required fur-
naces, even in the severe winter climates characteris-
tic of much of Canada. The costs were an additional
two thousand to seven thousand dollars in construc-
tion and an ongoing expense of running an air
exchanger. In the winter, the exchanger warms in-
coming fresh air with the heat from air being ex-
hausted; in the summer it cools incoming air. Because
such a building is so well sealed, without the air
exchanger one could smell yesterday’s bacon and cof-
fee (as well as more noxious lingering odors).
Siting
The importance of the siting of a structure—that is,
the direction it “faces,” including where windows and
doors are placed and where there are solid walls—has
been known since ancient times. In the developed na-
tions of the twentieth century, as energy sources be-
came widely and cheaply available, designers and ar-
chitects often ignored this aspect of building design.
For example, they often did not consider the impor-
tance of catching sunlight on south-facing sides, pro-
tection from the cold on the north side, hardwood
trees (which can supply summer shade and then drop
their leaves to allow more sunlight to pass through in
winter), and overhangs to shade against the high sum-
mer Sun. These design elements alone can reduce the
need for heating and cooling energy significantly.
The energy crises of 1973 and 1979 reminded
builders of the drawbacks of old, energy-intensive ap-
proaches to building design and led to renewed con-
sideration of natural heat flow. The awareness that oil
is a limited resourcealsogavecredence to a moreradi-
cal siting idea known as terratecture: A structure can
be made more energy-efficient by locating it partially
underground. Terratecture is particularly efficient
when used to shield a north-facing wall. Insulation
and thermal inertia reduce heating and cooling loads,
while windows facing south and opening into court-
yards allow as much window space as conventional
structures. For a slight increase in construction costs,
terratectural houses have significant energy advan-
tages, allow more vegetation, and require less mainte-
nance. They are quite different from conventional
houses, however, and have not been widely adapted.
Heating and Cooling
During the mid-1700’s, the British colonies in North
America faced an energy crisis: a declining amount of
firewood. Traditional large fireplaces sent most heat
up the chimney. Benjamin Franklin studied more effi-
cient fireplaces in Europe, and he invented a metal
stove that radiated more of the fire’s heat into the
room. The Franklin stove (1742) provided more heat
by increasing “end-use efficiency” rather than by in-
creasing energy use. Two hundred years later, the en-
ergy crises of the late twentieth century led to the
application of burner advances that had been devel-
oped or proposed earlier. Studies of flame dynamics
and catalysts led to more complete fuel combustion,
and better radiators captured more heat from the
burner.
Hot climates and commercial buildings that pro-
duce excess heat require air-conditioning. Air-condi-
tioning is based on heat pumping, which cools the hot
internal air by moving the heat elsewhere. Most heat
pumps compress a gas on the hot side and allow it to
decompress on the cold side.
Electronic controls have helped reduce energy
waste in space conditioning. For instance, in winter,
computerized thermostats can maintain lower tem-
peratures while people are not in a building and then
automatically change the settings to a higher, more
comfortable level at times when people are scheduled
to return. For gas appliances, the replacement of pilot
lights with electric igniters has helped reduce unnec-
essary fuel use. (Electric igniters are even more im-
portant for intermittently used burners, such as those
used in stoves.)
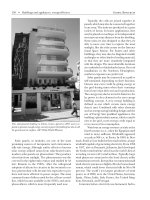
Another way of decreasing energy input is storing
heat or cold from different times of the day, or even
different seasons of the year. Thick stone on walls and
floors, such as those made of adobe bricks in the
Southwest, have been used for centuries in desert cli-
mates; they remain relatively cool during the after
-
noon heat and then slowly give off the day’s heat dur
-
ing cold nights. Higher-technology variants of storage
Global Resources Buildings and appliances, energy-efficient • 147
use less material per unit of heat. Office complexes
that are designed to store cool air can use smaller air-
conditioners and cheaper, off-peak power.
Lighting and Motors
Until the mid-nineteenth century, people rose at dawn
and retired at sundown because there was no form of
artificial lighting that could provide sufficient light
for most work or leisure activities after dark. Im-
proved oillampsandthenincandescentelectriclights
(first widely marketed by Thomas Edison in 1879)
started a revolution that eventually consumed roughly
a quarter of U.S. electricity directly and, in addition,
contributed to building cooling loads.
Incandescent lights use resistance heating to make
a wire filament glow, so they generate significant heat
in addition to light. Fluorescent lights, with a glow of
current flowing through gases under partial vacuum,
are more efficient and last longer. Fluorescent light-
ing was invented in 1867 by Antoine-Edmond Becque-
rel but not widely marketed until the 1940’s. In the
1980’s, compact fluorescents for small lamps were de-
veloped, followed by light-emitting diode technology;
such low-energy forms of lighting have begun to sup-
plant incandescent lighting, especially in new build-
ing projects. Moreover, controllers can improve effi-
ciency by switching off lights when people are gone;
they can also be programmed to reduce lighting when
sunlight is available.
Electric motors range from tiny shaver motors to
power drives for elevators and large air conditioners.
A number of methods have been developed to make
motors more efficient. The use of additional motor
windings (costing more copper wire) has always been
an option. Electronic controls that match power used
to the actual load rather than based on a constant
high load were developed after the 1970’s energy cri-
ses. Amorphous metals (produced by rapid cooling
from the molten state) have been developed to allow
electromagnets in motors to switch off faster, reduc-
ing drag; they also make more efficient transformers
for fluorescent lights.
Most improvements to appliance efficiencyinvolve
some combination of better motors and better space
conditioning. The electrical loads from refrigerators—
among the largest in most homes in industrialized
nations—dropped by half in average energy demand
in the United States between 1972 and 1992. More
efficient motors and better insulation were responsi
-
ble for the improvement.
The Energy Star Program
In 1992, the U.S. Environmental Protection Agency
established EnergyStar, a voluntary labeling program
that identifies products meeting strict standards of
energy efficiency. The program set the standard for
commercial buildings, homes, heating and cooling
devices, major appliances, and other products. The
Energy Star concept eventually expanded to other
countries, including members of the EuropeanUnion,
Japan, Taiwan, Canada, China, Australia, South Af-
rica, and New Zealand.
In 1992, the first labeled product line included per-
sonal computers and monitors. In 1995, the label was
expanded to include residential heating and cooling
products, including central air conditioners, furnaces,
programmable thermostats, and air-source heat
pumps. Energy Star for buildings and qualified new
homes was also launched. In 1996, the U.S. Depart-
ment of Energy became a partner in the program, and
the label expanded to include insulation and appli-
ances, such as dishwashers, refrigerators, and room
air conditioners. By March, 2006, Americans had pur-
chased more than two billion products that qualified
for the Energy Star rating, and by December of that
year, there were almost 750,000 Energy Star qualified
homes nationally.
In 2008, energy cost savings to consumers, busi-
nesses, and organizations totaled approximately $19
billion. The average house can produce twice the
greenhouse-gas emissions as the average car. The
amount of energy saved in 2008 helped prevent
greenhouse-gas emissions equal to those from 29 mil-
lion cars. By 2009, Energy Star had partnerships with
more than 15,000 public and private sector organiza-
tions, and had labels on more than sixty product cate-
gories, including thousands of models for home and
office use.
Compared to conventional products, those ap-
proved by Energy Star are more energy-efficient, save
on costs, and feature the latest technology. By using
less energy, they help reduce the negative impact on
the environment.
In the average home, heating and cooling are the
largest energy expenditures, accounting for about
one-half of the total energy bill. Energy Star compli-
ant heating and cooling equipment can cut yearly en-
ergy bills by 30 percent, or more than six hundred dol-
lars per year. A qualified furnace, when properly sized
and installed, along with sealed ducts and a program
-
mable thermostat, uses about 15 percent less energy
148 • Buildings and appliances, energy-efficient Global Resources
than a standard model and saves up to 20 percent on
heating bills. An Energy Star room air conditioner
use at least 10 percent less energy than conventional
models, and they often include timers for better tem-
perature control. To keep heating, ventilating, and
air-conditioning (HVAC) systems running efficiently,
Energy Star recommends changing air filters regu-
larly, installing a programmable thermostat, and seal-
ing heating and cooling ducts.
The second largest energy expenditure is water
heating, which costs the typical household four hun-
dred to six hundred dollars per year. A new Energy
Star water heaterwouldcutwaterheatingbillsbyhalf.
Energy Star refrigerators use20percentlessenergy
than other models, thus cutting energy bills by $165
over its lifetime. They also have precise temperature
controls and advanced food compartments to keep
food fresher for a longer time. Because they use much
less water than conventional models, Energy Star
dishwashers help ease the demand on the country’s
water supplies. Energy Star also recommends run-
ning the dishwasher with a full load and that the air-
dry option be used instead of the heat-dry.
Using the most innovative technology, Energy Star
clothes washers cut energy and water consumption by
more than 40 percent, compared to conventional
models. Most do not have a central agitator and use a
reduced amount of hot water in the wash cycle. In-
stead of rubbing laundry against an agitator in a full
tub, front-load washers tumble laundry through a
small amount of water. Modern top loaders flip or
spin clothes through a reduced stream of water. So-
phisticated motors spin clothes two to three times
faster during the spin cycle to extract more water, thus
requiring less time in the dryer.
Lighting accounts for 20 percent of the electric bill
in the average U.S. home, and 7 percent of all energy
consumed in the United States is used in lighting for
homes and businesses. An Energy Star qualified com-
pact fluorescent light bulb (CFL) uses 75 percent less
energy and lasts ten times longer than an incandes-
cent bulb. It pays for itself in six months, and the sav-
ings are about thirty dollars over its lifetime.
The Green Building Movement
After the rise of environmental consciousness in the
1960’s, and the 1973 and 1979 oil shortages, con-
cerned groupsaroundtheworldbeganto look for ways
to conserve energy and preserve natural resources.
One of the most important applications for this cul
-
tural shift was the transformation of human dwell
-
ings and workplaces, resulting in the green building
movement. Starting with heat from the Sun, archi-
tects incorporated active photovoltaic systems and
passive designs that cleverly positioned windows, walls,
and rooftops to capture and retain heat. Another fac-
tor was an increased attention to heat exchange as
affected by materials and construction techniques.
Building materials were also reexamined in terms of
toxicity; pollution and energy consumption in factory
processing; durability; interaction with soil, bedrock,
water; and other factors.
Contemporary green building looks at all of these
issues and more, because a narrow approach could
actually do more harm than good. A building sealed
too tightly, for example, could have excellent heat
retention, but might not have enough internal air
circulation. Recycled materials might lower resource
consumption, but could actually be more toxic.
Therefore cross-disciplinary collaboration is neces-
sary in order to achieve effective green building de-
sign. In the United States, the Office of the Federal
Environmental Executive (OFEE) recognizes the
complexity of green building, and organizes the ef-
fort around two primary goals: limiting the consump-
tion of basic resources such as materials, water, and
energy and protecting the environment and people’s
health.
One of the most important elements in a green
building is its use of green energy. Although some
governments have established precise technical defi-
nitions of green energy for purposes of incentive pro-
grams, the term is generally associated with environ-
mentalism; conveys the idea of safe, nonpolluting
energy; and often means renewable energy. Although
not all consumers are able to construct a new green
building, many achieve these goals by transforming
existing structures. A key element in both new and
existing buildings is the use of Energy Star compliant
appliances.
Renewable Energy Sources
The energy crises of the 1970’s and environmental
concerns led to interest in alternative, renewable en-
ergy resources. Renewable energy is “clean” energy
from a source that is inexhaustible and easily replen-
ished. Nonrenewable energy comes from sources not
easily replaced, such as fossil fuels and nuclear energy.
Renewable energy does not pollute air or require
waste cleanups likenonrenewableenergygeneration.
Global Resources Buildings and appliances, energy-efficient • 149