Undeclared Stockmarket Secrets Chapter 1 doc
Bạn đang xem bản rút gọn của tài liệu. Xem và tải ngay bản đầy đủ của tài liệu tại đây (7.24 MB, 45 trang )
First published in 1993. Revised January 2000
Copyright (C) 1993 by Tom Williams
Published by Genie Software Ltd. West Worthing, Sussex, BN11 5QD, England
1993 World-wide rights reserved.
Telephone: +44 (0)1903-505973 Fax: +44 (0)1903-505974
Email:
URL: www.TradeToWin.com
CONTENTS
Introduction
1
RANDOM WALKS AND OTHER MISCONCEPTIONS
3
CHAPTER ONE
4
4
4
7
10
II
15
20
23
26
29
31
31
33
39
A MARKET OVERVIEW
The Market Professionals
Supplyand Demand
How To Read The Market
How to Tell if the Market is Strong or Weak
A Simple Example -End of a Rising Market
An Exception to the Low Volume Rule
VOLUME -The Key to the Truth
Testing Supply
Pushing Up Through Supply
High Volume On Market Tops
Effort versus Results
What actually stops a down move and how will 1 recognise this?
The 'Shake-Out'
CHAPTER TWO
43
REFINEMENTS IN VOLUME SPREAD ANAL YSIS
Volume Surges in Related Markets
Different Time Frames
Manipulation of the Markets
43
43
45
CHAPTER THREE
58
58
58
58
59
59
61
62
63
65
67
68
70
TRENDS AND TREND LINES
An Introduction to Trending
Constructing Trend Lines
Bottoms and Tops
Trend Scaling
Why do Trend Lines Appear to Work?
Perceived Value
Trend Clusters
Using Trend Clusters
Support and Resistance -and Volume near a Trend Line
Pushing up through a Trend Line.
No Effort Down
CHAPTER FOUR
71
THE ANA TOMY OF A BULL OR BEAR MARKET
Any Market Moves On Supply And Demand.
A Campaign
The Selling Climax.
The Buying Climax
From Bear to Bull Markets
Bear Markets
Falling Pressure
71
72
73
75
78
81
84
85
86
CHAPTER FIVE
86
87
"1 W ANT TO BECOME A FULL TIME TRADER"
What is a System?
89
89
89
90
90
91
91
92
94
95
95
97
99
99
102
102
103
103
104
107
"
~
,
TRADING HINTS AND TIPS
Listen to the News by All Means But Do Not Fix Future Price Targets In Your Mind
Always Have a Plan
Always Plan What You Will Do if You are Wrong
Timing ~
Be Your Own Boss, Do Not Rely on Other People
Concentration
Trading the Old Account Period
Traders Frequently Get 'Locked into or out of a Market'
How Will 1 Recognise Signs of Strength?
What are the Main Signs of Weakness?
Summary -Up-thrusts
It is Useful to Have a Check List
How Willl Start to Recognise the Likely End to a Rally?
Narrow Spread. High Volume, on an Up-Day/bar
What is an Up- Thrust'?
The Path Of Least Resistance
HOW TO SELECT A STOCK The Easy Way
Point and Figure Charts
109
THE VSAS PROGRA~
112
GLOSSARY
125
INDEX
Introduction
Volume Spread Analysis, is a new term which describes the method of interpreting,
analysing and understanding a bar chart displayed on your computer screen. A chart
with the high, low, close and volume will graphically show you how supply and demand
presents its self to you in a form that you can analyse.
For the correct analysis of volume one needs to realise that the recorded volume
contains only half of the information required to arrive at a correct analysis. The other
half of the information is found in the price spreads. Volume always indicates the
amount of activity going on. The corresponding price spread shows the price movement
on that volume [activity]. This book is about how the markets work, and, most
importantly, will help you to recognise indications as they occur at the live edge of a
trading market. Indications that a pit trader, market maker, specialist or atop
professional trader would see and recognise.
Volume Spread Analysis seeks to establish the cause of price movements and from the
cause predict the future direction of prices. The cause is the imbalance between
Supply and Demand in the market which is created by the activity of professional
operators. The effect is either a bullish or bearish move according to market conditions
prevailing. We will also be looking at the subject from the other side of the trade. It is
the close study of the reactions of the specialists and market makers which will give
you a direct access to future market behaviour. Much of what we shall be discussing is
also concerned with the psychology of trading, which you need to fully understand
because the professional operator does and will take full advantage wherever possible.
Professionals operating in the markets are very much aware of the emotions that drive
YOu (and the herd) in your trading. We will be looking at how these emotions are
triggered to benefit professional traders and hence price movements.
Billions of dollars change hands in the world's stock markets, financial futures and
currency markets, every working day. Trading these markets is by far the largest
business on the planet. And yet, if you ask the average businessman or woman why we
have bull markets and why do we have bear markets, you will receive many opinions
but most will have absolutely no idea on the underlying cause of any move. These are
intelligent people. Many of them will have traded in the market in one way or another. A
large number will have invested substantial amounts either directly or indirectly in the
stock markets.
Financial trading may be the largest business in the world but it may be also the least
understood business in the world. Sudden moves are a mystery to most, arriving when
least expected and appearing to have little logic attached to them, frequently doing the
exact opposite to a trader's intuitive judgement. Even those who make their living from
trading, particularly the brokers and the pundits, who you would expect to have a
detailed knowledge of the causes and effects in their chosen field, very often know little
about how the markets really work.
It is said that up to 90% of traders are on the losing side of the stock market. So
perhaps many of these traders already have the perfect system to become very
successful. Trade in the opposite direction to what their intuitive urge to trade tells
1
them! More sensibly, this book may be able to help you trade rationally in away a
professional does.
Please ask yourself these questions:
Why do we have bull markets ?
Why do we have bear markets ?
Why do markets sometimes trend strongly ?
Why do the markets run sideways at other times ?
profit from all of these movements ?
How can
If you can answer these questions with confidence you do not need to read this book. If
on the other hand you cannot, don't worry because you are not alone, and you will have
the answers by the time you have finished reading this book.
The army puts great effort into training their men. This training is not only designed to
keep the men fit and to maintain discipline, but is designed around drills and
procedures learned by rote. Drills are practised time and time again until the response
becomes automatic. In times of extreme stress which is encountered in battle [trading in
your case] the soldier is then equipped to handle this stress, ensuring a correct
response, suppressing fear and excitement and allowing him to act correctly.
You, too, need to be trained to act correctly under the stress of trading. The soldier is
lucky, he has expert tutors with years of experience behind them, to teach and to show,
even forcing him to learn. You have to do it all alone, with little or no experience, no
expert to show you, and nobody to force you.
Good traders overcome these problems by developing a disciplined trading system for
themselves. It can be very sophisticated or very simple, as long as you think it will give
you the edge you will certainly need. A system strictly followed avoids emotion because
like the trained soldier you have already done all the 'thinking' before the problems
arrive. This should then force you to act correctly while under trading stress. This of
course is easy to say, but very difficult to put into practice.
2
RANDOM WALKS AND OTHER MISCONCEPTIONS
To most people the sudden moves seen in the stock market are a mystery. Movements
seem to be heavily influenced by news and appear when least expected; the market
usually doing the exact opposite to what it looks like it should be doing, or that your gut
feeling tells you it ought to be doing. Sudden moves taking place that appear to have
little to do with logic -Bear Markets in times of financial success, strong Bull Markets in
the depths of recession. Countries whose inflation rates make you shudder are making
new highs in their indices. It seems a place for gamblers -or for those people that work
in the City, or on Wall St -who must surely know exactly what is going on! This is a
fallacy. If you can take a little time to understand this book, the heavy burden of
confusion will be removed from you forever. The Stock Market is not difficult to follow if
you know what you are looking at in the first place. You will understand exactly how the
market works. You will know how a bull market is created, and also the cause of a
bear market. Most of all you will begin to understand how to make money from your
new-found knowledge.
The markets are certainly complex. So complex that it has often been seriously
suggested that they move at random. Certainly there is a suggestion of randomness in
the appearance of the charts of various instruments and indices. I suspect however,
that those who describe market activity as random are simply using the term loosely
and what they really mean is that movements are chaotic. Chaos is not quite the same
thing as randomness. In a chaotic system there are causes and effects, but these are
so complex that without a complete knowledge and understanding of all the aspects of
all of the causes and all the effects, the results are unpredictable. There is an
enormous gulf between unpredictability and randomness.
Unless you have some idea of the cause and effect in the markets you will undoubtedly
and frequently be frustrated in your trading. Why did your favourite technical tool, which
worked for months, not work "this time" when it really counted? How come your very
accurate and detailed fundamental analysis of the performance of xYZ Industries,
failed to predict the big slide in price two days after you bought 2,000 shares in it?
We have been hearing a lot about 'The Big Bang' theory of the creation of the Universe.
The whole concept appears complicated, confusing, even beyond our comprehension,
when observed from our tiny speck of dust in an apparently insignificant minor galaxy.
Many cosmologists believe that the Universe is probably founded on just a few simple
concepts. Some are actively seeking a Grand Unified Theory that explains the whole of
the Universe and everything in it in the most elegant and simplest of terms, at the
lowest level. The stock market also appears confusing and complicated, but it is most
definitely based on simple logic. Like any other free market place, prices in the
financial markets are controlled by Supply and Demand. This is no great secret,
however, Supply and Demand as practised in the stock market has a twist in its tail. To
be an effective trader there is a great need to understand how Supply and Demand is
handled under different market conditions and how you can take advantage of this
knowledge. This book will help you gain that knowledge.
3
CHAPTER ONE
A MARKET OVERVIEW
Every stock market is built up around individual company shares listed on the exchange
in question. These markets are composed of hundreds or thousands of these
instruments, traded daily on a vast scale, and in all but the most thinly traded markets,
millions of shares will change hands every day and many thousands of individual deals
will be done between buyers and sellers. All this activity has to be monitored in some
way. Some way also has to be found to try and gauge the overall performance of a
market. This has led to the introduction of market indices, like the Dow Jones Industrial
Average [DJIA] and the Financial Times Stock Exchange 100 Share Index [FTSE100].
In some cases the index represents the performance of the entire market, but in most
cases the index is made up from the "high rollers" in the market where trading activity is
usually greatest.
I n the case of the FTSE 100 you are looking at one hundred of the strongest leading
companies' shares, weighted by company size, then periodically averaged out to create
an Index. These shares represent an equity holding in the companies concerned and
they are worth something in their own right. They therefore have an intrinsic value as
part-ownership of a company which is trading.
The first secret to learn in trading successfully [as opposed to investing] is to forget
about the intrinsic value of a stock, or any other instrument. What you need to be
concerned with is its perceived value, its value to professional traders, not the value it
represents as an interest in a company. The intrinsic is only a component of perceived
value. This is a contradiction that undoubtedly mystifies the directors of strong
companies with a weak stock. It is the perceived value that is reflected in the price in
the market not, as you might expect, its intrinsic value. We shall return to this later on
stock selection .
Have you ever wondered why the FTSE100 Index has shown a more or less continuous
rise since it was first instigated? There are many contributory factors: inflation, constant
expansion of the larger corporations and long term investment by large players; but the
most important single cause is the simplest and most often overlooked. The creators of
the Index want their Index to show the strongest possible performance and the greatest
growth. To this end, every so often they will weed out the poor performers and replace
them with up-and-coming strong performers.
The Market Professionals
In any business where there is money involved and profits to make, there are
professionals. There are professional diamond merchants, professional antique and
fine art dealers, professional car dealers and professional coal merchants, among many
others. All these people have one thing in mind, they need to make a profit from a price
difference to stay in business. Professional traders are also very active in the stock
market and are no less professional than any other profession. Doctors are collectively
known as professionals, but in practice split themselves up into specialist groups,
specialising in a particular field of medicine. Professional stock market traders also tend
4
to specialise. The group we are interested in to start with are those that specialise in the
accumulation [buying] and distribution [selling] of stock. These professionals are very
good at deciding which of the listed shares are worth buying, and which are best left
alone. If they decide to buy into a stock they are not going to go about it in a haphazard
fashion. They will first plan and then launch, with military precision, a campaign to
acquire that stock, or in other words to accumulate.
To accumulate means to buy as much of the stock as you can, without significantly
putting the price up against your own buying, until there are few, or no more shares
available at the price level you have been buying at. This buying usually takes place
after a bear move has taken place in the stock market as a whole [as seen in the Index].
The lower prices now look attractive. Not all the stock issued can ever be accumulated
at anyone time. Most of the stock is tied up. Banks retain stock to cover loans, directors
retain stock for different reasons and so on. It is the floating supply they are after. Once
most of the stock has been removed from the hands of other traders, there is little or no
stock left to sell into the mark-up. Many other traders interested in small moves most
certainly would sell if they still owned the stock [taking profits]. The resistance to higher
prices has been removed from the market. If this process has also been going on, in
many other stocks, by many other professionals, at a similar time because market
conditions are right, you will have a bull market on your hands. Once a bullish move
does start who or what is going to stop the prices from going up? Nobody!
We have all heard of the term "resistance", but what exactly is meant by this loosely
used term? Resistance to any up move is caused by somebody selling the stock as
soon as any rally starts. In other words the floating supply has not been removed. This
selling into any rally is bad news for any higher prices. This is why the supply
[resistance] has to be removed.
Once any move does take place, then like sheep, other traders are forced to follow.
Futures will fluctuate above or below the cash price, but the cash price sets the limits
because large dealing houses with low dealing costs will have an established arbitrage
channel and their actions will bring the future back in line with the cash. This process
keeps the price movements largely similar. Sudden movements away from the cash
price are usually caused by the specialists & market makers. These professionals are
trading their own accounts and can see both sides of the market far better than you
can. If they are in the process of selling or buying large blocks of shares they know
these large transactions will have an immediate effect on the market so they will also
trade the futures and option contracts in order to offset or dampen risk. This is why the
future often seems to move before the cash.
At a potential top of a bull market many professional traders will be looking to sell stock
bought at lower levels to take profits. Most of these traders will place large orders to
sell, not at the current price available, but at a specified price range. Any selling has to
be absorbed by the market makers who have to create a 'market'. Some sell orders will
be filled immediately, some go, figuratively, 'onto the books' The market makers in turn
have to resell, which has to be accomplished without putting the price down against
their own or other trader's selling. This process is known as distribution, and will
normally take some time. In the early stages of distribution if the selling is so great that
prices are forced down, the selling stops and the price is then supported, which gives
the market maker and other traders the chance to sell more stock on the next wave up.
Once the professionals have sold most of their holdings a bear market starts. The
5
whole stock market basically revolves around this simple principle, which is not well
known to most traders.
Perhaps you can now see the unique position the market makers are
in. They can see both sides of the market. This is why the price
spread gives so much information away, as you will see later.
To refine the basic definition of what causes Bull and Bear Markets, I would like to
introduce the concept of Strong and Weak Holders. We shall return to this subject in
greater depth later, but for now let us say:
Strong holders are usually those traders who have not allowed themselves to be caught
in a poor trading position. They are happy with their position, they are not shaken out
on sudden down moves or sucked into the market at or near the tops. Strong holders
are basically strong because they are trading on the right side of the market. Their
capital base is usually large and they can read the market and know how to trade it.
Strong holders take losses frequently but the losses are low because they close out any
poor trade fast and take account of these losses along with other trades which are
generally much more profitable.
Most traders new to the market very easily become 'Weak Holders' they cannot really
accept losses as most of their capital is rapidly disappearing. They are on a learning
curve. Weak holders are those traders that have allowed themselves to be 'Iocked-in'
as the market moves against them, and are hoping and praying that the market will
soon move back to their price level. These traders are liable to be 'shaken out' on any
sudden moves on bad news. These traders have created poor trading positions for
themselves, and are immediately under pressure if the market turns against them.
If we combine the concepts of strong holders accumulating stock from weak holders
prior to a bull move and distributing stock to potential weak holders prior to a bear
move, then in this light:
A Bull Market occurs when there has been a substantial transfer of
stock from Weak Holders to Strong Holders, generally, at a loss to
Weak Holders.
A Bear Market occurs when there has been a substantial transfer of
stock from Strong Holders to Weak Holders, generally at a profit to
the Strong Holders.
We shall return to this basic idea time and again. Look closely at the last few
paragraphs and try and grasp the implications of this last concept to you as a trader.
Unless the laws of human behaviour change this process will always be present, and
you must be aware of the phenomenon of 'Herd Behaviour' sometimes known as crowd
behaviour.
There are two main principles at work in the stock market which causes a market to
turn. Both these principles will arrive in varying intensities producing larger or smaller
moves.
6
Principle One.
The herd will panic after substantial falls and start to sell usually on bad news. Then ask
yourself.
Are the trading syndicates and market makers prepared to absorb the panic selling at
these price levels? (must be on a down bar). If they are, then this is a strong sign of
strength .
Principle Two.
The herd will at some time after substantial rises as seen in a bull market become
annoyed at missing out on the up-move and will rush in and buy, usually on 'good
news'. This includes traders that already have long positions, and want more. Then ask
yourself. Are the trading syndicates and market makers selling into this buying? (must
be a up-bar) If so, then this is a strong sign of weakness.
Does this mean that the dice are always loaded against you when you enter the
market ? Are you destined always to be manipulated ?
Well, yes and no
A professional trader isolates himself from the herd and has trained himself to become
a predator rather than a victim. He understands and recognises principles that drive the
markets and refuses to be mislead by good or bad news, tips, advice, brokers advice
and well meaning friends. When the market is being shaken-out on bad news he is in
there buying. When the Herd is buying and the news is good he is looking to sell.
You are entering a business that has attracted some of the sharpest minds around. All
you have to do is to join them. Trading with the strong holders requires a means to
determine the balance of supply and demand for an instrument in terms of professional
interest, or lack of interest, in it. If you can buy when the professionals are buying
[accumulating or re-accumulating] and sell when the professionals are selling
[distributing or re-distributing] and you don't try to buck the system you are following,
you can be as successful as anybody else in the market.
Indeed you stand the chance of being considerably more successful than most! Read
on, to find out how.
Supply and Demand
We can learn a great deal from observation of the professional market operators.
If you watch a top professional trading and he is not on the floor, he will most likely be
looking at a trading screen, or a graph on a computer screen, probably with live data
coming in. On the face of it his resources are no different to any other trader. However,
he does have information on the screen you are not privileged to see. He knows where
all the stops are, he knows who the large traders are and whether they are buying or
7
selling. He has low dealing costs compared to you. He is well practised in the art of
trading and money management.
What does he see ?
How does he manage to get a good position when, by the time you get to the
market, prices always seem to be against your interests ?
How does such a trader know the market is going up or down
"
He understands the market and uses his knowledge of volume and price action to
answer different questions to those you are asking.
His primary concern is the state of supply and demand of those instruments in which
he has an interest. One way or another, the answers lie in some form of analysis of
trading volume, price action and price spreads. We can call this Volume Spread
Analysis and abbreviate it to V SA for simplicity.
Learning which questions to ask and how to obtain the answers require us to look more
deeply into the markets. The stock market becomes far more interesting if you have
some idea what is going on and what is causing it to go up or down. A whole new and
exciting world can open up for you.
Many traders use computers, and many of these traders are using Technical Analysis
packages. They will have learned in most cases how to use well known mathematical
formulas and indicators. Some packages have 70 or more different tools; cycles,
angles, even astrological forecasts have arrived. To many traders these methods will
have a place in their trading decisions because they will be familiar with their use.
However, it can become a very frustrating business being placed outside of the market
looking in, using these tools, trying to decide if the market is likely to go up or down.
The fact is these tools never tell you 'why' the market is moving either up or down. That
in most cases remains a mystery .
People, unless they are naturally well disciplined, are extremely open to suggestion!
Folks like to be given tips, hear stories, rumours, secret information leaked from
unknown sources. They are therefore responsive to these suggestions. A secret
formula perhaps being revealed, predictions by psychics and so on. However, unless
you are extremely lucky, you will find that the very time you personally put down your
money to have ago, it just did not seem to have worked "this time" for you, although it
may have appeared to work for others many times before. In my own case I had read
several years ago that the President of the United States inaugurated every twentieth
year had died in office for the last 150 years. This was predicted to continue. This
seemed very strange to me but on checking up the facts this seemed to be correct,
President Kennedy being the last. The next President due for this series of events was
President Reagan. This event would definitely give market professionals the bad news
required to shake the market out, and yes, I would be ready and waiting to buy on the
'shake-out'. Just because I personally was ready and waiting, of course, it never
happened. Even if it had appeared to have been going on for the last 150 years. For
the most part, professional floor traders, the specialists, do not look at these things.
They simply do not have the time. They have to act fast as market conditions change
because they are up against other professionals who will act immediately against their
interests if they are too slow in reacting to the market. The only way they can act that
8
fast is to understand, almost intuitively, what the market is trying to tell them. They read
the market through volume and its relationship to price action.
You, too, can read the market just as effectively. But you have to know what you are
looking at, and what you are looking for.
9
How To Read The Market
Firstly, you will need to see all the relevant price action, going back over the past
several months at least. The old method was to keep a continuous daily chart of the
stock or Index you were following by entering the accurate high, low, close prices for
the time frame you were working in and the volume of business action, all by hand.
These days it is better by far is to use one of the many computer programs available.
An example of a conventional bar chart is shown below
Chart 1. S&P500. What a traditional bar chart with volume looks like.
,," "
-
typical bar chart showing the high, low and close, known as the price spread.
This .is ye;y important in our analysis, ,
1450
~
1400
-N~
-1300
-12~
~
_1
1 volume
j
,!
'\
Chart courtesy V SA Five
A reliable and consistent daily record of the high, low, close and volume is required. To
build this chart, a bar is drawn each day from the high to the low against the vertical
scale of the chart and the close price is marked by a short horizontal bar to the right.
Some charts include opening prices as a bar to the left, but they will not be necessary
in our approach. Collectively each record is known as a 'bar'
Volume is marked on the same daily basis, but using a different vertical scale. It is
usually represented by a single vertical bar rising from zero traditionally drawn below
the price chart. You should use the totals for the volume of business, not open interest
volume, since open interest can be misleading. Tick volume may be used where no
transaction volume is available.
We are particularly concerned on this chart with the volume of business, which gives us
an indication of the amount of activity that has taken place during the day's trading.
Volume is seen at the bottom of the chart as vertical lines. The line running from left to
right across the volume is a simple 30 day average calculated by our computer program
10
~ L r ~
.r ~ r r ri L :cursor~ar "-
: I, I ~ """,r
r ' .~ I
t trl r ~Lt.~J .
Ir ~ ~ ~ L ~ ~ ~
L ~ r, :
t I L~.
: !
to help in deciding if the daily volume is low or high. The day's high, low and close [price
spread] can now be used to determine the purpose of that activity [volume].
You will soon start to see that the market has 'phases'. That is sections of the market
can be seen building a cause for the next move. These phases vary, some last only a
few days, some several weeks. The longer phases give rise to large moves, the shorter
phases to smaller moves. This becomes very apparent on a study of a point and figure
chart. Point and figure charts are discussed later.
A volume figure taken in isolation means little. It is the relative volume we must always
look at. Today's volume is compared to previous volume. With most markets it is fairly
easy to judge whether the volume is normal, abnormally high, or abnormally low by eye
alone. Once you have established the volume of business you must consider how the
market responds to this activity.
The price spread is the range from the high to the low in the price bar. We look at this
with regard to the spreads of the other bars preceding the one under investigation and
those that follow. Is the spread abnormally wide, abnormally narrow, or just plain
average and how much volume has accompanied it? Again any spread taken in
isolation means little. Like the volume, it is the relative spread we must always look at.
We will also use the close price to determine the direction of the spread. If the market
has rallied strongly during the day and has closed near the highs of the day, we say we
have a wide spread up [up on the previous bar] closing on the highs. Conversely, we
may have a narrow spread down compared to the previous day's spread. We also pay
great attention to whether the bar is either an up bar or a down bar.
The close is also used, relative to the previous close, to determine the movement.
Where a bar closes lower than the previous close, we refer to it as a down day; or we
might have an up day, a level day, a gapped down day.
You will see all of these terms are sometimes used simultaneously to describe a day's
action on the chart. It is a concise and useful notation technique. You may have for
example, a wide spread up on high volume. On this day there was a wide spread
closing on/near the high, up on the previous day, with high volume.
How to Tell if the Market is Strong or Weak
Buy and sell orders from traders around the world are processed and matched up by
market makers. It is their job to create a market. In order to create a market they must
have large blocks of stocks to trade with.
If they do not have sufficient quantities on their books to trade with they will call on
other market makers for assistance. There are market makers in the UK, and many
specialists, locals and market makers in the US. They are in competition with each
other for your business, so their response to your buy or sell order has to be realistic
and responsive to market conditions.
If the market has been in a bull-move and you place a buy order into a rising market,
you may receive what appears to be a good price from the floor of the exchange. Why
are you receiving a good price? Have these hard-nosed professionals decided that they
like you and have decided to be generous giving away some of their profits to you? Or
have they now decided to start switching positions, taking a bearish or negative view of
the market, because their books have started to show large sell orders to dispose of?
Their perceived value of the market or stock may be lower than yours because they
expect prices to fall or at best go sideways. Such action, repeated many times across
the floor, will tend to keep the spread of the day narrow, by limiting the upper end of the
price spread because they are not only giving you what appears to be a good price, but
also every other buyer. If, on the other hand, the market maker has a bullish view
because he does not have large sell orders on his books, he will mark up the price on
your buy order, giving you what appears to be a poor price. This, repeated, makes the
spread wider as the price is constantly marked up during the day.
So by simple observation of the spread of the bar we can read the sentiment of the
market makers; the opinion of those who can see both sides of the market.
You will find that many days of weakness are gapped up. This gapping up is far
different from a wide spread up where they are marking the prices up against the
buying. The gapping up is done rapidly usually very early in the day's trading and will
certainly have emotional impact. The action is usually designed to try to suck you into a
potentially weak market and into a poor trade, catch stop losses, or panic traders in
general.
Beware against confusing these two types of action. Weak gaps up are always into
regions of new highs, when news is good and the bull market looks as though it will last
forever. The same action is also seen in a stronger type of market, but in this second
case you will have an old trading area to the left at a similar price level where there are
always locked-in traders who have seen substantial paper losses but have refused to
be shaken-out by any falls. These old locked in traders want only one thing, to get out
of the market at a similar price to the one they first started with. Professional traders
that are still bullish know this.
To encourage these old locked-in traders not to sell professional traders will mark or
gap the market up and through these areas as quickly as possible.
12
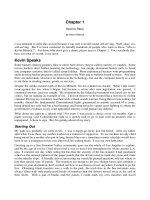
Chart 2. NASDAQ five minute chart
"'9'3
~,~,,;
They are fearful as the market moves against them and are liable to sell
bullish market. A sudden rise up and thru these areas encourages traders
not to sell : ;
i-
!:-2~750
i-
::
!:- 2~5
::
i-
~:50
::-228750
.1 ~
~ .1. t
r
2285
~~.l = '.
.I.
r: .i. , , r
I
. .
'-
i !-
, !-228250
,=
;-
" i:- 2280
;-
i:
"1:-227750
" ;~
,.
/
trading area
~
~n~f(.e-Q1)t ~r~~ w",Q.e
on b~d news
, ~~ ~_.
[
.
't1
I!~-
~o
-"'1.
Charl courlesy V SA Five
Prices have been rapidly marked up by professional traders whose view of the market
at that moment is bullish. We know this because the volume has increased
substantially backing up the move. We know it is not a trap up-move because the
volume is supporting the move. Wide spreads up are designed to lock you out of the
market rather than trying to suck you in. This will tend to put you off buying, as it goes
against human nature to buy something today that you could have bought cheaper
yesterday, or even a few hours earlier. This also panic's those traders that shorted the
market on the last lows encourage on by 'bad news' which always seems to appear on
or near the lows. These traders now have to cover their short position [buying] adding to
the demand .
We have a trading range directly to the left full of lock-in traders praying and hoping for
a recovery to enable them to sell with little or no loss.
The market had moved sideways in what is known as a 'trading range' which lasted
about 30 trading days. During these days many traders would have bought, they are in
the market at fairly high prices and are been extremely nervous on the last reaction.
Many would have been shaken-out on the lows, however, many are still in there. If the
market is still bullish and higher prices are anticipated by the market makers, gapping
up, or wide spreads up pushing through this old trading range will encourage these
nervous traders not to sell. Professional money does not want to be forced to buy at
what appears to be a high price to maintain a rally.
13
The volume shows a substantial and healthy increase, this is bullish volume. Excessive
volume, however, is never a good sign [supply liable to be swamping demand] while low
volume warns you of a trap up move [no demand].
If you take the rapid up move in isolation all it shows is that it looks as if the market is
going up. What brings it to life is the trading range directly to the left. You now know
"why" it is being rapidly marked up, or even gapped-up. Any low volume down bars or a
'test' after the prices have rallied and cleared the resistance to the left is an indication of
strength and higher prices.
Market Makers base their bids and offers on information you are not privileged to see.
They know of big blocks of buy or sell orders on their books at particular levels and the
general flow of the market. These wholesalers of stocks also trade their own accounts.
It would be na.ive to think they are not capable of temporarily marking the market up or
down as the opportunity presents itself, trading in the futures or options markets at the
same time. They can easily mark the market up or down on good or bad news, or any
other pretence. They are not under the severe trading pressure this has put on all other
traders, because they are in tune with real picture and in most part it is they that are
doing all the manipulating. This is good news for us because we can see them doing
this in most cases fairly clearly and can catch a good trade if we are paying attention.
Why play around with the prices? They want to trap as many traders as possible into
poor positions. As an extra bonus for them this also includes catching stop loss orders.
Because of the huge volume of trading it will take professional buying or selling to make a
difference large enough for us to read the variations in the price spread and the volume with
confidence. This fact alone tells us that there are professionals working in all the markets.
These traders by their very nature will have little interest in your financial well-being. In fact they
are predators looking to catch your stops and mislead you into a poor trade given the slightest
opportunity. The continuous price quotes throughout the trading day will show a high, low, close
and volume for the time frame you are using (tick volume is generated if real volume is
withheld). You now have the information to determine the true balance of supply and demand.
This skill will take you up to a new and exciting level of expertise.
14
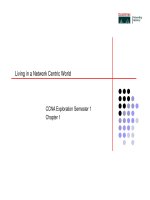
Chart 3. Nasdaq five minute chart showing what happened during the next few bars.
~ ':.c.'.!C"
2305
rL~
these two bars cor
the s&ength. Do\VJ
reduced volume
.followed by a'tes1
lfinn
Ion,
2300
2295
2290
r
L
2285
""
.l . -
r fi~~t
: i:1
t-Ll.: i.j
'rl-l~fr
~=:t
2280
reduced
volume on
L::~~dQ~hm:~-~~
~-j-:: ::;!
-
-2275
~ ~ ~ -, j
~
Chart courtesy of V SA Five
The text is automatically produced on the lows showing how a computerised system
can with as few lines of code pick up how supply and demand presents itself on a chart.
Immediately after the two bar mark up we are looking for confirmation to the bullish side
of the market as this could possibly be a false break-out. The first bar is down on
reduced volume [no serious professional selling] while the second bar is known as a
'test' in a rising market [see definition of a 'test'] Both of these indications are bullish.
Activity in the market, either on a busy day or on a quiet day creates a price spread
which is seen on your chart as the high, low, and close. It is a vital part of analysing the
market. Couple this spread information with the volume and you will have real insight
into the way the market is going.
let's have a look at a simple example to demonstrate how volume and price
spreads work together .
A Simple Example -End of a Rising Market
Assume we have already seen substantial rises in the market and the market is now
suddenly into new high ground. [There is nothing higher on your chart to the left]. High
volume appears with a narrow spread on an up day. Why does this give us a sell
signal?
If the high volume [high activity] had represented mostly buying surely the spread would
have to be wide and up? We know now that the market makers do not want to give you
a good deal. Buyers coming into the market need somebody to buy from. If market
makers or specialists in their wisdom decide to meet this demand and sell throughout
15
the day to those buyers this will effectively put a lid on the top end of the market
causing a narrow spread up bar for the day. Professional money will not do this if they
are expecting higher prices, but will if they anticipate lower prices.
However, you will probably never notice this indication when it does happen because
you will have been absorbing all the euphoria and good news which always happens on
a market top. If you have long position you are far to happy of thinking of selling, you
may even be thinking of buying more. Its not easy to think like a professional trader,
you have to work at it.
End of a rising market [one of several indications]
So the essential ingredients to this bearish indication are
An up-day, on high volume, with a narrow spread, into new high
ground. Each element is essential for an accurate signal.
The volume here tells you how much trading is going on and that it is high. The new
high ground shows that the volume of trading has not been influenced by other traders
locked-into the market [which we will cover in some depth later on]. What we are seeing
is the market makers telling us their bearish views of the market by the narrow spread
on high volume on an up-day.
How do we know this process is going on? Because you would act in a similar manner
if you were a dealer bidding at a public auction. You can see both sides of the market.
You have a good idea what you can resell the item for once you own it and you can
also see the price it is going for as the auction progresses. The perceived value, at that
moment in time, of the item being sold is soon realised. If the item is undervalued in
your view, you will soon bid-up the price. If you think the item is of poor value you will
not bid up the price resulting in a narrow spread in your price band, you are bearish or
negative on the item. On the other hand the Auctioneer's main interest is in selling the
items. Several years ago a good friend of mine asked me to attend a boat auction with
him. He had a small boat he had placed in the boat auction. The reserve was about
£15,500. The auctioneer started the bidding at £5,000. Very quickly somebody
accepted the bid, the bidding soon reached £9,500 from several unknown people
dotted around the room. At this stage my friend lent over to the auctioneer and in an
urgent whisper said "let it go". The auctioneer whispered back "don't be stupid, I haven't
had a bid yet!" This sort of action happens very frequently in the stock market. It is seen
time after time and is known as 'No Demand' mark-up. We assume this is done by the
market makers and pit traders.
At all times the market makers will have both buy and sell orders on their books, but the
principles of volume and its relationship to the price spread will always be there in
varying degrees. It is the turning points we are looking for, so we are looking for the
extremes of volume indication, coupled with the spreads and other logical conditions,
which will be pointed out later.
What is also very important to remember is that once you see weakness in the market
this weakness does not just disappear. The market may drift sideways or even start
going up, but because of the weakness in the background the market is certainly not
going very far. If this does happen, an astute trader will look for a no demand or up-
thrust trap to short on.
16
Chart 4.
How to detect 'No Demand'
Chart courtesy V SA Five
At point (a) we have a wide spread bar up, closing on the highs. Volume has increased
showing that professional money is behind the move. Is the move going to last?
The next three bars are up, however, it is the down bars that will tell you if the move is
going to continue up. At point (b) we see a down bar, the volume is less than the two
previous bars and is low volume. This immediately tells us that there is no selling from
professional money. If there is no supply then expect higher prices.
At point (c) we have exactly the same massage, The bar is down closing in the middle
on reduced volume.
Point (d) The first sign that all is not well. Volume has increased on this down bar.
Supply in the market has increased. As the market moved up to point (e) note that all
the bars except one is showing weakness. This is seen as up bars closing in the middle
or lows and/or the volume is not backing the move up, in fact it is low volume. This is
'no demand' No demand is especially noticeable at point (e) and at point (f) It is no
demand from professional money that causes a market to rollover on the tops giving
the chart the characteristic mushroom top. You will not notice this weakness because
the news will be still 'good'
At point (g) & (h) The market is up on volume less than the two previous bars (low
volume no demand) while the next bar is up closing in the middle (as they struggle to
17
catch the stops) There is no way a market can rally up and through an old trading top
and into new ground on 'no demand'
Chart five. Automatic indicators.
' 1999
Same chart as above but showing how a coroputerised system can pick this up.
I
,
r L~
~
6400
.
~.~.~ t~ r I
Lr
~
L I
.' ~I. 6350
~liL.~r.
t Lr
l~~~~ r I
6300
.1
~
L
.
-6250
6200
.~
Chart courtesy of V SA Five.
Indications of either strength or weakness appear as arrows either above the chart
pointing down [weakness] or below the chart pointing up [strength]. Signals appear
automatically once the high, low, close and volume has been added. Each bar is also
coloured either green or red as an ongoing indication of strength or weakness. No
formulas are used.
It is important to understand that the market makers do not control the market. They are
responding to market conditions as they appear, and taking advantage of opportunities
presented to them. Where there is a window of opportunity provided by market
conditions -panic selling or thin trading -they may see the potential to increase profits
through price manipulation, but they can only do so if the market allows them to. You
must not therefore come away with the idea that market makers control the markets. No
individual trader or organisation can control any but the most thinly traded of markets
for any substantial period of time.
For a market to move up you need buying, you need to see an increase in volume, not
a decrease [but not excessive volume, where supply may be swamping the demand] If
you observe that the volume is low as the market moves up you know this has to be a
false picture. This low volume is caused by the professional money refusing to
participate in the up move, usually because they know the market is weak.
18
.
J.
,;;r~r.1
The market may be moving up, but it does not have the participation of the traders that
matter. Unless they are interested in the move it is certainly not going very far. The
opposite is also true for down moves. The reason for the non-participation of the
professional money is that they have seen weakness in the background action. They
know the market is weak!
During a bear market you will frequently see temporary up moves on low volume. The
reason for the up move is of no concern to us, but we see a market that is bearish
going up on low volume. This can only happen because the professional money is not
interested in higher prices and is not participating, hence the low volume. The
professionals are bearish and have no intention of buying into a weak market just
because it happens to be going up. If this action is seen with a trading range to the left
[a top to previous action to the left on the chart at the same level) it is a very strong
indication of lower prices.
Chart six. Dow Jones industrial chart showing the simple logic on how to interpret volume. Any
time frame will show similar principles.
Chart courtesy V SA Five
In most cases the mark-up at (a) is quite deliberate and is likely to be on
'good news'. The mark-up usually starts off with a wide spread up early in the day. They
are trying to put full emphasis on the deception to draw as many buyers in as possible.
This also catches stop loss orders, shaking shorts out of the market. Any buyers on the
up-move can then hopefully be locked-in by sharp down moves later. There is nothing
sinister about all this, you would do exactly the same thing given the opportunity. This is
'trading' "if you cannot stand the heat, get out of the kitchen".
19
No demand up days/bars should not be viewed in isolation. No demand is seen after
professionals have seen weakness in the background. They know something you don't.
Point (a) There is a wide spread up closing on the highs, the news will be good. This is
fine until we look at the volume below. It appears to be high. If this is buying volume
why should the next bar be down? There is a possibility here that stock is being
transferred to potential weak holders. We need confirmation. This very soon arrives,
even on the next bar at point (b ). Here we have an up bar on greatly reduced volume.
This is 'no demand'. Professional traders have started to transfer sock to eager buyers.
We know this because every time there is a up move or up bar professional money
withdraws from the market. We can see this by looking at the low volume.
No demand is even more marked at point (c) You now have two confirmations that the
market is weak.
At point (d) here we see two up bars both on high volume. This is really a repeat of
point (a) Stock is being transferred from professional traders to uninformed traders who
are anticipating even higher prices. These traders are completely unaware of the
volume implications, and are probably buying on repeated 'good news'
Point (e) Here we have a early morning mark-up to catch a few stops and mislead as
many traders as possible. Whenever you see the high higher than the previous bar with
the same bar or the following bar closing lower than the bar at point (d), this action is a
sure indication of lower prices. Strong markets never have this type of price pattern. But
what really brings it to life is we have frequent low volume up bars in the background.
In a weak market you will usually see up moves giving the characteristic lower tops and
lower bottoms seen in a bear market. You can see these weak up moves because they
will inevitably have low volume up bars, usually closing in the middle or lows, and on
narrow spreads. This characteristic behaviour of a weak market is clearly seen at point
(f)
Point (g) we have two rapid wide spread down bars. This will lock many traders in at
higher prices.
Point (h) again the characteristic action of a weak market. Slightly different because
they are on narrow spreads as well as low volume. This is a double confirmation of
weakness ahead.
An Exception to the Low Volume Rule
They say that it is the exception that proves the rule, and there is an exception to this
one. This is one reason rigid mathematical rules run into trouble. The market is
dynamic, showing the action of human traders, but it still shows logic. Once the logic is
recognised the confusion disappears.
If there is a low volume up day on the very first day of any break-out from a genuine
accumulation area, the result is often a rapid one day up move from the accumulation
area on low volume. This is NOT a sign of weakness.
The wide spread up and out on the first day from a genuine accumulation area on low
volume is caused bya shortage of stock. In accumulating stock, as we saw earlier, the
trading syndicates would have removed most of the supply that is available at those
20
price levels. This low volume up move out of an accumulation area is therefore an
indication of strength. The difference is that you will have a buying phase during the
previous few days or bars, not signs of weakness.
Most up moves on low volume are a sign of weakness. However, try to recognize the reasons.
Genuine no demand, or low volume up-day/bar, always has market weakness in the
background which the professional money has seen.
chart courtesy VSA5
Point (a) is an up bar, note the price spread looks narrow, the volume is low. Bullish
bars do not look like this. The market falls rapidly on two bars, closing on the lows. This
will lock many traders in on the highs. This action looks weak but we need confirmation
that we are in a bear move.
~
This arrives at point (~ A bar gapped up by the market makers. We know this because
the volume is very low so this cannot be a genuine lasting up move. We can also see
that the low is slightly lower than the last low. The trend is down and it is always
inadvisable to trade against the trend of the market.
21
Point (c) again we have a narrow looking up bar, but here the volume is clearly high.
Markets do not like high volume on up bars, especially if the price spread is narrow.
Why? Because if the high volume had been buying volume why is the price spread
narrow? A narrow price spread shows that the professional traders have transferred
stock to potential weak holders supplying their buying spree throughout the day. This
action caps the top end of the market causing a narrow price range. On the following
two bars there is very little price gain. The market had stalled on the professional
selling.
Point (d) Throughout this book you will hear of professional traders going for the stops.
Above or below all actively traded stocks or future contracts, there are not hundreds of
stops, but thousands. To trigger these stops is a profitable manoeuvre. This activity
allows professional traders to trade away from the true value of the market at that
moment to their gain.
At point (d) is a classic example of an up-thrust, and a sign of weakness. Up-thrust
come in all shapes and sizes but the principles are always the same. Up-thrusts appear
after you have seen weakness in the background. The market is weak, profession
traders are expecting lower prices. Good news or a temporary lull in the market has
allowed market makers to mark up the price into the area where most of the stops have
been placed. This means that if you have stops in that area you are forced to buy
contracts away from the true value to cover your perfectly good short position.
It is always a good idea to look for confirmation on bars following any indication of
strength or weakness. At point (e) we have an attempt to go up which has failed. We
know this because the volume is notably low. This is no demand after a serious sign of
weakness.
The chart we have been analysing shows a bearish market, easy to see in hindsight,
with lower tops and lower bottoms. This causal observation however is not good
enough for us, because packed within this chart is a huge amount of information telling
us why the market is bearish. Admittedly easy to identify in hindsight bar by bar. The
important point is to keep in mind is that all the indications of weakness must have been
there in the first place, as the market was unfolding day by day. You will no doubt have
difficultiesf in analysing a chart as it unfolds bar by bar until you have trained your mind
to think like a predator rather than run and act with the Herd. Practically all these up
bars on this chart will be accompanied with 'good news' of some sort. If there is no
good news available the news media will simply make it up to explain away the sudden
up move taken place on any particular day. Your subconscious mind will be busy
absorbing this information whether you like it or not and forming an opinion. To the
untrained mind that view will be bullish, therefore you will not have even noticed volume
implications telling you otherwise. If all this sounds paranoiac to you perhaps you need
convincing. Try collecting all the 'good' news and 'bad' news articles from your
newspaper, record or take notes on television comments about the market. In three or
four months time go back and see what exactly happen on that news. You might be
surprised to find it is quite a good trading system to buy on all bad news and to sell on
all good news.
During a bear market volume is generally lower as prices fall. There are fewer traders,
professional money is not buying in sufficient amounts to make the volume even average,
because they are bearish. A marketmaker or specialist will never fight the market. He will take
advantage if possible, but will never fight the trend. If he does he will go bankrupt. If any up
22