Charging the Internal Combustion Engine P2 ppt
Bạn đang xem bản rút gọn của tài liệu. Xem và tải ngay bản đầy đủ của tài liệu tại đây (331.21 KB, 20 trang )
16 Basic principles and objectives of supercharging
Since the radial compressor will be discussed in detail in Chap. 5 in connection with exhaust
gas turbocharging and as part of the exhaust gas turbocharger, at this point its function will only
be addressed as the basis for its map characteristics.
All flow compressors are based on the physical principle of the transformation of kinetic
energy, which is supplied to the medium in the impeller, into a pressure rise via flow deceleration,
partially in the impeller, partially in a diffuser. The complete process between compressor inlet
and outlet can be clearly described using the first thermodynamic theorem for open systems:
w
C
=
v
2
2
2
−
v
2
1
2
+ h
2
− h
1
, (2.15)
where w
C
is the added specific compressor work, v
i
are the medium absolute flow speeds at
the intake (1) and outlet (2), and h
i
are the corresponding enthalpies. The latter describe the gas
condition, which enables, directly from Eq. (2.15), the calculation of the pressure and temperature
at the compressor outlet or the compressor work.
The danger of flow stalling exists in the flow compressor, as in the diffuser. Therefore, in a
single compressor stage, only a limited pressure ratio can be achieved. Since the radial compressor
enables the highest per-stage pressure ratios, it is the preferred choice for a compressor in exhaust
gas turbochargers. In this layout, the chargers can be of very compact design. Their disadvantage
in comparison to axial compressors is lower efficiency.
From all these facts it is clear that flow compressors show totally different map characteristics
compared with displacement compressors.
Additionally, all turbo compressors deliver continuously, except for the speed fluctuation at
the compressor impeller exit caused by the finite blade thicknesses. Although they thus generally
feature a better acoustic quality, radial compressors are also sometimes equipped with silencer
systems to eliminate these high-frequency noise excitations.
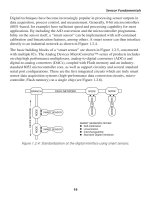
The map characteristics of turbo compressors can, then, be predicted as follows (Fig. 2.11).
There is an unstable area in the delivery map, which is located in the left sector of low flow
rates and which widens at higher pressure ratios. The pressure ratio obtainable also depends on the
delivery quantity. The borderline between stable and unstable delivery is called the surge limit.
The achievable pressure ratio will be about proportional to the speed squared and will thus
be limited by the maximum possible charger speed and by the maximum circumferential speed,
which itself is determined by the mechanical rigidity of the impeller.
Pressure ratio p
2
/p
1
surge limit
n
1
n
2
n
3
n
4
n
1
< n
2
< n
3
< n
4
Lines of constant
turbine speed
Volume flow V
.
Fig. 2.11. Principle pressure–volume flow map of a turbo compressor
at given charger speeds, with surge limit
2.6 Interaction between supercharger and internal combustion engine 17
The characteristic curves of constant charger speed reach the same pressure ratio in a wide
range, and thus they run horizontally despite different delivery quantity. The achievable pressure
ratio will decrease only with further increasing flow rates, due to incorrect flow into the impeller and,
if installed, diffuser blades. The speed curves drop in an increasingly steep decline to a maximum
flow rate value without pressure increase. This maximum value, also called choke limit, is attained
when the speed of sound is reached at the compressor intake.
It is important to note that in a turbo compressor, contrary to a displacement compressor, a
pressure increase must always be associated with a speed increase, and the maximum pressure
ratio is always reached at maximum speed of the compressor.
With this, the essential characteristics of displacement compressors and flow compres-
sors are defined, so that now the interaction with a reciprocating piston combustion engine can be
examined.
2.6 Interaction between supercharger and internal combustion engine
In order to be able to evaluate the interaction between the charger and the reciprocating piston
engine, it is necessary to develop the engine map similar to the charger map, i.e., how its air flow
depends on engine speed and charge pressure.
2.6.1 Pressure–volume flow map of the piston engine
In the pressure–volume flow map of the engine (Fig. 2.12), the x-coordinate also represents the
volume flow or the mass flow rate through the engine, and on the y-coordinate the pressure ratio
between cylinder and outside pressure at the start of compression is plotted.
Therefore, it is also of practical use to reference this engine map, that is, its pressure–
volume flow diagram, to the state at charger intake. Since in this scale the pressure–
volume flow map of the charger (or the supercharging system) and that of the engine (to be
supercharged) are identical, the interaction between charger and engine can be shown and evaluated
in it.
Two-stroke engine
The two-stroke engine has a relatively simple map, since both inlet and exhaust are open
simultaneously for extended periods of its gas exchange, i.e., around the bottom dead center.
This causes a flow-through or scavenge process which can be described rather easily. The inlet
Engine speed
Pressure ratio p
2
/p
1
n
1
< n
2
< n
3
< n
4
Volume flow V
.
Fig. 2.12. Principle pressure–volume flow map of a reciprocating pis-
ton engine for given engine speeds
18 Basic principles and objectives of supercharging
and exhaust port areas are substituted with a so-called equivalent area, which can be calculated as
follows:
A
red
=
A
In
A
Ex
A
2
In
+ A
2
Ex
, (2.16)
where A
In
describes the intake port area, A
Ex
the exhaust port area, and A
red
is the equivalent port
area. Further, a common flow coefficient µ
red
is defined in such a way that it results in the same flow
resistance as the series-connected inlet and exhaust areas. When the equivalent port area ∫A
red
dϕ
is integrated over the engine cycle, which is 360
◦
crank angle in the case of the two-stroke engine,
the mass flow function describes the volume flow map:
˙
V
1
= ψ
23
ρ
2
ρ
1
2RT
2
µ
red
∫A
red
dϕ
360
(2.17)
with the flow rate function
ψ
23
=
κ
κ − 1
p
3
p
2
2/κ
−
p
3
p
2
(κ+1)/κ
,
(2.18)
where µ
red
is the flow coefficient associated with the equivalent area A
red
, p
2
the charge or scavenge
pressure, and p
3
the exhaust backpressure at the engine flange.
As can be seen from Eqs. (2.17) and (2.18), the scavenged air or mixture mass depends only
on the backpressure at the exhaust port p
3
and the supercharger efficiency η
TC
, at given geometric
relations of the gas exchange ports and at a certain boost pressure (which influences the charge
density via T
2
).
Additionally, if the influence of the speed-dependent pulsation in the inlet and exhaust manifolds
on the pressure upstream and downstream of the equivalent area A
red
is neglected, there is no
difference if, within a cycle’s time period, the ports are opened seldom slowly or often rapidly.
This results in an approximately speed-independent air or mixture mass flow and therefore, at a
given backpressure, one singular engine operating curve only. Figure 2.13 schematically shows
the volume flow through a two-stroke engine, depending on the boost pressure ratio p
2
/p
1
and
the backpressure p
3
as parameters. For a specified power output, a specific air or mixture volume
flow
˙
V
1
is needed. However, if the pressure p
Ex
in the exhaust manifold changes, differing boost
pressures or boost pressure ratios must compensate for this to maintain the necessary pressure
gradient between inlet and exhaust, i.e., to assure
˙
V
1
under all conditions.
The bold line shown in Fig. 2.13 schematically represents the operating curve of a two-stroke
engine with exhaust gas turbocharging. With this type of supercharging, the exhaust backpressure
increases with increasing boost pressure, which is the reason for the steeper slope of the curve
compared to the case with constant backpressures obtained with mechanical supercharging.
Four-stroke engine
During the gas exchange process, the four-stroke engine works as a displacement compressor.
Therefore, its volume flow is also calculated based on speed, swept volume, volumetric efficiency,
and density ratio. However, its swallowing characteristics show a behavior contrary to that of a
turbine: The volume flow increases with increasing boost pressure, since aspiration takes place
at the precompression pressure p
2
. This is why in this map the swallowing-capacity functions
for constant engine speed are tilted to the right. For the four-stroke engine, the volume flow is
2.6 Interaction between supercharger and internal combustion engine 19
Flow rate with downstream
exhaust gas turbine
Pressure ratio p
2
/p
1
p
3
= 1.4 p
1
p
3
= 1.2 p
1
p
3
= p
1
Volume flow V
.
Fig. 2.13. Volume flows through the two-
strokeengine,depending onthe boost pres-
sure ratio p
2
/p
1
and the backpressure p
3
calculated from the aspirated air or charge, as well as the air or charge scavenged during valve
overlap.
Approximately, the following equation applies:
˙
V
1
= V
cyl
n
E
2
ρ
2
ρ
1
λ
vol
+ ψ
23
ρ
2
ρ
1
2RT
2
µ
red
∫A
red
dϕ
720
. (2.19)
In addition to the equation for the two-stroke engine, here λ
vol
designates the volumetric efficiency.
For supercharged four-stroke engines with larger valve overlap, the volumetric efficiency can
be calculated with good approximation by the following, empirical, equation:
λ
vol
∼
ε
ε − 1
T
2
313 +
5
6
t
2
, (2.20)
where ε is the compression ratio, T
2
is the temperature upstream of the inlet valve in kelvin, and
t
2
in degrees Celsius. The function takes into account the fact that with valve overlap there is
no reverse expansion of the residual gases, and it considers the heating of the charge air during
the intake process. The first term of Eq. (2.19) is proportional to the engine speed, the second is
dependent on the pressure ratio and the valve overlap, which is addressed via A
red
. A map of a
four-stroke engine with typical operation (swallowing) lines is shown in Fig. 2.14 with the engine
speed as parameter, for engines with and without relevant valve overlap.
Pressure ratio p
2
/p
1
n
1,E
n
2,E
n
3,E
n
4,E
V
s
V
s
V
s
V
s
Volume flow V
.
Fig. 2.14. Operation (swallowing) character-
istics of a four-stroke engine, as a function of
engine speed, with (dash lines) and without
(solid lines) valve overlap. The horizontal gap
between the two lines at a specified speed
corresponds to the scavenge part
˙
V
s
of the
total volume flow.
20 Basic principles and objectives of supercharging
2.6.2 Interaction of two- and four-stroke engines with
various superchargers
Since now the maps of both chargers and engines have been defined in a compatible way, it becomes
easy to show the interaction of various charger systems with two- and four-stroke engines and then
to evaluate the characteristics of each particular combination.
Four-stroke engine with mechanically powered displacement compressor
As can be seen in Fig. 2.15, at constant speed ratio between charger and engine, points of intersection
between charger and engine speed curves result in clearly defined pressure relations. On the one
hand, these increase slightly with increasing engine speed, on the other hand they depend on the
valve timing of the engine (small or large valve overlap with changed scavenging quantity through
the cylinder). Overall, the described combination results in an acceptable boost pressure in the
entire load and speed range of the engine and, with an approximately constant torque curve in the
engine speed range, also satisfies the requirements for automotive applications.
In order to cover the total load range of the engine, the boost pressure must be continuously
adjustable between ambient and maximum possible pressure. Regarding the control mechanisms
it should only be mentioned here that the displacement compressor, due to the fact that its char-
acteristic curves are very similar to those of the engine, offers good control conditions, since only
relatively small differential quantities between charger delivery and engine air demand have to be
blown off at partial load or have to be governed. The corresponding control aspects are covered in
depth in Sect. 4.3.
Four-stroke engine with mechanically powered turbo compressor
Here the combined pressure–volume flow map (Fig. 2.16) also provides information about the
engine characteristics that can be expected. At an assumed constant ratio of charger to engine speed,
it can be recognized that only very limited load demands can be met with such a combination of
engine and supercharger.
With increasing engine speed, boost pressure increases parabolically, which is suitable for
applications where the engine is used in combination with an aero or hydro propeller drive (e.g., a
ship or aircraft propeller) or in steady-state operation close to its rated speed.
Applications with engine operation in a wide map range, e.g., automotive applications, are only
reasonable with the use of a variable speed ratio for the charger drive, as it is shown in Fig. 2.17
with a continuously variable ZF-Variomat transmission.
1
Pressure ratio p
2
/p
1
n
E
n
C
n
E
n
E
3
n
C
n
C
3
n
C
n
E
constant
Operation lines
without
valve
overlap
with
valve
overlap
n
E
n
C
Volume flow V
.
Fig. 2.15. Combined pressure–volume flow map of
a four-stroke engine with mechanically powered
displacement compressor
2.6 Interaction between supercharger and internal combustion engine 21
1
n
E
n
E
n
E
n
E
n
C
1
4
n
C
n
E
n
C
n
C
1
4
1
2
1
2
3
4
n
C
3
4
constant
surge limit
operation line
Pressure ratio p
2
/p
1
Volume flow V
.
Fig. 2.16. Combined pressure–volume flow
map of a four-stroke engine with mechanically
powered turbo compressor with constant speed
ratio
Volume flow V
.
1
[m
1
/s]
n
C
n
C
n
E
n
E
n
E
n
C
n
C
n
C
n
C
n
E
n
E
n
E
,
C
Engine swallowing
capacity function
Pressure ratio p
2
/p
1
[–]
3.0
2.8
2.6
2.4
2.2
2.0
1.8
1.6
1.4
1.2
1.0
0 0.05 0.10 0.15 0.20 0.25 0.30 0.35
1000 min
–1
2000 min
–1
3000 min
–1
40000 min
–1
50000 min
–1
Fig. 2.17. Pressure–volume flow map of a four-stroke engine with turbo compressor and variable speed ratio of the charger
drive via ZF-Variomat
With turbo compressors, control measures may become necessary due to their instable map
area. However, they are in any case necessary to adapt the boost pressure for part-load operation.
They are far more complex than for displacement compressors, since boost pressure changes can
only be achieved via changing the charger speed, e.g., by a change of the charger transmission
22 Basic principles and objectives of supercharging
Fig. 2.18
1
Engine swallowing
capacity curve
n
C
2
n
C
Full load
Pressure ratio p
2
/p
1
Fig. 2.19
Engine swallowing
capacity curve
n
C
n
C
n
C
Pressure ratio p
2
/p
1
n
C
Volume flow V
.
1
Volume flow V
.
C
Fig. 2.18. Pressure–volume flow map of a two-stroke engine with mechanically powered displacement compressor
Fig. 2.19. Pressure–volume flow map of a two-stroke engine with mechanically powered turbo compressor
ratio. (In Sect. 4.3, the corresponding control measures and mechanisms are described for charger
types in production today.)
Two-stroke engine with mechanically powered displacement compressor
In the past, the combination of a two-stroke engine with a mechanically powered displacement
compressor (Fig. 2.18) was frequently realized by using the lower side of the piston of large cross-
head engines as a scavenging or supercharge pump. Today, this design is applied only in very rare
cases, since its complexity is significantly higher than in the case of other supercharging concepts.
Two-stroke engine with mechanically powered turbo compressor
As Fig. 2.19 shows, the combination of a two-stroke engine with a mechanically driven turbo
compressor meets the requirements of various applications, e.g., either in a propeller drive or
for stationary gen sets. The torque characteristics and the required torque demand from a ship’s
propeller as a flow engine correspond by principle very well. It has to be considered, however,
that any acceleration creates an additional need for torque, which can hardly be covered with the
possible operations curves of this engine-charger combination.
3 Thermodynamics of supercharging
3.1 Calculation of charger and turbine performance
Basic knowledge of thermodynamic processes in combustion engines is assumed for full under-
standing of the following chapter. Only interrelations important for supercharging itself will be
discussed.
In general, a change in state during the (pre)compression of combustion air, i.e., a polytropic
compression, leads to an increase in the temperature of the charge due to
– the isentropic temperature increase during compression, and
– the losses associated with the compressor efficiency, which finally will result in a polytropic
change of state for the actual compression process.
For technical compressors, this temperature increase is used to calculate efficiency.
T
2s
= T
1
p
2
p
1
(κ−1)/κ
, (3.1)
T =
T
2s
− T
1
η
s-i,C
(3.2)
or
η
s-i,C
=
h
2s
− h
1
h
2eff
− h
1
, (3.3)
and under the simplifying assumption of an ideal gas with constant specific heat, the following
applies:
η
s-i,C
=
T
2s
− T
1
T
2eff
− T
1
. (3.4)
The isentropic specific compression work can be calculated by applying the fundamental laws of
thermodynamics as
w
s-i,C
=
κ
κ − 1
RT
1
p
2
p
1
(κ−1)/κ
− 1
. (3.5)
Then, the real compressor power output can be determined as
P
C
=
˙m
C
w
s-i,C
η
s-i,C
η
m,C
, (3.6)
where η
m,C
is the mechanical efficiency of the compressor (bearing, transmission, sealing).
To describe the pressure ratio p
2
/p
1
, i.e., the ratio between start and end pressure of the
compression, the symbol is frequently used:
= p
2
/p
1
. (3.7)
24 Thermodynamics of supercharging
3.2 Energy balance of the supercharged engines’ work process
3.2.1 Engine high-pressure process
Now we will examine the actual thermodynamic process, the so-called high-pressure process of
the engine, in which the mechanical cylinder work is generated. The constant-volume cycle serves
as thermodynamically ideal reference cycle. Then heat is supplied instantaneously and completely
at top dead center of the piston movement. This cycle yields the maximum attainable efficiency of
a combustion engine at a given compression ratio.
η
thω
= 1 −1/ε
κ−1
(3.8)
or
η
thω
= 1 −
p
1
p
2
(κ−1)/κ
. (3.9)
It can be seen that in this case the thermal cycle efficiency depends only on the compression ratio,
and not on the supplied heat quantity and therefore the engine load. For the analysis of the real
engine nowadays so-called thermodynamic cycle simulations are commonly used (see Sect. 3.6).
3.2.2 Gas exchange cycle low-pressure processes
These processes, or cycle parts, describe the charge exchange as well as the exhaust gas energy
utilization for charge precompression and thus the technical processes of related supercharging.
With the principle layout in mind, looking at the pV- and the TS-diagram (Fig. 3.1) of a mechanically
supercharged ideal engine, three significant facts can be identified.
As a consequence of the cycle, at the end of the expansion (working) stroke (4) the pressure
in the cylinder of a supercharged four-stroke engine is higher than the ambient pressure p
1
(5-6).
However, this higher pressure cannot be transformed into work directly in the cylinder, due to the
fact that the end of expansion is given by its geometric limitation. Therefore, an attempt must be
made to exploit this pressure outside of the work cylinder.
Since the boost pressure is higher than ambient pressure, the gas exchange itself positively
contributes to the engine work.
C
abc
Engine
Volume V
Pressure p
Temperature T
Entropy S
Fig. 3.1. Principle layout (a), pV (b) and TS diagram (c) of a mechanically supercharged ideal engine
3.2 Energy balance of the supercharged engines’ work process 25
Pressure p
Volume V
recoverable
precompression work
V
0
V
cyl
Isentropy
Fig. 3.2
Volume V
Fig. 3.3
Pressure p
Fig. 3.2. Recovery of a part of the precompression work as crankshaft work
Fig. 3.3. pV diagram of a supercharged engine illustrating the reclaimable exhaust gas energy (area 5z-5a-1b)
Without efficiency losses, this work would approximately correspond to the compression work
(charge exchange loop 1-5-6-7).
In return, however, the compressor work must be provided by the engine itself. The specific
compression work which has to be employed is calculated for an isentropic ideal case according
to Eq. (3.5), while – also idealized – the gas exchange work gained, w
GEX
, is calculated with
Eq. (3.10):
w
GEX
= (p
2
− p
1
)V
cyl
(3.10)
Accordingly, in the case of mechanical supercharging not the total charger work w will be lost,
but only the difference
w
s-i,C
− w
GEX
= w. (3.11)
This process can be understood as positive work output of the working piston during the intake
stroke, during which the boost pressure p
2
(which is higher than the ambient pressure) acts on the
piston. Thus a part of the precompression work can be recovered as crankshaft work, as Fig. 3.2
shows schematically.
3.2.3 Utilization of exhaust gas energy
Due to the geometrically given piston movement in a reciprocating piston combustion engine on the
one hand, and on the other due to the thermodynamic cycle of the combustion process, the pressure
at the end of the expansion stroke (5z) is significantly higher than the pressure at compression start
of the high-pressure cycle (1z), as was described in Sect. 3.2.1 and shown in Fig. 3.3.
The energy available in the exhaust gas at the end of expansion in the high-pressure cycle (5z,
5a, 1b) therefore cannot be utilized in the working cylinder of the combustion engine itself but
rather in a suitable downstream process.
Such a downstream process favored today is the recovery of the remaining exhaust gas energy
via a so-called exhaust gas turbine. In it, a flow turbine uses the exhaust gas expansion energy to
power a flow compressor located on the same shaft, which itself precompresses the combustion air
before intake into the work cylinder.
There are several possibilities for the use of the remaining exhaust gas energy. The energy
transport from the cylinder to the turbine is important, i.e., the design of the exhaust manifold.
26 Thermodynamics of supercharging
With a careful layout of the exhaust system, the utilization of the exhaust gas energy can be
maximized.
The corresponding optimization of such systems, i.e., the complex flow conditions around the
exhaust valve, including the area of the exhaust port of a two-stroke engine, demand comprehensive
tests and/or simulations. Only today’s availability of three-dimensional (3-D) mathematical simula-
tion models with sufficient precision makes it possible to study these topics with adequate accuracy
by means of numeric methods.
The aim is the optimum layout of the valve arrangement in combination with an exhaust
manifold designed under gasdynamic aspects, so that maximum pressure recovery can be obtained,
while at the same time the pressure gradient upstream of the turbine is minimized.
The complex issue of exhaust gas energy utilization via exhaust gas turbocharging is a very
central and substantial item in the field of supercharging. Therefore, the simulation-related themes
are covered intensively in Sect. 3.6, and those of the thermodynamic as well as flow design in
Chap. 5.
3.3 Efficiency increase by supercharging
3.3.1 Characteristic values for the description of the gas exchange
and engine efficiencies
Chain of engine efficiencies
In order to clarify those relations, which ultimately will lead to the actual, so-called effective
efficiency of a combustion engine, in the following the efficiency definitions of internal combustion
engines are described.
The brake or effective efficiency η
eff
,
η
eff
= W
eff
/Q
F
, (3.12)
covers the sum of all losses in an internal combustion engine and can therefore be defined as the
ratio between the brake effective work delivered and the mechanical work equivalent of the added
fuel. In order to be able to evaluate and, if needed, minimize the losses individually, this total
efficiency is generally subdivided into the following subefficiencies.
The fuel combustion rate η
F
η
F
=
Q
F
− Q
F,u
Q
F
, (3.13)
is defined as the ratio of burned fuel energy to added fuel energy, Q
F
. It is especially useful for
gasoline engines, which are operated at rich air-to-fuel ratios. The fuel energy not utilized is called
Q
F,u
.
The indicated efficiency η
i
,
η
i
= W
i
/Q
F
, (3.14)
is the ratio between the indicated work (based on the cylinder pressure curve) and the heat equivalent
of the added fuel.
3.3 Efficiency increase by supercharging 27
The process efficiency η
th
,
η
th
=
Q
add
− Q
diss
Q
add
, (3.15)
reflects to what extent the added heat could be converted in a theoretical reference cycle, e.g., in a
constant-volume cycle or a mixed constant-volume–constant-pressure cycle (Seiliger cycle). Here
Q
add
describes the added heat and Q
diss
the removed heat quantity. Thus, the theoretical efficiency
characterizes the maximum of mechanical work which would be extractable from a given heat
quantity, Q
F
η
th
= W
th
.
The cycle efficiency factor η
cyc
,
η
cyc
= W
i
/W
th
, (3.16)
contains all internal losses of the high-pressure as well as the low-pressure or gas exchange cycles,
e.g., the influence of the real instead of the ideal gas characteristics, the residual gas, wall heat, and
work gas losses as well as the gas exchange losses. Due to the latter, it is nowadays mostly further
subdivided into a cycle efficiency factor for the high-pressure part of the cycle and one for the gas
exchange cycle, i.e., the low-pressure part, with η
cyc,HP
as the term for the high-pressure cycle and
η
cyc,GEX
as the term for the gas exchange. As a benchmark for comparison, again the work W
th
attainable in the theoretical comparison cycle is used. The cycle efficiency factor describes to what
extent the efficiency of the real process approaches the value of the theoretical reference cycle.
The mechanical efficiency η
m
,
η
m
=
bmep
imep
=
bmep
bmep + fmep
, (3.17)
is defined as the ratio of effective to indicated power or work and thus is also defined as the ratio of
brake to indicated mean effective pressure. Finally, the following chain of efficiencies is obtained:
η
eff
= η
F
η
th
η
cyc
η
m
. (3.18)
Gas exchange characteristics
The charge or gas exchange cycle significantly affects the operating behavior of the engine. In
a four-stroke engine, this process primarily takes place during the exhaust and intake strokes, in
a two-stroke engine close to the piston bottom dead center, while the ports are opened. In order
to describe the quality and the characteristics of this process, ratios are defined which enable a
comparison of the gas exchange cycles of various engines. These ratios, which characterize the
volumetric filling of the cylinder with fresh gas, can be measured only in part directly or indirectly,
often with great difficulty, and in part they can be calculated only.
The air delivery ratio λ
a
represents an important factor, since it compares the total effective
volume flow through the engine with the theoretical flow, which is calculated from the displacement
and the number of combustion cycles per unit of time.
λ
a
=
˙
V
V
tot
n
WC
=
m
in
m
th
, (3.19)
where n
WC
= n for two-stroke engines and n
WC
= n/2 for four-stroke engines.
28 Thermodynamics of supercharging
This volume flow
˙
V can now be measured directly at the intake into the engine air supply
system, e.g., with calibrated gas meters (normally in combination with large compensating plenums;
see Chap. 10). Since the state of gas at this engine intake is practically identical to the ambient
conditions, while on the other hand, especially in supercharged engines, pressures and temperatures
are significantly different in the intake plenum, from which the engine aspirates the fresh charge,
we differentiate between an ambient-related and an intake manifold-related air delivery ratio. In the
former case, the volume flow at ambient conditions is measured directly, in the latter case the mean
pressure and temperature in the plenum are used for the calculation of this ratio. The conversion
from the ambient-related to the manifold-related value can be done in the following way:
˙
V
IP
=
˙
V
amb
ρ
amb
ρ
IP
. (3.20)
It is important to choose the measuring point in the intake manifold or the air plenum (IP) care-
fully so that representative conditions are measured (no local heat increases, no areas with flow
separation, etc.). With the intake manifold-referenced air delivery ratio determined in the described
manner, it is possible to compare measured results from various engines and also to compare
simulated values with test bench data. In regard to their gas cycle quality, it is even possible to
compare supercharged engines – with and without charge air cooling – to naturally aspirating
engines.
It must be considered, however, that the differing temperature level of the fresh gas, both of
engines with and without charge air cooling, may lead to differing heat flows in the intake manifold
and port. Thus, in a highly supercharged engine without charge air cooling, the gas temperature
can be significantly higher in some cases than the manifold wall temperature, so that the charge
is cooled down between intake plenum and intake valve, which influences the volume flow at the
valve significantly. In engines with charge air cooling, the fresh gas temperature will possibly be
close to the water temperature and thus the intake port temperature, while in naturally aspirating
engines the charge may be significantly heated up in the intake manifold and intake port, especially
at low speeds.
Finally, in gasoline engines, the type of mixture formation – carburator, single- or multipoint
injection, and cylinder direct injection – and the layout of the mixture formation components have
to be considered. Since in the real engine, fresh gas losses may occur during the gas exchange (in
the four-stroke engine and especially in the two-stroke engine, the inlet and outlet control devices
are in part open simultaneously), the air delivery ratio alone cannot adequately describe the quality
of the gas exchange. For that the volumetric efficiency λ
vol
can be used, which compares the fresh
gas mass captured in the cylinder – again related to ambient or intake manifold conditions – with
the cylinder displacement,
λ
vol
= m
fA
/m
th
. (3.21)
This value characterizes the remaining fresh gas mass after the gas exchange cycle and thus is,
among other things, a decisive factor for the attainable power. Especially for gasoline engines with
external mixture formation, this value is additionally influenced by the added fuel vapor or inert gas
(due to exhaust gas recirculated), so that a so-called mixture-related volumetric efficiency has to
be distinguished from the air volumetric efficiency. The relationship between the two values is
determined by the mass fraction of the fuel and the corresponding density of this medium at intake
manifold conditions. Under the assumption of identical density for combustion gas or vapor and
3.3 Efficiency increase by supercharging 29
fresh air, the mixture volumetric efficiency can be approximately calculated by modifying the air
delivery ratio according to the fuel mass fraction corresponding with the fuel-to-air ratio:
λ
vol,mix
=
m
A,cyl
+ m
F,cyl
m
th
. (3.22)
But all these volumetric efficiency values can be determined experimentally, directly or indirectly,
only with great difficulty (e.g., concentration measurements using tracer gases). On the other hand,
cycle and cfd (computational fluid dynamics) simulations can provide very detailed information
about these values. With such simulations it is also possible to optimize the gas exchange cycle in
regard to those very relevant figures. Further ratios that are also very relevant for the gas exchange
as well as the operational behavior of the engine, are the following:
scavenging ratio
λ
S
=
m
fA
m
fA
+ m
RG
, (3.23)
amount of residual gas
ϕ
RG
=
m
RG
m
fA
+ m
RG
, (3.24)
scavenging efficiency of the engine
=
m
fA
m
fA
+ m
S
. (3.25)
The scavenging ratio (not to be mixed up with the scavenging air delivery ratio used for the
description of the scavenging cycle of two-stroke engines [126]) specifies the ratio of the fresh gas
mass trapped in the cylinder to the total cylinder charge mass. The amount of residual gas specifies
the ratio of the gas remaining in the cylinder after the gas exchange process to the total cylinder
charge mass. And the scavenging efficiency specifies that part of the total aspirated fresh gas mass
which is captured in the cylinder after the gas exchange. Thus, the latter term represents a very
characteristic value for the two-stroke scavenging process. Here, high scavenging efficiencies have
to be aimed for to optimally utilize the fresh gas provided by the scavenging pump or blower.
It should be mentioned that the amount of residual gas is decisively dependent on the design and
firing order of the engine. In both a two-stroke and a four-stroke engine, the amount of residual gas is
strongly influenced by the blow down pressure pulses of the cylinders following in the firing order.
The amount of residual gas can be significantly reduced, e.g., by means of an optimized exhaust
manifold layout (connection of cylinders with sufficient angular firing distance, pulse converter,
resonance exhaust manifold). Especially in gasoline engines, in view of knocking stability, the
achievable engine brake mean effective pressure can be increased by such measures. On the other
hand, in modern gasoline and diesel engines, increased amounts of residual gas are desirable in
order to achieve a dethrottling effect at partial load (gasoline engines), as well as to influence the
combustion temperature and fuel combustion rate with regard to the NO
x
formation in the engine.
For this as well, the amount of residual gas may be used as a suitable characteristic figure.
Finally, the relationship between volumetric efficiency, air delivery ratio, and scavenging
efficiency is as follows:
= λ
vol
/λ
a
. (3.26)
30 Thermodynamics of supercharging
3.3.2 Influencing the engine’s total efficiency value via supercharging
On the basis of these efficiency relationships we can now answer the question why, for a particular
power output, a supercharged engine has a better effective efficiency than a naturally aspirated en-
gine. A decisive factor is that for many reasons – e.g., the hydrodynamics of bearing and piston
lubrication – the friction mean effective pressure increases with increasing speed, but only to a
small extent with increasing load. Already on the basis of the equation for the mechanical efficiency
(3.17), its dependence on the engine load is very obvious. This will be demonstrated with the
following simple example.
We assume two engines of identical horsepower at a given speed, one of which is a nat-
urally aspirated engine which reaches the required horsepower at a brake mean effective pres-
sure of bmep = 10 bar. The other is a correspondingly smaller supercharged engine which
reaches the same horsepower at a brake mean effective pressure of 20bar. For the naturally
aspirated engine, let the friction mean effective pressure be fmep = 2 bar. For the supercharged
engine, due to the larger dimensions of its bearings etc. corresponding to the increased cylinder
pressures associated with supercharged operation, let the friction mean effective pressure be
2.2 bar.
The result of this is:
– naturally aspirated engine: η
m
= 10/(10 + 2)[bar] = 83%
– supercharged engine: η
m
= 20/(20 + 2.2)[bar] = 90%
As a result of the higher specific load, the calculated mechanical efficiencies show a significantly
better value for the supercharged engine, as is also shown in Fig. 3.4. Therefore, a very important
relationship can be established between engine load and the effective efficiency:
The higher the load – read: the brake mean effective pressure – required for an engine to reach
a given horsepower, the better its effective efficiency. Figure 3.5 shows this interrelationship for
two medium-speed diesel engines of equal horsepower, with and without supercharging and at two
speeds.
90
80
70
60
50
1/4
naturally
aspirating
engine
turbocharged
engine
1/2 3/4
Load
Fig. 3.4
Mech. efficiency η
m
[%]
4/4
Power P
250 min
–1
500 min
–1
Fig. 3.5
BSFC [g/kW h]
Fig. 3.4. Advantage in mechanical efficiency of the supercharged engine in comparison to the naturally aspirated engine
Fig. 3.5. Fuel consumption values of two medium-speed diesel engines of equal horsepower with (solid curves) and
without (dash curves) supercharging, showing significant advantages for the supercharged engine [159]
3.4 Influence of supercharging on exhaust gas emissions 31
In comparison to this, the other efficiency factors are barely influenced by supercharging, since,
due to the change of density of the intake air, the flow and thermodynamic conditions are influenced
only to a minor extent.
3.4 Influence of supercharging on exhaust gas emissions
It must be considered that, especially for a diesel engine, the combustion cycle and, thus, the
achievable efficiency of the engine are more and more influenced by the exhaust gas emission
limits regulated by law. It is therefore necessary to briefly discuss the various test procedures
which are used for different vehicle categories in various countries to quantify their pollutant
emission level.
For passenger cars and light-duty trucks (ldv, light-duty vehicle), transient tests with the
complete vehicle, derived from actual driving patterns, are used today, like the so-called ftp
Velocity v [mph]
Velocity v [mph]
Time t [s]
Time t [s]
0–505 s = cold start phase 506–1,372 s = transient phase
1,373–1,877 s = hot start phase
Fig. 3.6. ftp Cycle from the u.s. exhaust emission regulations for passenger cars and light-duty trucks
Velocity v [km/h]
Part 1
(ECE = City-driving cycle)
Part 2
(EUDC)
Time t [s]
Fig. 3.7. European nedc for passenger cars
32 Thermodynamics of supercharging
Cycle (Federal Test Procedure; Fig. 3.6) or the European nedc (New European Driving Cycle;
Fig. 3.7).
Due to the wide variety of designs, pure engine test cycles are used for medium and heavy
trucks, some stationary, like ece R 49 (Fig. 3.8) and the new Euro-3-test (Fig. 3.9), some transient,
like the Fige-3-transient test – an enhancement to the Euro-3-test – for engines with particulate
filter or for gas engines (Fig. 3.10). Under these test conditions, the following statements generally
valid can be formulated for the various combustion processes.
Engine load [%]
Rated speedIdle speed Engine speed
Speed at max. torque
Fig. 3.8. ece-R-49 stationary test cycle for trucks until 1999 (Euro
0 to Euro II)
Load
Load [%]
Max. Load
Idle speed
Engine speed
ab
30%
Engine speed [%]
Additional
measurement
points at free
choice of the
inspector
of max. load
50%
of max. load
Fig. 3.9. Euro-3 truck test cycle: a test speeds, b load points with weighting
3.4 Influence of supercharging on exhaust gas emissions 33
80.0
60.0
40.0
20.0
0.0
1 201
In town Rural road Highway
401 601 801 1,001
Driving time t [s]
Velocity v [km/h]
1,201 1,401 1,601
Fig. 3.10. Fige-3transienttestcycle for en-
gines with particulate filter or for gaseous-
fuel engines, or generally as of Euro IV
3.4.1 Gasoline engine
For the gasoline engine, the problem of exhaust gas aftertreatment has been solved to a major extend
by the introduction of the λ-controlled three-way catalyst (twc). Further emission reductions,
down to sulev (super ultra low emission vehicle) specifications, can be achieved mainly by
improving the cold start phase, in which today about 80–85% of the total cycle emissions are
generated, by means of an improved catalyst light-off, and by reduced raw emissions during the
cold start.
In a gas engine, at least for trucks, lean operation can be a fuel-efficient alternative. However,
λ values of at least 1.6–1.8 must be drivable reliably and with low residual methane emissions, i.e.,
with good combustion quality. The gasoline direct-injection engine (gdi), which was introduced
to series production at the end of the nineties, essentially shows the same exhaust gas problem
areas as the direct-injection diesel engine.
3.4.2 Diesel engine
The classic diesel combustion process – like the gdi process just mentioned – always operates with
(sometimes substantial) excess air. This eliminates the possibility of using three-way catalysts as
described above. Critical emissions are particulate matter (PM), NO
x
as well as CO and HC
emissions.
In heterogeneous combustion, soot must and will always result to some extent as a combustion
end product, so that substantial generation of particulate matter cannot be avoided. The soot emis-
sion, and with it a part of the particulate matter emission, depend on the combustion air ratio. With
a suitable layout of the supercharging system, a supercharged engine can be operated with high
excess air ratios in all load ranges – even at full load – so that the preconditions for low particulate
operation are better with a supercharged engine.
With excess oxygen, the flame temperatures are also always high, inevitably leading to high
nitrogen oxide formation. Since the NO
x
generation depends to the power of 4 on the tem-
perature prevailing at the point of its formation, primarily local temperature peaks in the combus-
tion chamber must be avoided to prevent NO
x
emissions. This can best be done by operating
the engine with high excess air ratios or by diluting the charge with inert gas. In the diesel
34 Thermodynamics of supercharging
engine, this can best be realized through the recirculation of cooled, oxygen-depleted exhaust
gas.
Furthermore, since supercharged engines are operated with relatively high compression end
pressures and temperatures, they can be operated with significantly later injection start and longer
injection duration than naturally aspirated engines of the same power. This also contributes to the
avoidance of locally high combustion chamber temperatures, without significantly increasing fuel
consumption.
In a diesel engine, CO and HC emissions are uncritically low.
The test procedures and emission standards for passenger cars, trucks, and stationary engines
valid in Europe, the United States and Japan are summarized in the appendix – Fig.A.1 and
Tables A.2 to A.5. For additional information, due to the extensive nature of the regulations as well
as test procedures and measurement instructions, it is referred to special literature and Codes of
Regulations.
3.4.3 Methods for exhaust gas aftertreatment
Regarding the methods for exhaust gas aftertreatment as well, we must refer the reader to the broad
spectrum of special literature, unless technical aspects specially related to supercharging demand
otherwise. This is the case when water injection, particulate filters as well as oxidation or NO
x
storage catalysts are applied.
With water injection, not only the temperature of the exhaust gases is lowered due to the
vaporization of the water in the combustion chamber but also the volume flow through the
turbine is increased. This results in a significant increase of the enthalpy of the turbine intake
gases, which itself can be used for a further increase in boost pressure or for a turbo-compound
operation.
If particulate filters are located in the high-pressure exhaust stream, upstream of the turbine,
they represent a considerable heat sink with undesirable consequences for load changes of the
engine. The same is valid for the application of oxidation or NO
x
storage catalysts if, for whatever
reasons, they are also located upstream of the turbine.
Locating all these aftertreatment systems downstream of the exhaust gas energy recovery
device, like an exhaust gas turbocharger or a compound turbine, at the most slightly increases
the exhaust gas backpressure and thereby reduces the reclaimable exhaust gas expansion pressure
ratio. Other disadvantages, especially during transient operation of such engines, also have to be
taken into account (e.g., extended warm-up periods).
3.5 Thermal and mechanical stress on the supercharged internal
combustion engine
3.5.1 Thermal stress
With increasing fuel quantity, i.e., energy, added to the cylinder, naturally the amount of heat
to be dissipated increases as well. The heat flows through the engine increase correspondingly.
Additionally, as is shown in Fig. 3.11, at higher degrees of supercharging and without charge air
cooling, the temperature of the charge air increases significantly, which results in further increased
engine thermal loads. Therefore, simultaneous to the strength calculations for new engine layouts
with the finite-elements (fe) method, numerical cfd simulation tools must be used for the analysis
of the coolant and heat flows.
3.5 Thermal and mechanical stress on supercharged engine 35
Fig. 3.11 Fig. 3.12
Fig. 3.11. Temperature of the charge air depending on the pressure ratio, for varying intake temperatures and compressor
efficiencies, without charge air cooling
Fig. 3.12. Maximum temperatures for an assembled force-cooled piston for a medium-speed diesel engine
Only after consideration and analysis of all interactions by means of simulations, an optimum
overall concept can be achieved regarding weight and load capacity combined with sufficient cool-
ing at the smallest coolant circulation quantity possible.
The most important engine parts, besides the complete powertrain structure, are those loaded
with high heat flow density, i.e., the cylinder head, the piston, and the cylinder liner. Figure 3.12
shows the maximum operating temperatures of an assembled and force-cooled piston for a medium-
speed diesel engine.
3.5.2 Mechanical stress
With increasing boost pressure, compression end pressure and peak firing pressure are also in-
creased, as shown in Fig. 3.13 in a pV and a TS diagram for a naturally aspirated and an exhaust
gas turbocharged engine. The increasing pressures require the strengthening of certain parts or
to approach their limit of strength, e.g., connecting rod, piston, cylinder head and bearings. The
optimization of the entire powertrain of supercharged engines with regard to its strength becomes
more and more important and mandatory as the brake mean effective pressure increases. Today,
new engine designs are no longer feasible without the help of modern numerical simulations.
The strength-related optimization does not mean that supercharged engines have to be signif-
icantly heavier than naturally aspirated engines with comparable displacement.