How to Display Data- P9 ppsx
Bạn đang xem bản rút gọn của tài liệu. Xem và tải ngay bản đầy đủ của tài liệu tại đây (142.64 KB, 5 trang )
2.00
1.90
1.80
1.70
Height in metres
(a)
1.60
1.50
1.40
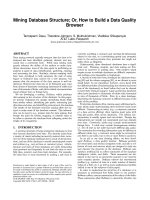
Figure 4.2 Dot plots of height of patients in the leg ulcer trial in metres (n ϭ 222):
3
(a) for all patients and (b) by sex.
2.00
1.90
1.80
1.70
Height in metres
(b)
1.60
1.50
1.40
Men (n ϭ 77) Women (n ϭ 145)
Displaying quantitative data 33
The heights, in metres, of the fi rst 10 men enrolled into the leg ulcer study
are as follows:
1.88, 1.78, 1.73, 1.93, 1.85, 1.75, 1.78, 1.78, 1.70, 1.65
Taking the fi rst number of the series above, the stem is 1.8, the leaf is 8
and the frequency for that row is 1:
Figure 4.3 shows a stem and leaf plot for the heights of all 77 men.
However, in this plot it can be seen that there is a lot of bunching par-
ticularly for the 1.7 stem. In this case and for other plots where there are few
stems and many individuals in each stem, the stems can be further divided,
such that each stem line represents a smaller interval. For the present case,
the stems can be divided to represent intervals of 5 cm as in Figure 4.4.
In all the stem and leaf plots above, the leaves are arranged in the order
of how the values occur in the data series and these are known as ‘as they
come’ stem and leaf plots. However, we recommend ordering the values in
Frequency Stem Leaf
1 1.8 8
Taking the next height, 1.78:
Frequency Stem Leaf
1 1.7 8
1 1.8 8
And the next height, 1.73:
Frequency Stem Leaf
2 1.7 83
1 1.8 8
And so on….
Frequency Stem Leaf
1 1.6 5
6 1.7 835880
2 1.8 85
1 1.9 3
34 How to Display Data
the individual stems as shown in Figure 4.5. The ordered stem and leaf plot
contains more information. For example given the sample size of the data set
it is a simple matter to work out the median. The median value is the middle
value when the data are ordered, such that half of the observations lie below
this value and half lie above it and is one of the basic measures of location.
4
In this case there are 77 observations and thus the median is the 39th value
Figure 4.3 Stem and leaf plot of the height of the male leg ulcer patients, with
stems of size 10 cm, n ϭ 77.
3
Frequency Stem Leaf
1 1.5 7
7 1.6 5833385
42 1.7 83588038838883888033553380008883858883350
25 1.8 8535333358888035000003800
2 1.9 31
Figure 4.4 Stem and leaf plot of the height of the male leg ulcer patients, with stems
of size 5 cm, n ϭ 77.
3
Frequency Stem Leaf
1 1.55- 7
3 1.60- 333
4 1.65- 5885
18 1.70- 303330333300033303
24 1.75- 858888888888558888858885
15 1.80- 333330300000300
10 1.85- 8555888858
1 1.90- 31
Figure 4.5 Ordered stem and leaf plot of the height of the male leg ulcer patients,
n ϭ 77.
3
Frequency Stem Leaf
1 1.55- 7
3 1.60- 333
4 1.65- 5588
18 1.70- 000000333333333333
24 1.75- 555558888888888888888888
15 1.80- 000000003333333
10 1.85- 5555888888
1 1.90- 13
Displaying quantitative data 35
(when the data are ordered), as 38 observations lie below this point and 38
lie above. Looking at Figure 4.5 it can be seen that the 39th value occurs in
stem 1.75 and the leaf value corresponding to the 39th value is 8. Thus the
median for these data is a height of 1.78 m.
A further point to note about these data is the digit preference exhibited;
all the leaves are either, 0, 1, 3, 5 or 8. The reason is that height was not meas-
ured in the study but provided by the patients. As most were elderly they gave
height information in feet and inches which was then converted to metric.
This sort of detailed examination of the data would not be possible from
a histogram (see next section). A stem and leaf plot resembles a histogram
turned over onto its side. The advantage of a stem and leaf plot over a his-
togram is that not only does it show the frequency in each stem but that it
retains the individual values of the data.
4.5 Histograms
A common method for displaying continuous data is a histogram. In order to
construct a histogram the data range is divided into several non-overlapping
equally sized bins (categories) and the number of observations falling into
each bin counted. The categories are then displayed on the horizontal axis
(X-axis) and the frequencies displayed on the vertical axis (Y-axis), as in
Figure 4.6. As with pie charts and bar charts the area of each bin is propor-
tional to the number of observations in the bin. Occasionally the percent-
ages in each category are displayed on the Y-axis rather than the frequencies
and it is important that if this is done, the total number of observations that
the percentages are based upon must be included in the graph. The choice
of number of categories is important as using too few categories results in
much important information being lost (Figure 4.6a); too many and any
patterns are obscured by too much detail (Figure 4.6b). Although there
are no hard and fast rules about the appropriate number of bins, usually
between 5 and 15 categories will be enough to gain an idea of the distribu-
tion of the data (Figure 4.6c).
From Figure 4.6c the different peaks for men and women can be clearly
seen. With these data it is better to display the heights for men and women
in separate histograms as in Figure 4.7. However, when using histograms
to display data from several groups, it is important to ensure that both
the axes are on the same scale for all charts. In doing this, it is then pos-
sible to compare directly between groups. If there are different number of
subjects in each of the groups then it is important that percentages or rela-
tive frequencies are displayed on the vertical (Y-axis) and not the frequen-
cies. For the height data displayed below, several points are immediately
Frequency
0
20
40
60
1.40 1.50 1.60 1.70 1.80 1.90 2.00
Height in metres(a)
(b)
1.40 1.45 1.50 1.55 1.60 1.65
Height in metres
1.70 1.75 1.80 1.85 1.90 1.95 2.00
0
5
10
15
20
25
30
Frequency
Figure 4.6 Histograms of height for leg ulcer patients:
3
(n ϭ 222) (a) with only
6 categories, (b) with 22 categories and (c) with 9 categories (see over).