Designing a Microsoft SharePoint 2010 Infrastructure Vol 1 part 16 docx
Bạn đang xem bản rút gọn của tài liệu. Xem và tải ngay bản đầy đủ của tài liệu tại đây (906.44 KB, 10 trang )
MCT USE ONLY. STUDENT USE PROHIBITED
Planning for Performance and Capacity 3-17
Lesson 2
Designing for Performance
It is important to recognize which performance factors you must measure to plan a
SharePoint Server 2010 deployment that meets the performance requirements of
your organization.
After modeling performance, you must also understand how to configure your
farm design and topology to change the performance profile of the farm.
Objectives
After completing this lesson, you will be able to:
• Map business requirements to solution performance.
• Map logical architecture and service application design to performance.
• Identify scaling options for improving SharePoint farm performance.
• Select a suitable topology for a SharePoint farm.
• Monitor SharePoint 2010 server performance.
MCT USE ONLY. STUDENT USE PROHIBITED
3-18 Designing a Microsoft® SharePoint® 2010 Infrastructure
• Identify steps in performance management modeling.
• Identify tools for performing performance testing.
• Identify caching options for performance improvement in SharePoint 2010.
MCT USE ONLY. STUDENT USE PROHIBITED
Planning for Performance and Capacity 3-19
Mapping Business Requirements to Performance
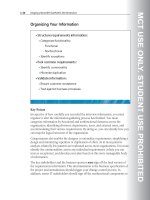
Key Points
There are four major aspects to sizing performance. The following sections
describe these aspects.
Latency
Latency is the time that elapses between the user performing an action and the
client receiving—and possibly displaying—the data. For example, it is the time that
elapses between the user clicking a link and the client displaying the destination
page.
Latency typically includes the time from the client sending a request to the server;
the server processing the client request; the server sending a response to the client;
and the client processing or rendering the response.
SharePoint 2010 latency can suffer in many different areas, including:
• Network latency, also referred to as round trip time (RTT).
• Available network bandwidth, which affects how long it takes to send back the
whole of the response.
MCT USE ONLY. STUDENT USE PROHIBITED
3-20 Designing a Microsoft® SharePoint® 2010 Infrastructure
• Uncompressed data transmission.
• Custom code elements, such as Web Parts or features that are not well
optimized.
You can only determine the server processing and client rendering elements of
latency through performance testing. However, you may have access to case
studies that can provide a benchmark to assist in determining general
requirements.
Throughput
Throughput is the number of requests that a server farm is able to process in a
fixed period. To create a SharePoint farm solution that satisfies user requirements,
you should:
• Estimate the expected load.
• Conduct performance testing against the suggested configuration.
You will often need to calculate workload to estimate the number of servers that
you require for adequate throughput. You can calculate workload by using a
worksheet to identify the number of concurrent users and the average number of
requests each day. The following table outlines an example worksheet.
Workload characteristics Value
Total number of users (Tu)
Total number of unique users each day
Concurrency rate (Cr)
Requests each day by each user
Peak usage ratio (Pu)
Hours in the business day (H)
You can then apply the following formula to estimate the number of requests per
second:
Requests per second = (Tu × Cr × Pu × Rd) ÷ (H × 3600)
In this formula, Tu is the total number of users, Cr is the average concurrent
number of users, Pu is the peak usage ratio, Rd is the average number of requests
MCT USE ONLY. STUDENT USE PROHIBITED
Planning for Performance and Capacity 3-21
each day by each user, and H is the number of working hours in the day. 3,600 is
the factor to convert hours into seconds.
Note: You should use peak user load—for example, the number of concurrent users at
peak times—to size the SharePoint farm to cope with peak performance requirements.
You can then estimate the different types of request to factor in medium or high-
cost CPU activities, which have a higher impact on workload. Use the following
formula to estimate weighted requests per second:
• Medium-cost CPU operations = 3 × low-cost CPU operations
• High-cost CPU operations = 5 × low-cost CPU operations
Data Scale
Data scale is the corpus of data or content that the server farm holds. Generally,
greater volumes of data reduce throughput, but data distribution across different
servers and storage media can also have an effect.
You can calculate data scale based on certain information about content storage, or
you can estimate data scale based on the storage requirements in your current
environment.
Certain data operations can also affect throughput or latency because SQL Server
invokes database locks to prevent conflicting operations.
Reliability
Typically, many administrators consider reliability as uptime. However, in the
context of performance management, reliability is a measure of the time for which
the farm can meet all performance targets. This should include coverage of peak
load times. Peak load times may be when the highest number of users are logged
on, or when search crawls are running, or when backup tasks are running.
Many organizations will have a reliability target that is expressed as a number of
nines. The following table shows some example reliability figures with the
corresponding calculated time value.
Reliability value Unacceptable performance time each month
99 percent (two nines) 7 hours
99.9 percent (three nines) 43 minutes
99.99 percent (four nines) 4 minutes
MCT USE ONLY. STUDENT USE PROHIBITED
3-22 Designing a Microsoft® SharePoint® 2010 Infrastructure
Question: How can you determine RTT for a network link?
Additional Reading
For more information about capacity planning for SharePoint 2010, see
MCT USE ONLY. STUDENT USE PROHIBITED
Planning for Performance and Capacity 3-23
Mapping Logical Architecture and Service Application
Design to Performance
Key Points
When you plan a SharePoint solution, it is important to understand the effect of
the logical architecture design on performance. Logical architecture choices such as
the number of Web applications or the number of site collections in a database can
have a dramatic effect on performance.
In SharePoint 2010, there are specific restrictions known as limits or boundaries:
• Limits. These are values beyond which users may experience degraded
performance. You can exceed threshold limits with a supported configuration,
although performance may be degraded. A configuration is not supported if
you exceed a supported limit.
• Boundaries. These are hard-coded maximum values that the system cannot
exceed.
SharePoint solution designs must take account of these limits to maximize
performance.
MCT USE ONLY. STUDENT USE PROHIBITED
3-24 Designing a Microsoft® SharePoint® 2010 Infrastructure
The following table shows Web application limits.
Limit Maximum value Restriction type
Content database 300 for each Web
application
Supported Limit
Zone 5 for each Web application Boundary
Managed path 20 for each Web
application
Supported Limit
Application pools 10 for each Web server Supported Limit
The following table shows site collection limits.
Limit Maximum value Restriction type
Web site 250,000 for each site
collection
Supported Limit
Site collection size (unless it
is the only site collection in
the database)
200 gigabytes (GB) Supported Limit
List view threshold 5,000 items (warning at
3,000 items)
Threshold Limit
Note: SharePoint 2010 can exceed supported limits, at the risk of degraded performance
and an unsupported farm configuration. SharePoint 2010 cannot exceed stated
boundaries. SharePoint 2010 can exceed threshold limits in a supported configuration,
but at the risk of degraded performance.
Service application design can affect the required performance of the design by
introducing additional hardware requirements. You can dedicate one or more
application servers to a service application if that service application requires
additional performance or places a high load on the farm.
Question: How can an organization create a single SharePoint farm to hold 1
terabyte of collaborative data, given that the content database size limit is 200 GB?
MCT USE ONLY. STUDENT USE PROHIBITED
Planning for Performance and Capacity 3-25
Additional Reading
For more information about the software boundaries and limits for SharePoint
2010, see
MCT USE ONLY. STUDENT USE PROHIBITED
3-26 Designing a Microsoft® SharePoint® 2010 Infrastructure
Scalability of SharePoint 2010
Key Points
You can scale SharePoint farms to meet performance targets in two different ways:
• Scale up. Scaling up involves changing the server hardware configuration to
increase the workload that a single server can accommodate. For example, you
can increase the number of processor cores in a server, increase the amount of
memory in the server, or upgrade the disk subsystem to use faster storage.
• Scale out. Scaling out involves adding more servers to the farm to achieve
capacity or performance targets. For example, you can add more database
servers to dedicate the search database load to another server.
Question: In addition to extra hardware costs, what other cost does scaling out
incur?