Hands-On Microsoft SQL Server 2008 Integration Services part 9 pps
Bạn đang xem bản rút gọn của tài liệu. Xem và tải ngay bản đầy đủ của tài liệu tại đây (358.53 KB, 10 trang )
58 Hands-On Microsoft SQL Server 2008 Integration Services
in the Data Flow Sources section and the OLE DB Destination appears in the
Data Flow Destinations section. There are several transformations components
listed in the Data Flow Transformations section, though none is used here. This
simple package shows a typical example of a data flow that contains a Data Flow
Source and a Data Flow Destination.
Finally, the Data Flow Destination, Destination—RawDataTxt, is an OLE DB
destination that loads the converted records to the RawDataTxt table in the
Campaign database.
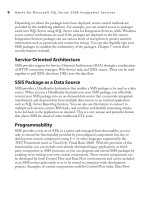
10. The data flow components of an Integration Services package expose their
properties in a custom user interface that is built for most of the components,
or in the Advanced Editor that is common to all the components. Some of the
components do not have a custom user interface, so they use only the Advanced
Editor to expose their properties and attributes. Sometimes you may have to
use the Advanced Editor even though the component has a custom UI, as some
components do not expose all the properties in the custom UI. You can open
the custom user interface by choosing the Edit command from the component’s
context menu and the Advanced Editor using the Show Advanced Editor
command. Right-click the Source—RawDataTxt_csv object and choose Show
Advanced Editor from the context menu.
11. You will see four tabs in the Advanced Editor. The Connection Managers tab
specifies SourceConnectionFlatFile connection manager that this component uses
to connect to the RawDataTxt.csv flat file. The Connection Manager field here
displays all the connection managers defined in the package.
12. Move on to the Component Properties tab. Here you will see the Common
Properties that specify properties such as Name and Description, and Custom
Properties sections.
13. Click the Column Mappings tab. In the upper half of this tab, you can see the
columns mapped by the mapping lines and the lower half lists these mapped
external columns with the output columns. External columns reference the data
columns read from the source text file and the output columns are the columns
this adapter passes on to the downstream data flow component. These output
columns will become input columns for the next component in the data flow.
14. You can change these mappings if you want an External Column to be redirected
to a different Output Column. Click the mapping line joining the AddressLine2
columns of Available External Columns and Available Output Columns and
press the key on your keyboard. Similarly, delete the mapping line
joining City columns. Now click and hold the mouse on the AddressLine2
column in the Available External Columns list and drag and drop it on the City
column in the Available Output Columns list. You’ve created a mapping line
to map AddressLine2 column to City column, which means the data in the
AddressLine2 column will be sent to City column. This can also be done in the
Chapter 2: Getting Started with Wizards 59
lower half of the window. Click the column that shows <Ignore>, just below City,
in the Output Column. The column is converted into a drop-down list box. Click
the down arrow to see the list of available columns and choose AddressLine2
from the list. As you do that, a mapping line corresponding to the affected
columns will be added in the upper section. Your mappings should look as shown
in Figure 2-11.
Figure 2-11 Working with column mappings
60 Hands-On Microsoft SQL Server 2008 Integration Services
Now right-click anywhere on the blank surface in the upper half and choose
Select All Mappings to select all the mapping lines. Again right-click and choose
Delete Selected Mapping. This will remove all the mappings, and the Output
Column in the lower half of the window shows <Ignore> in all the columns.
Again, right-click anywhere in the upper section and choose Map Items By
Matching Names. This will map all the corresponding columns together.
15. Open the Input And Output Properties tab, and you can see Flat File Source
Output and Flat File Source Error Output under Inputs and Outputs. Expand
the Flat File Source Output node to see External Columns and Output Columns.
As mentioned earlier, External Columns are the reference columns of the source
text file and Output Columns are the columns that Flat File Source Adapter
passes on to the downstream component in the data flow path. Expand External
Columns and click any column to see column properties such as CodePage,
DataType, and Length in the right pane.
Now expand Output Columns and click any of the columns; you will see the
Output Column properties such as CodePage, DataType, Length, FastParse,
SortKeyPosition, and so on. Note that the Data Type of External Columns and
Output Columns is [DT_STR] by default. The FastParse option can be set to
either True or False. To load data between heterogeneous data sources, the source
adapters parse the data of each column to convert it to SSIS data type, and when
the data is to be loaded into a data store, the destination adapter parses the data
and converts it to the type destination requires.
The two parsing techniques, Fast parse (when FastParse option is True) and
Standard parse (when FastParse option is False), are available in the Flat File source
and Flat File destination adapters and the Data Conversion and Derived Column
transformations. This is because only these data flow components convert data from
a string to a binary data type, or vice versa. The FastParse option allows use of simpler
(commonly used date and time formats), quicker, but locale-insensitive, fast parsing
routines. You can set FastParse to True on the columns that are not locale-sensitive to
speed up the parsing process. By default, FastParse is set to False, indicating Standard
parse is used, which supports all the data type conversions. For more information
on parsing techniques, refer to Microsoft SQL Server 2008 Books Online.
Click Cancel to return to the SSIS Designer.
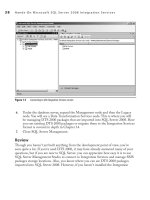
16. An OLE DB Destination loads input records into an OLE DB–compliant
data store. To explore its custom user interface, double-click the Destination—
RawDataTxt component. You will see the Connection Manager page shown
in Figure 2-12.
17. As the name suggests, an OLE DB Destination uses an OLE DB
connection manager to connect to the destination table. In this package,
DestinationConnectionOLEDB is used, which is specified in the OLE DB
Connection Manager field.
Chapter 2: Getting Started with Wizards 61
18. Click in the Data Access Mode field, and you’ll see the available five options for
data access in the drop-down list:
Table or view
c When you select this option, the data is loaded into a table
or view in the database specified by the OLE DB connection manager, and
you specify the name of the table or the view in the Name of the table or the
view field.
Table or view – fast load c Using this data access mode, you can load data
into a table or view as in the previous option, but using the fast load options
such as acquiring table lock and specifying maximum insert commit size.
Figure 2-12 Connection Manager page of the OLE DB Destination Editor
62 Hands-On Microsoft SQL Server 2008 Integration Services
Table name or view name variable c Using this option, you still load data
into a table or a view, but instead of specifying the table or view name directly,
you specify a variable that contains the table or view name.
Table name or view name variable – fast load
c is data access mode works
like Table or view – fast load access mode, except in this access mode you
supply the variable that contains the table or the view name.
SQL command
c You can load the result set of an SQL statement using
this option.
19. Go to the Mappings page and note that the Available Input Columns are mapped
to Available Destination Columns. Note that the Suffix column in the input
columns is not mapped to any destination column. You may have to scroll up and
down to see the mappings properly. Click Cancel to close the editor.
Review
This Hands-On exercise presented a simple package that contains various types of
components for you to see how Integration Services packages are organized. You’ve
seen how Control Flow manages workflow in a package and makes the required objects
available when they are required by Data Flow components. We haven’t tried to execute
this package because the package is not designed from a multiuse perspective. The
Execute SQL task creates a table in a Campaign database for the first time the package
is run, but what do you expect will happen if you again try to run the same package?
The package will not succeed, as the table that Execute SQL task tries to create in the
subsequent runs already exists, and the Execute SQL task attempt will fail, resulting in
failure of the package. If you want to run the package more than once, you could either
drop the table already created before trying to create it again or use TRUNCATE
TABLE command with the existing table instead of creating a new table.
It will be worthwhile to review the package you have created during the last Hands-On
when you exported data to an Excel file. I would encourage you to add it to this project
and explore its various components to get a feel for them. Don’t worry if they don’t
make much sense to you now, as each of the preconfigured components that SSIS
provides will be covered in detail in the chapters to come.
Last, if you still want to play a little bit more with BIDS and SQL Server Import
and Export Wizard, you can perform another Hands-On exercise using C:\SSIS\
RawFiles\RawDataAccess.mdb file to build an Integration Services package directly
in BIDS. To give you a hint, start the SQL Server Import and Export Wizard from
Project menu command and note that this time the wizard doesn’t give you an option
to save the package as it has done in the previous exercises.
Chapter 2: Getting Started with Wizards 63
Integration Services Connections Project Wizard
Just as you can use the SQL Server Import and Export Wizard to create a basic package
in BIDS that you can enhance later, Integration Services provides you another wizard
to quickly create a package with all the required connection managers. It allows you
to choose data providers and configure them to create connection managers. Once
configured, you can them select to use a connection manager as a source or a destination
or both. Finally, it creates a project with configured connection managers and a data
flow task containing defined sources and destinations. This can be very helpful as
creating connection managers is usually the first task when you’re creating a package.
You can invoke this wizard from File | New | Project and then choosing the Integration
Services Connections Project Wizard from the Visual Studio project templates.
Analyzing Data Quality
with the Data Profiling Task
During various stages of a data warehouse project, you’ll need to make sure that the
values in certain columns stay within the defined perimeters. To verify and implement
this requirement, you may be required to run ad hoc queries such as distinct values,
lengths of various values in the column, or percentage of null values against the data
warehouse. And if you find deviations in data, you’ll need to fix that either (optimally)
in the ETL or using ad hoc queries. You might choose to apply constraints in the data
warehouse to prevent deviations from happening; however, constraints bring their
own problems, such as failures of ETL, increased loading time, and complex delete
operations. It will be easier if you can quality control these issues at the loading stage
and hence the data warehouse always receives the correct data. This will enable the
data warehouse to perform better avoiding unnecessary ad hoc queries and changes.
To explain it further, consider if business reports are using a two-digit country code
column extensively, you’ll need to make sure that this column always has the correct
country code and doesn’t include any stray values. You may check the nulls in the
column, the length of country code values, or distinct values in the column as part of
your resolution. If you implement these checks and their relative corrections while
loading the data warehouse, you will have solved most of your data specifications–
related problems upfront. Integration Services now includes a Data Profiling Task to
facilitate the process of finding anomalies in data.
The Data Profiling Task connects to an SQL Server database table or view and
creates various aggregate statistics to help you discover the problems in data. The Data
Profiling Task enables you to compute statistics either on a single column or on multiple
64 Hands-On Microsoft SQL Server 2008 Integration Services
columns or both. The column analysis brings out the true metadata of a column, as it is
based on the data itself and helps you to understand column data in detail. The multiple
column statistics give you an insight on how the values in one column depend upon
the values in another. These configurations are called Profile Requests; five of them
are available for individual column statistics, and three are available to analyze multiple
columns or relationships between columns.
Single-Column Profiles
Single-column profiles enable you to analyze single column independently for Null
values, column statistics, pattern profile, length distribution, and value distribution
within the column.
Column Length Distribution Profile
c You will perform this computation on a
column containing text strings to identify any outliers. For example, if the column
you are profiling contains fixed-length codes, any variation in length will indicate
a problem in the data. is profile type computes all the distinct lengths of string
values in the selected column and the percentage of rows in the table that each
length represents.
Column Null Ratio Profile
c You will perform this computation to find out
missing data in a column with any data type. For example, an unexpectedly
high ratio of null values in a column indicates the absence of data. is profile
computes the percentage of null values in the selected column.
Column Pattern Profile c is profile request generates a set of regular
expressions and the percentage of related string values. You will be using this
profile to determine invalid strings in data. is profile can also suggest regular
expressions that can be used in the future to validate new values.
Column Statistics Profile
c is profile request works with numeric and
datetime columns and can compute statistics for minimum and maximum values.
Additionally, you can also generate statistics for average and standard deviation
values for numeric columns. is profile can help you to identify values that lie
outside the range you expect in a column or have a higher standard deviation than
expected.
Column Value Distribution Profile
c is profile will be of the most interest to
you in case you want to know the distinct values and their percentage of rows in
the column. is can help you understand your data a bit more, or if you already
know the number of values, you can figure out the problems in data. is profile
request works with most data types, such as numeric, string, and datetime formats.
Chapter 2: Getting Started with Wizards 65
Multiple-Column Profiles
Using multiple-column profile, you can profile a column based on the values existing
in other columns such as candidate key profile, functional dependency profile, and the
value inclusion profile.
Candidate Key Profile
c is profile request can identify the uniqueness of a
column or set of columns and hence can help you to determine whether the
column or set of columns is appropriate to serve as a key for the selected table.
You can also use this profile request to find duplicates in the potential key column.
Functional Dependency Profile c is profile request finds out the extent to
which the values in one column are dependent on the values in another column or
set of columns. Using this profile, you can validate the data in a column based on
the other column.
Value Inclusion Profile c is profile request checks whether the values in a
column also exist in another column. Using this profile, you can identify the
dependency and can determine whether a column or set of columns is appropriate
to serve as a foreign key between the selected tables.
You can choose one or more of these profile requests to create data profiles. Based
on the profile requests, the Data Profiling Task first runs metadata queries against
INFORMATION_SCHEMA.COLUMNS to find out the column names and their
attributes, such as data type, character length, numeric precision and scale, null-ability,
and collation name. Then it runs several queries to compute values such as SUM,
COUNT, DISTINCT, and LEN. While computing all this, it keeps the calculations
and the information in the temporary tables in the TEMPDB database and drops them
later once it’s done with all the computations.
As you can imagine from this, you need read/write and create table permissions on
the TEMPDB database to be able to run the Data Profiling Task as it performs various
activities. In the end, all that information is written in an XML format in a variable or
an output file. You can review the data statistics using the Data Profile Viewer, a stand-
alone utility provided with SQL Server 2008 for viewing and analyzing data profiles.
Though you can review and analyze the profiles manually by inspecting the output
file and decide whether to import the data from the profiled table, you can actually
automate this decision making in the workflow of your package by checking the data
statistics in the xml variable.
66 Hands-On Microsoft SQL Server 2008 Integration Services
Hands-On: Using Data Profiling Task
In this Hands-On you will use Data Profiling Task to profile the data imported into
RawDataTxt table and will use Data Profile Viewer utility to review the statistics
generated.
1. Start BIDS and open My First SSIS Project. Double-click Package.dtsx to open
this blank package if it is not open already.
2. From the Toolbox, drag and drop the Data Profiling Task on to the Control
Flow surface.
3. Double-click the icon to open the Data Profiling Task Editor dialog box.
4. In the General Page, click in the DestinationType field and then expand the list
by clicking the drop-down arrow. Note that you have two options to choose from,
File or a variable, where you would like the output of this task to be written. Leave
the FileConnection selected. Click in the Destination field and select <New File
Connection…> from the drop-down list to open File Connection Manager Editor.
5. Choose Create File in the Usage type field and type C:\SSIS\RawFiles\
DataProfileFile.xml in the File field.
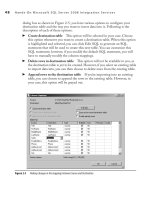
6. Click Quick Profile to open the Single Table Quick Profile Form. Click New
shown opposite to ADO.NET Connection to open the Connection Manager
dialog box. Note that it limits you to using the SqlClient Data Provider, indicating
that the Data Profile task can profile only SQL Server 2000 and above databases.
Type your server name or type localhost in the Server Name field. Select the
Campaign database in the Select box or enter a database name field. Click Test
Connection to test the configuration. Click OK twice to come back to Single
Table Quick Profile Form.
7. Select [dbo].[RawDataTxt] in the Table Or View field as shown in Figure 2-13.
Click OK to create profile requests.
8. Go to the Profile Requests page and review the various profile requests and their
options. Click OK to complete the Data Profiling Task configurations.
9. From the Debug menu, select Start Debugging or press 5 to run the package,
or else press the respective button on the toolbar. Once the package completes
execution, stop the package by pressing -
5.
10. Navigate to C:\SSIS\RawFiles and verify that the DataProfileFile.xml file
has been created. Click Start | All Programs | Microsoft SQL Server 2008 |
Integration Services | Data Profile Viewer to start the viewer utility.
11. In the Data Profile Viewer dialog box, click Open and navigate to C:\SSIS\RawFiles
and open DataProfileFile.xml. Review the different profiles to understand the
way Data Profiling Task creates the profiles. For example, if you review the
Candidate Key Profiles, you will see that EmailAddress column has been selected
as the Key column with a Key Strength of 100%. Similarly, Figure 2-14 shows
the Column Length Distribution Profiles for the PostalCode column.
Chapter 2: Getting Started with Wizards 67
Review
In the preceding Hands-On you’ve worked with the Data Profiling Task and used
the Quick Profiles option to create profile requests quite easily. However, you can
configure the requests manually the way you want by clicking in the new row in Profile
Requests page. Though the review of the profiles was manual, yet it provided you
greater understanding of the profile structure created by the Data Profiling Task. If
you really want to monitor data quality going forward, you will need to build business
rules around data quality to create a scorecard matrix. To begin with, you can create a
baseline of scorecards. When the data profiling activity is repeated over time, you can
compare the scorecards generated each time against the baseline and deduce whether
the data quality has improved or deteriorated over time.
Figure 2-13 Using the Quick Profile Form