Hands-On Microsoft SQL Server 2008 Integration Services part 69 pdf
Bạn đang xem bản rút gọn của tài liệu. Xem và tải ngay bản đầy đủ của tài liệu tại đây (260.89 KB, 10 trang )
658 Hands-On Microsoft SQL Server 2008 Integration Services
but it will provide uniform techniques that can be used throughout the enterprise—and
that goes a long way toward developing a culture of adopting best practices.
As mentioned in various Hands-On exercises, make your packages self-explanatory
by adding proper descriptions and comments in tasks and annotations. You can annotate
your package on the Control Flow surface to explain how the package works, and this
helps other developers quickly understand the functionality and will help avoid accidental
changes. Document and distribute the adopted naming conventions, auditing, and logging
for SSIS packages.
Test, Measure, and Record
Performance tuning is a strenuous process. You must clearly define performance
requirements and try to keep your packages performing within that matrix. The
packages change execution behavior over time as the data to process grows. When you
develop an SSIS package, you should first test and document the performance of the
package to develop a baseline to compare with future test results. Having a baseline can
help you quantify the performance tuning you need to do to optimize the package.
If at some stage you want to break open the pipe and measure the data pressure, as
most plumbers do to clear blocked pipes, you can use a trick explained in the following
few lines to get a view of how much performance can be achieved with your pipeline.
You can replace the downstream components at any stage in your pipeline with a
Row Count transformation that is quick to consume the rows coming to it. You can
determine maximum speed at any stage of your package and compare this value with the
real-time value—i.e., with the real components in place. This is handy for finding out
which component is degrading the performance of your package. It is worth recording
the values monitored with this technique for future references as well. Various tools
and utilities can be used to measure the baseline parameters, and will study these in the
following section.
Performance Monitoring Tools
Integration Services provides a number of performance counters that can help you
monitor the run-time workings of a package. You can also use tools such as SQL
Server Profiler provided with SQL Server 2008 and Windows Performance counters to
get a complete picture of run-time activities. These tools can be useful in understanding
the internal workings and identifying which components are acting as bottlenecks in
the performance of your package. In addition, you can use the Logging tool provided
by Integration Services to develop a performance baseline for your package.
Chapter 15: Troubleshooting and Performance Enhancements 659
Performance Counters
You can use a set of performance counters provided by Integration Services to track
pipeline performance. You can create a log that captures performance counters that are
available in the SQLServer:SSISPipeline object. You can access these counters in the
Windows Perfmon tool also called Performance Monitor.
These counters provide information about three main types of objects: BLOB data,
memory buffers, and the number of rows. Knowing about memory usage is more
important, so more counters are provided to track this. The SSIS pipeline uses memory
buffers to keep the data and to allocate memory to individual components to meet their
processing requirements. The buffers used to hold data are called flat buffers, and the
buffers allocated to components such as Sort, Aggregate, or Lookup transformations
for their internal hashing and calculation purposes are called private buffers. Large
binary objects can require lot of the memory buffers, so use BLOB counters to check
out these values if your data carries BLOB objects. These performance counters are
described here:
BLOB Bytes Read
c Displays total number of BLOB bytes read from all the data
sources, including the Import Column transformation.
BLOB Bytes Written
c Displays the total number of BLOB bytes written to all
data destinations, including the Export Column transformation.
BLOB Files In Use
c Displays the number of BLOB spooling files in use
throughout the pipeline.
Buffer Memory
c Displays the amount of memory buffers allocated to the
pipeline at different times during the package execution. Compare this value with
the memory available (which you can capture using memory object counters) on
the computer to track whether the available memory falls short during any time of
the package processing. e Buffer Memory counter value includes both physical
and virtual memory used, so if this value is close to physical memory on the
computer, you can expect the swapping of memory to disk. is is also indicated
by Buffers Spooled counter, as its value starts increasing to indicate a shortage
of physical memory. ese are important counters to observe to identify slow
performance due to memory swapping to disk.
Buffers In Use
c Displays the number of buffers used from the allocated buffers
for the pipeline.
Buffers Spooled
c is is the most important counter to observe if your package
is taking an exceptionally long time to execute. It will help you determine whether
at any time during the package execution, Integration Services starts swapping out
660 Hands-On Microsoft SQL Server 2008 Integration Services
buffers to disk. Whenever memory requirements outpace the physical memory
available on the computer, you will see that the buffers not currently in use are
swapped out to disk for later recovery when needed. is counter tells you the
number of buffers being swapped out to disk. is is an important event to watch.
Flat Buffer Memory c Flat buffers are used to store data when a package runs.
is counter displays the total amount of memory allocated to all the flat buffers.
If your package has multiple Data Flow tasks, this counter shows consolidated
value used by all the Data Flow tasks.
Flat Buffers In Use c Displays the number of flat memory buffers used by data
flow engine.
Private Buffer Memory c Some transformations such as the Sort transformation
and the Aggregate transformation need extra memory buffers to perform the
operations on the data in flat buffers. ese extra memory buffers are locally
allocated to the transformation and are called private buffers. is counter shows
the total number of buffers allocated as private buffers in the pipeline.
Private Buffers In Use
c Displays the number of buffers in use throughout the
pipeline.
Rows Read
c Displays the total number of rows read from all data sources. e
rows read by the Lookup transformation for lookup operations are not included in
the total.
Rows Written
c Displays the total number of rows that are written to all the Data
Flow destinations.
In addition to these performance counters, SQL Server 2008 provides another counter
to monitor the number of package instances currently running. The SSIS Package
Instances counter is available under SQL Server:SSIS Service 10.0 Performance object.
SQL Server Profiler
You can use the SQL Server Profiler whenever you’re transferring data with SQL
Server to determine what’s happening inside SQL Server that may be negatively
affecting the running of your package. If your package is simple and a light load, you
expect it to be running at top speed, but if SQL Server is also running other processes
during that time, your package may find it difficult to transfer data. With SQL Server
Profiler, you can monitor the SQL Server not only for data access but also for the
performance of the query you may be using in a data source to access the data.
Chapter 15: Troubleshooting and Performance Enhancements 661
Logging
You’ve already read about and used logging in Integration Services, so it is worth knowing
that you can use logging to create a baseline for your package execution as well. This
baseline should be revised from time to time as the data grows or whenever the processing
design of the package is changed. It is particularly helpful to watch the time taken
by different tasks or components to complete, as you can focus on improving this. For
example, if a data source takes most of the processing time to extract data from a source,
it is not going to benefit much if you’re putting efforts into improving transformations.
The Data Flow task also provides some interesting custom log events that are helpful
in debugging issues that affect performance of the pipeline. You can view these events
in the Log Events window when the package is being executed by selecting the Log
Events command from the SSIS menu or by right-clicking the Control Flow surface
and choosing Log Events from the context menu. Alternatively, you can log these
events by configuring logging for the Data Flow task. Also, other than the following
defined logging events, it tells you about the pushback in the engine to save memory.
Following are descriptions of some of the log events available for the Data Flow task.
These can be helpful in monitoring performance-related activities:
BufferSizeTuning
c is event happens whenever the Integration Services
pipeline changes the size of a buffer from the default size. is log entry also
specifies the reason for changing the buffer size, which is generally about either
too many rows to fit in the default buffer size or too few for the given buffer size.
It indicates the number of rows that can fit in the new buffer. Refer to the earlier
discussion on DefaultBufferSize and DefaultBufferMaxRows for more details on
buffer size and rows that can fit in a buffer.
PipelineBufferLeak
c When the pipeline execution stops, some of the components
may hold on to the buffers they used even after the buffer manager has stopped.
us the memory buffers that are not freed will cause a memory leak and will put
extra pressure on memory requirements. You can discover such components using
this event log, as it will log the name of the component and ID of the buffer.
PipelineComponentTime
c Each component in a pipeline undergoes the five
major processing steps of Validate, PreExecute, PostExecute, ProcessInput, and
PrimeOutput, and this event log reports the number of milliseconds spent by
the component in each of these phases. Monitoring this event log helps you
understand where the component spent most of the time taken.
PipelineExecutionPlan
c An SSIS pipeline has an execution plan just as the
stored procedures have. is event provides information about how memory
buffers are created and allocated to different components. By logging this event
662 Hands-On Microsoft SQL Server 2008 Integration Services
and the PipelineExecutionTrees event, you can track what is happening within the
Data Flow task.
PipelineExecutionTrees
c e pipeline is divided into separate execution trees
based on the synchronous relationship among various components of the Data
Flow task. When Integration Services starts building an execution plan for the
package, it requires information about execution trees, and this information can be
logged using this event log.
PipelineInitialization
c is log event provides in one or more entries the
information about directories to use for temporary storage of BLOB data, the
default buffer size, and the number of rows in a buffer at the initialization of the
Data Flow task.
You will log these events later in a Hands-On exercise to understand them better.
Execution Trees
At run time, the pipeline engine divides the execution of pipeline into discrete paths
just like an execution plan for a stored procedure. These discrete paths, called execution
trees (also called execution paths in Integration Services 2008), are allocated their own
resources to run the package at optimal levels. The number of execution paths in a
pipeline depends on the synchronous relationship among the components and their
layout in the package. In simplistic terms, if a package consists of only synchronous
row-based components, it will have only one execution path. However, if you introduce
a component with asynchronous outputs in the pipeline, it will be executed in two
discrete parts and will have two execution paths. The asynchronous output of the
component starts a new execution path, whereas its input is included in the upstream
execution path. So, from this, you can make out that an execution tree starts at a
data flow source or a component with asynchronous outputs and ends at a data flow
destination or at an input of the component with asynchronous outputs.
Let’s review what happens within an execution tree. From earlier discussions,
you already know that the components with synchronous outputs—i.e., row-based
components—work on the same data buffers and do not require that data be moved
to new buffers. This set of buffers constitutes an execution path. All the components
within an execution path operate on the same set of buffers. As the data is not moved,
it allows transformations to perform operations at the maximum attainable speed on
the data. Addition of an asynchronous component in the pipeline requires data to be
moved to new set of buffers, hence a new execution path; however, this also means
that the new execution path might get its own worker thread, thus increasing CPU
utilization. So, some developers used this trick in earlier versions of Integration Services
to break the single thread execution by introducing an asynchronous transformation in
Chapter 15: Troubleshooting and Performance Enhancements 663
the data flow to use more processors and hence increase performance. However, this
trick also has a performance overhead involved in moving data to new buffers. This is
no longer required in Integration Services 2008.
Integration Services 2005 had a limitation of assigning generally one worker
thread per execution tree. This happened because the thread scheduling was done
during the pre-execution phase when the relative amount of work for each execution
tree was still not known; this design resulted in poor performance in some cases,
especially when using multicast or lookup transformations. Users have experienced
that the SSIS package uses relatively few CPUs even though several processors are
free on a multiprocessor machine. The pipeline architecture in Integration Services
2008 has been enhanced with improved parallelism and can now allocate multiple
worker threads. The worker threads are assigned dynamically at run time to individual
components from a common thread pool that results in utilization of more CPUs
on a multicore computer. The packages that have high degree of parallelism will
benefit most, especially if they contain transformations such as lookup and multicast.
The pipeline engine can create subpaths for these transformations and allocate them
their own worker threads, thus increasing parallelism. For example, for a multicast
transformation all the outputs will now each get separate subpaths and hence their own
worker threads, compared with only one execution tree and only one worker thread in
the case of SSIS 2005. The ability to allocate multiple processes and create subpaths
even in the scope of a set of synchronous transformations enables SSIS 2008 to achieve
high performance. This happens automatically in the pipeline engine, requiring little
configuration from developers, thus making SSIS 2008 more productive.
Hands-On: Monitoring Log Events in a Pipeline
In this exercise, you will discover the execution trees in the data flow of your package.
Method
You will enable logging in the package and add custom log events on the Data Flow
task to log what’s happening in the package at run time.
Exercise (Enable Logging on the Data Flow Task)
Here, you will be using the Updating PersonContact package of the Data Flow
transformations project you built in Chapter 10.
1. Open the Data Flow transformations project using BIDS and then load the
Updating PersonContact.dtsx package on the Designer.
2. Right-click the blank surface of the Control Flow and choose Logging from the
context menu.
664 Hands-On Microsoft SQL Server 2008 Integration Services
3. Click the check box to enable logging for Updating PersonContact in the
Containers pane.
4. On the right side, in the Providers And Logs tab, select the SSIS log provider for
Text files selected in the Provider Type field and click Add to add this provider
type. When this provider type has been added, click in the Configuration column,
then click the down arrow and select <New Connection…> to add the File
Connection Manager.
5. In the File Connection Manager Editor, select Create File in the Usage Type
field. Type C:\SSIS\RawFiles\ExecutionLog.txt in the File field and click OK.
6. On the left side, click the Data Flow task and then click twice in the check
box provided next to it to enable logging for this task. The right pane becomes
available. Click to select the SSIS log provider for Text files log.
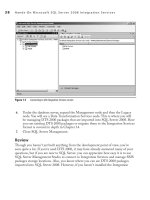
7. Go to the Details tab, scroll down, and select the custom events BufferSizeTuning,
PipelineBufferLeak, PipelineComponentTime, PipelineExecutionPlan,
PipelineExecutionTrees, and PipelineInitialization, as shown in Figure 15-7.
Click OK to close this dialog box.
8. Go to the Data Flow tab and delete the data viewers attached to all data flow
paths, if any.
Figure 15-7 Custom log events provided by the Data Flow task
Chapter 15: Troubleshooting and Performance Enhancements 665
9. Right-click the Updating PersonContact.dtsx package in the Solution Explorer
window and choose Execute Package from the context menu.
10. When the package has been executed, press -5 to switch back to designer
mode.
Exercise (Review the ExecutionLog File)
In this part, you will review the execution log file using Notepad.
11. Explore to the C:\SSIS\RawFiles folder and open the ExecutionLog.txt file using
Notepad.
12. Look through the log file for the PipelineComponentTime entries for different
components. You will notice that in the beginning of the file (and hence the
processing) you have entries for validate events and later, almost at the end,
there will be entries for other phases such as the PreExecute, PostExecute,
ProcessInput, and PrimeOutput events.
13. After the validation phase, you will see the list of execution trees under the
PipelineExecutionTrees log entry. The log is listed here in case you haven’t
managed to run the package until now:
Begin Path 0
output "Flat File Source Output" (2); component "PersonDetails01" (1)
input "Union All Input 1" (308); component "Merging PersonDetails01 and
PersonDetails02" (307)
End Path 0
Begin Path 1
output "Excel Source Output" (17); component "PersonDetails02" (9)
input "Data Conversion Input" (73); component "Converting PersonDetails02"
(72)
output "Data Conversion Output" (74); component "Converting
PersonDetails02" (72)
input "Union All Input 2" (332); component "Merging PersonDetails01 and
PersonDetails02" (307)
End Path 1
Begin Path 2
output "Union All Output 1" (309); component "Merging PersonDetails01 and
PersonDetails02" (307)
input "Derived Column Input" (177); component "Deriving Salutation" (176)
output "Derived Column Output" (178); component "Deriving Salutation"
(176)
input "Character Map Input" (194); component "Uppercasing Postcode" (193)
output "Character Map Output" (195); component "Uppercasing Postcode"
(193)
input "Lookup Input" (203); component "Adding City Column" (202)
Begin Subpath 0
output "Lookup Match Output" (204); component "Adding City Column"
(202)
input "OLE DB Command Input" (254); component "Deleting Duplicates"
(249)
output "OLE DB Command Output" (255); component "Deleting Duplicates"
666 Hands-On Microsoft SQL Server 2008 Integration Services
(249)
input "OLE DB Destination Input" (279); component "PersonContact" (266)
End Subpath 0
Begin Subpath 1
output "Lookup No Match Output" (217); component "Adding City Column"
(202)
input "Flat File Destination Input" (228); component "No Match Lookups
File" (227)
End Subpath 1
End Path 2
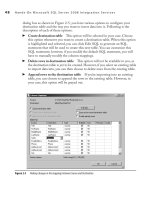
Let’s now see how the pipeline engine has created execution paths. The execution
paths are numbered beginning with 0, so you have three main execution paths in
total. Based on the preceding log events, the execution paths have been marked in
the Figure 15-8.
Figure 15-8 Execution paths in the Updating PersonContact package
Chapter 15: Troubleshooting and Performance Enhancements 667
14. The next section of the log shows PipelineExecutionPlan, which is listed here:
Begin output plan
Begin transform plan
Call PrimeOutput on component "Merging PersonDetails01 and
PersonDetails02" (307)
for output "Union All Output 1" (309)
End transform plan
Begin source plan
Call PrimeOutput on component "PersonDetails01" (1)
for output "Flat File Source Output" (2)
Call PrimeOutput on component "PersonDetails02" (9)
for output "Excel Source Output" (17)
End source plan
End output plan
Begin path plan
Begin Path Plan 0
Call ProcessInput on component "Merging PersonDetails01 and
PersonDetails02" (307) for input "Union All Input 1" (308)
End Path Plan 0
Begin Path Plan 1
Call ProcessInput on component "Converting PersonDetails02" (72) for
input "Data Conversion Input" (73)
Create new row view for output "Data Conversion Output" (74)
Call ProcessInput on component "Merging PersonDetails01 and
PersonDetails02" (307) for input "Union All Input 2" (332)
End Path Plan 1
Begin Path Plan 2
Call ProcessInput on component "Deriving Salutation" (176) for input
"Derived Column Input" (177)
Create new row view for output "Derived Column Output" (178)
Call ProcessInput on component "Uppercasing Postcode" (193) for input
"Character Map Input" (194)
Create new row view for output "Character Map Output" (195)
Call ProcessInput on component "Adding City Column" (202) for input
"Lookup Input" (203)
Create new execution item for subpath 0
Create new execution item for subpath 1
Begin Subpath Plan 0
Create new row view for output "Lookup Match Output" (204)
Call ProcessInput on component "Deleting Duplicates" (249) for input
"OLE DB Command Input" (254)
Create new row view for output "OLE DB Command Output" (255)
Call ProcessInput on component "PersonContact" (266) for input "OLE
DB Destination Input" (279)
End Subpath Plan 0
Begin Subpath Plan 1
Create new row view for output "Lookup No Match Output" (217)
Call ProcessInput on component "No Match Lookups File" (227) for
input "Flat File Destination Input" (228)
End Subpath Plan 1
End Path Plan 2
End path plan
The PipelineExecutionPlan creates two different plans: the output plan and the
path plan. The output plan consists of the source plan and the transform plan.
The source plan represents the outputs of data flow sources, while the transform