Phát triển ứng dụng cho iPhone và iPad - part 38 ppsx
Bạn đang xem bản rút gọn của tài liệu. Xem và tải ngay bản đầy đủ của tài liệu tại đây (2.23 MB, 10 trang )
NSLog (@”connection:didReceiveData:”);
// Append the received data to our responseData property
[self.responseData appendData:data];
}
TermExtractViewController.m
Now you need to implement connectionDidFinishLoading . The delegate calls this method when
the connection has completed loading the requested data. In this method, you convert the response
data to a string, clean up the connection, and call the method to parse the XML:
// Called when the connection has successfully received the complete response
- (void)connectionDidFinishLoading:(NSURLConnection *)connection
{
NSLog (@”connectionDidFinishLoading:”);
// Convert the data to a string and log the response string
NSString *responseString = [[NSString alloc]
initWithData:self.responseData
encoding:NSUTF8StringEncoding];
NSLog(@”Response String: \n%@”, responseString);
[responseString release];
[connection release];
[self parseXML];
}
TermExtractViewController.m
Finally, you should implement the connection:didFailWithError: method. Here you will log
that an error occurred. In a production application, you would want to provide more robust error
handling. Here is the implementation:
// Called when an error occurs in loading the response
- (void)connection:(NSURLConnection *)connection
didFailWithError:(NSError *)error
{
NSLog (@”connection:didFailWithError:”);
NSLog (@”%@”,[error localizedDescription]);
[connection release];
}
TermExtractViewController.m
Example 2: Term Extraction
❘
339
CH011.indd 339CH011.indd 339 9/18/10 10:05:17 AM9/18/10 10:05:17 AM
340
❘
CHAPTER 11 INTEGRATING WITH WEB SERVICES
Parsing the Response XML
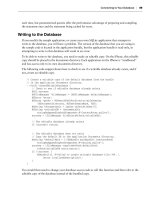
After you submit your request, you will receive an XML response from the web service. The
response will contain the most relevant words and phrases from the text that you sent into
the service, in order of relevance. The response that I received when I sent the declaration to the
web service looked like this:
< ?xml version=”1.0”? >
< ResultSet xmlns:xsi=” /> xmlns=”urn:yahoo:cate” xsi:schemaLocation=”urn:yahoo:cate
/> TermExtractionResponse.xsd” >
< Result > life liberty and the pursuit of happiness < /Result >
< Result > powers of the earth < /Result >
< Result > liberty and the pursuit of happiness < /Result >
< Result > pursuit of happiness < /Result >
< Result > certain unalienable rights < /Result >
< Result > absolute despotism < /Result >
< Result > political bands < /Result >
< Result > transient causes < /Result >
< Result > decent respect < /Result >
< Result > long train < /Result >
< Result > direct object < /Result >
< Result > usurpations < /Result >
< Result > sufferance < /Result >
< Result > laws of nature < /Result >
< Result > one people < /Result >
< Result > form of government < /Result >
< Result > when in the course of human events < /Result >
< Result > evils < /Result >
< Result > prudence < /Result >
< Result > mankind < /Result >
< /ResultSet >
You need to implement the parseXML function, just as you did in the previous example, to parse this
response XML:
- (void) parseXML {
NSLog (@”parseXML”);
// Initialize the parser with our NSData from the RSS feed
NSXMLParser *xmlParser = [[NSXMLParser alloc]
initWithData:self.responseData];
// Set the delegate to self
[xmlParser setDelegate:self];
// Start the parser
if (![xmlParser parse])
{
NSLog (@”An error occurred in the parsing”);
}
CH011.indd 340CH011.indd 340 9/18/10 10:05:17 AM9/18/10 10:05:17 AM
// Release the parser because we are done with it
[xmlParser release];
}
TermExtractViewController.m
In this method, you fi rst declare an instance of an NSXMLParser and initialize it with the response
data that you received from the web service. Next, you set the parser ’ s delegate to
self . Then, you
tell the parser to start parsing the XML. Finally, you release the parser.
Finally, you will implement your
NSXMLParser delegate methods:
// Called when the parser encounters a start element
- (void) parser:(NSXMLParser *)parser
didStartElement:(NSString *)elementName
namespaceURI:(NSString *)namespaceURI
qualifiedName:(NSString *)qualifiedName
attributes:(NSDictionary *)attributeDict {
// Check to see which element we have found
if ([elementName isEqualToString:@”Result”]) {
// Initialize the capturedCharacters instance variable
capturedCharacters = [[NSMutableString alloc] initWithCapacity:100];
}
}
// Called when the parser encounters an end element
- (void)parser:(NSXMLParser *)parser didEndElement:(NSString *)elementName
namespaceURI:(NSString *)namespaceURI qualifiedName:(NSString *)qName {
NSLog (@”didEndElement”);
// Check to see which element we have ended
// We ended a Result element
if ([elementName isEqualToString:@”Result”]) {
NSLog (@”capturedCharacters: %@” , capturedCharacters);
self.extractedTermsTextView.text = [self.extractedTermsTextView.text
stringByAppendingFormat:@”%@\n”,capturedCharacters];
// Release the capturedCharacters instance variable
[capturedCharacters release];
capturedCharacters = nil;
}
}
// Called when the parser finds characters contained within an element
Example 2: Term Extraction
❘
341
CH011.indd 341CH011.indd 341 9/18/10 10:05:18 AM9/18/10 10:05:18 AM
342
❘
CHAPTER 11 INTEGRATING WITH WEB SERVICES
- (void)parser:(NSXMLParser *)parser foundCharacters:(NSString *)string {
if (capturedCharacters != nil) {
[capturedCharacters appendString:string];
}
}
TermExtractViewController.m
Because you are only interested in Result elements, this code is straightforward. If you encounter
the start of a Result element, you initialize your
capturedCharacters instance variable in the
didStartElement method. In didEndElement , you check to see that you ended a Result element.
Then, you append the
capturedCharacters string to the extractedTermsTextView .
Finishing Up
The application is now complete. You should be able to successfully build and run the program.
When you tap the Extract Terms button, you will send the query to the web service. If you have
an active Internet connection, and you have properly confi gured your own
appid , you should
receive an XML result set back that contains the extracted terms. You can verify this in the console
log. The code will take the text contained in each Result element, parse it, and append it to the
extractedTermsTextView in the user interface. Feel free to paste in any block of text that you
fi nd interesting to see what the Yahoo! service feels are the most signifi cant words or phrases in the
document.
MOVING FORWARD
In this chapter, you learned about the basics of XML web services. Then you learned how to call
XML web services using both the HTTP
GET and POST methods. This will enable you to call any
web service available on the Internet.
You also learned how to use the Core Location framework to access the GPS functionality and
determine a device ’ s location. Then, you learned how to use the MapKit framework to display and
annotate maps.
Over the course of this entire book, you have explored the full spectrum of dealing with data on
the iPhone and iPad. You learned how to display data on the device, extract data from enterprise
systems and store it on the device, use Core Data to generate and manage data on the device, and
use web services to communicate from your application to other services.
You now have all of the tools necessary to build robust, data - driven applications. I hope that you
fi nd the exploration of the frameworks and functionality available in the iPhone SDK helpful in your
daily work. I hope that you take this knowledge, go out, and build amazing applications, because
the iPhone and iPad are amazing platforms for your software. We are still only at the beginning
for these devices. As these technologies evolve, the capabilities of the devices will only get better,
allowing you to build applications that are even more amazing!
CH011.indd 342CH011.indd 342 9/18/10 10:05:18 AM9/18/10 10:05:18 AM
Tools for Troubleshooting
Your Applications
In this book, I have covered various topics related to building data - centric iPhone and iPad
applications. Because most readers are already familiar with iOS software development, this
book does not include in - depth coverage of the tools that experienced developers may already
know about such as Instruments and the Static Analyzer.
This appendix covers these tools, which can be invaluable when troubleshooting your
applications. The techniques that you learn in this appendix are general. You should be able
to use these techniques as - is with the current version of Instruments, and apply the same
principles to future versions of the tool. If you already know about these tools, perhaps you
will learn a new tip or trick. If you have never used these tools, you will learn how to use them
to effectively track down problems in your code.
INSTRUMENTS
Instruments is a graphical tool that helps you to gather information about your
application at runtime. You can then use this information to help track down diffi cult
bugs such as memory leaks. Instruments is also valuable in profi ling the performance
of your application and helping you to track down and fi x bottlenecks. Many different
tools are available in the Instruments application to help you to troubleshoot a variety
of application problems.
The Instruments application consists of a set of instruments that you use to collect data
about your application as it runs. You can see all of the instruments that are available
A
APP-A.indd 343APP-A.indd 343 9/17/10 7:24:02 PM9/17/10 7:24:02 PM
344
❘
APPENDIX A TOOLS FOR TROUBLESHOOTING YOUR APPLICATIONS
for use in Figure A - 1. The instruments
generally display their results graphically.
You can have many instruments running
concurrently with their resulting graphs
displayed together in the application
interface. This can help you analyze the
relationships between the data collected by
different instruments.
You can also create custom instruments
that use DTrace to examine the execution
of your application. DTrace is a dynamic
scripting tool that Sun created and Apple
ported to OS X.
You cannot use DTrace custom instruments
on the iPhone OS directly, but you can use
them in conjunction with the simulator
when running your application on your development machine. While this reduces the usefulness of
custom instruments because you cannot use them for performance profi ling on the device, you can
still build instruments to help you to debug your applications in the simulator.
Because DTrace instruments are of limited usefulness to iPhone developers, I will not cover them
in detail. You can refer to the Instruments user guide located at
/>iphone/library/documentation/DeveloperTools/Conceptual/InstrumentsUserGuide
for
more details on creating custom instruments using DTrace.
Starting Instruments
You can start the Instruments tool by launching the application, which is located, by default, in
/YourDriveName/Developer/Applications or by selecting Run ➪ Run With Performance Tool
from the menu bar in Xcode.
If you start the application directly, you will see a list of templates for the trace document that you
are about to start. The trace document holds the set of all of your individual trace runs. You can
save your trace documents so that you can review all of the data collected from your traces at any
time. If you start Instruments from within Xcode, you are effectively selecting the template that you
will use when you choose an option under Instruments in the menu bar.
The templates consist of default sets of instruments designed to assist you with specifi c tasks. For
instance, you would select the Leaks template if you were interested in troubleshooting memory
leaks in your application. After you select the Leaks template, the Instruments application appears
with both the Leaks and ObjectAlloc instruments loaded into the trace document. If you examine
the defi nitions of each tool, you will see that you often want to use the ObjectAlloc instrument in
conjunction with the Leaks instrument because ObjectAlloc can give you insight into the history of
an object that the Leaks tool reports as a leak.
FIGURE A - 1: Available instruments
APP-A.indd 344APP-A.indd 344 9/17/10 7:24:06 PM9/17/10 7:24:06 PM
Instruments
❘
345
The Trace Document
The trace document is the group of tools that you are using, along with any test runs. You can see
an example of a trace document in Figure A - 2.
Detail Pane
Extended Detail PaneTrack Pane
Instruments
Pane
FIGURE A - 2: The trace document
The Instruments pane shows the list of instruments that you are using for the current trace. Clicking
the info button for an instrument displays that instrument ’ s confi guration options. You can add
instruments to the Instruments pane by dragging them from the instruments library (displayed with
Command+L) and dropping them into the Instruments pane.
The Track pane displays the graphical output of the instrument in a timeline. Each instrument
records its data into its own track. The Track pane shows the time that an event occurred during the
test run. You can adjust the time scale using the slider at the bottom of the Instruments pane. You
can scroll the Track pane using the scrollbar at the bottom of the pane.
The small triangle that appears at the top of the Track pane is the playhead . The playhead indicates
the current time of the test run. You can move the playhead to review the state of your application
at any given time during its execution. You can add a fl ag at the current location of the playhead by
clicking the fl ag icon with the plus sign next to it in the toolbar. You can navigate forward to the
APP-A.indd 345APP-A.indd 345 9/17/10 7:24:07 PM9/17/10 7:24:07 PM
346
❘
APPENDIX A TOOLS FOR TROUBLESHOOTING YOUR APPLICATIONS
next fl ag or back to the previous fl ag by clicking the fl ag icons to the right or the left of the add fl ag
icon respectively.
The Detail pane shows the details of the currently selected tool. The Detail pane shows different
details based on the tool that you have selected in the Instruments pane. You can select an item
in the Detail pane to view more detail about the item in the Extended Detail pane. The Extended
Detail pane is particularly useful because it shows a stack trace for the method call that you have
selected in the Detail pane.
I fi nd it useful to display the fi le icons in the Extended Detail pane because doing so makes the
calls in the stack that originated in your code obvious. You can enable the fi le icons by clicking on
the gear icon in the Extended Details pane. If you double - click on an item in the call stack that
corresponds to one of your source code fi les, Instruments will display the source code in the Detail
pane. Instruments highlights the line of code that was executing when the sample was taken.
You can narrow the amount of data contained in the Detail pane by specifying an inspection range.
To specify an inspection range, move the playhead to the location in the timeline where you want
the range to begin and click on the left icon in the Inspection Range icon group in the toolbar.
Next, move the playhead to the location in the timeline where you want the range to end and click
on the right icon in the Inspection Range icon group in the toolbar. You should see the data in the
Detail pane reduce down to include only the data collected during the time window specifi ed by
the inspection range that you have created.
Objective - C Memory Management
In the upcoming section, you will explore the use of Instruments to discover the cause of a memory
leak. First, let ’ s take a brief detour to make sure that you understand how memory management
works in Objective - C.
Although garbage collection is a nice feature available to developers on the Mac platform, there is
currently no garbage - collected version of the Objective - C runtime available for the iPhone or iPad.
Therefore, you are responsible for managing the memory consumed by the objects that you create
in your applications. If you fail to properly free the memory that you allocate, the total amount of
memory consumed by your application will grow as the application runs. This failure to clean up
unused memory results in a memory leak. Eventually, if your program consumes too much memory,
the OS will terminate your application.
All Objective - C classes that inherit from
NSObject have a retain count . When an object is allocated
using
alloc or new , its retain count is set to 1. The retain count is a counter that indicates the
number of bits of code that are interested in the object. When you need to hold on to a reference
to an object, you increment the retain count by calling the
retain method on the object. When
you are fi nished with an object, you call
release to decrement the retain count. The retain count
determines when the object should be de - allocated and its
dealloc method called.
You need to be careful to balance calls to
new , alloc , or retain with calls to release . If you
have too few calls to
release , the retain count for the object will never drop to 0 and the object
will never be released, resulting in a memory leak. If you call
release too many times, you will
over - release the object, causing a segmentation fault and an application crash.
APP-A.indd 346APP-A.indd 346 9/17/10 7:24:08 PM9/17/10 7:24:08 PM
Instruments
❘
347
In general, adding an object to a collection such as NSMutableArray increments the retain count.
Likewise, removing an object from a collection decrements the retain count. Simply obtaining
an object from a collection typically returns an autoreleased object. If you need to hold on to the
reference to an autoreleased object, you need to call
retain on it.
You can also send the message
autorelease to an object. This indicates that the runtime should
release the object at a point in the future, but not right away. You use autorelease pools to keep
track of all autoreleased objects. There is an application - wide autorelease pool that the project
template creates automatically when you begin your application. You can create local pools
yourself as well.
Autorelease is particularly useful for returning objects from methods. You can allocate the object
that you plan to return from the method, confi gure it, and then autorelease it. It is then the caller ’ s
responsibility to retain the object to ensure that it has the proper retain count. The Objective - C
runtime will send an autoreleased object to the
release message one time for every time you call
autorelease on it when the autorelease pool is drained or de - allocated.
When you create an object with a helper method that has
alloc , new , or copy in its name, it is your
responsibility to release it. Objects created in this way, by convention, have a retain count of 1. If
you use a method that returns an object such as
stringWithString to get an instance of an object,
you should assume that the object is autoreleased.
If you need to hold on to a reference to an autoreleased object, it is your responsibility to call
retain .
The default autorelease pool will de - allocate autoreleased objects each time through the application ’ s
run loop. So, if you get an autoreleased object in a function, use it right away, and don ’ t need it after
the method call is complete, you do not need to worry about retaining it. However, if you plan to put
an autoreleased object into an instance variable for access at a later time, you have to call
retain
on it or else it will be de - allocated at the end of the run loop and your application will crash with a
segmentation fault when you try to send a message to the de - allocated object.
You should use
release instead of autorelease whenever possible as there is less overhead in
calling
release . If you are going to be creating and autoreleasing many objects, in a loop perhaps,
you should wrap the loop in its own autorelease pool.
You can send the
retainCount message to any NSObject to obtain the current retain count of that
object. You generally won ’ t use this method in a production application, but it can be helpful to log
the retain count of an object as you are trying to debug memory problems.
The rules of memory management are simple. To summarize:
If you create an object with
alloc , new , or copy , the object will have a retain count of 1 and
you are responsible calling
release .
If you get a reference to an object in any other way, you can assume that it has a retain
count of 1 and has been autoreleased. If you need to hold on to a reference to the object,
retain it.
If you call
retain on an object, you have to balance the call to retain with a call to
release .
A memory leak occurs when you lose the reference to a pointer for an object that you have not
deleted from the heap, or if you do not match the number of calls to
retain , alloc , new , or copy
➤
➤
➤
APP-A.indd 347APP-A.indd 347 9/17/10 7:24:08 PM9/17/10 7:24:08 PM
348
❘
APPENDIX A TOOLS FOR TROUBLESHOOTING YOUR APPLICATIONS
to the number of calls to release . This is called over - retaining an object.
Over - retaining will result in the object ’ s retain count never reaching 0
at which time the runtime frees the memory consumed by the object.
Because the object is not freed, you have leaked the memory consumed
by the object for the remainder of the life of the program.
Sample Memory Leak Application
Now that you have an understanding of memory management and
Objective - C, you will build an application with a memory leak and then
use Instruments to fi nd and fi x that leak. The application will be very
simple with only a single button for the user interface, as you can see in
Figure A - 3. When you tap the Go button, a routine with a memory leak
will run and log to the console.
Start a new View - based Application project for iPhone called
MemoryLeaker. Open the
MemoryLeakerViewController.h header fi le
and add an action for the Go button as follows:
#import < UIKit/UIKit.h >
@interface MemoryLeakerViewController : UIViewController {
}
-(IBAction) goPressed:(id) sender;
@end
Now, you need to build the interface in Interface Builder. Open the MemoryLeakerViewController
.xib
fi le in Interface Builder. Add a UIButton to the View and wire the TouchUpInside event to
File ’ s Owner
goPressed method. Save the XIB fi le and close Interface Builder.
Next, you are going to implement the
goPressed method in the MemoryLeakerViewController.m
implementation fi le. Remember that this code has a memory leak so don ’ t use it in any of your
applications. Here is the implementation of the
goPressed method:
-(IBAction) goPressed:(id) sender
{
NSMutableString *theString = [[NSMutableString alloc] init];
[theString appendString:@”This”] ;
[theString appendString:@” is”] ;
[theString appendString:@” a”] ;
[theString appendString:@” string”] ;
NSLog(@”theString is: %@”, theString);
}
FIGURE A - 3:
MemoryLeaker application
APP-A.indd 348APP-A.indd 348 9/17/10 7:24:09 PM9/17/10 7:24:09 PM