Critical Care Obstetrics part 2 doc
Bạn đang xem bản rút gọn của tài liệu. Xem và tải ngay bản đầy đủ của tài liệu tại đây (122.9 KB, 10 trang )
List of Contributors
ix
Michael J. Paidas
Yale Women & Children ’ s Center for
Blood Disorders
Department of Obstetrics, Gynecology and
Reproductive Sciences
Yale School of Medicine,
New Haven, CT, USA
Teri Pearlstein
Associate Professor of Psychiatry and Human
Behavior and Medicine
Alpert Medical School of Brown University
Women and Infants Hospital
Providence, RI, USA
Jeffrey P. Phelan
Director of Quality Assurance
Department of Obstetrics and Gynecology
Citrus Valley Medical Center
West Covina and
President and Director
Clinical Research
Childbirth Injury Prevention Foundation
City of Industry
Pasadena, CA, USA
T. Flint Porter
Associate Professor
Department of Obstetrics and Gynecology
University of Utah Health Science, UT and
Medical Director
Maternal - Fetal Medicine
Urban Central Region
Intermountain Healthcare
Salt Lake City, UT, USA
Raymond Powrie
Department of Medicine, Obstetrics and
Gynecology
Warren Alpert School of Medicine at
Brown University
RI, USA
Fidelma B. Rigby
Department of Obstetrics and Gynecology
MFM Division
MCV Campus of Virginia Commonwealth
University
Richmond, VA, USA
Scott Roberts
Department of Obstetrics and Gynecology
The University of Texas Southwestern Medical
Center (UTSMC) at Dallas
TX, USA
Julian N. Robinson
Associate Clinical Professor
Harvard Medical School
Division of Maternal - Fetal Medicine
Department of Obstetrics, Gynecology and
Reproductive Biology
Brigham and Women ’ s Hospital
Boston, MA, USA
Sheryl Rodts - Palenik
Acadiana Maternal - Fetal Medicine
Lafayette, LA, USA
Roxann Rokey
Director
Department of Cardiology
Marshfi eld Clinic
Marshfi eld, WI, USA
David A. Sacks
Department of Research
Southern California Permanente Medical Group
Pasadena, CA, USA
Mark Santillan
Department of Obstetrics and Gynecology
University of Iowa College of Medicine
Iowa City, IA, USA
Anthony Scardella
Professor of Medicine
Division of Pulmonary and Critical Care Medicine
Department of Medicine
University of Medicine and Dentistry of New
Jersey - Robert Wood Johnson Medical School
New Brunswick, NJ, USA
William E. Scorza
Chief of Obstetrics
Division of Maternal – Fetal Medicine
Department of Obstetrics
Lehigh Valley Hospital
Allentown, PA, USA
James Scott
Department of Obstetrics and Gynecology
University of Utah, Medical Center
Salt Lake City, UT, USA
Julie Scott
Assistant Professor
Department of Obstetrics and Gynecology
Division of Maternal - Fetal Medicine
University of Colorado Health Sciences Center
Denver, CO, USA
Gail L Seiken
Washington Nephrology Associates
Bethesda, MD, USA
Shailen S. Shah
Director of Operations
Maternal - Fetal Medicine
Virtua Health
Voorhees, NJ and
Assistant Professor
Thomas Jefferson University Hospital,
Philadelphia, PA, USA
Howard T. Sharp
Department of Obstetrics and Gynecology
University of Utah School of Medicine
Salt Lake City, UT, USA
Andrea Shields
Director
Antenatal Diagnostic Center
San Antonio Military Medical Center
Lackland Airforce Base, TX, USA
John C. Smulian
Division of Maternal - Fetal Medicine
Department of Obstetrics and Gynecology
Lehigh Valley Health Network
Allentown, PA, USA
Irene Stafford
Maternal - Fetal Medicine
University of Texas Southwestern Medical Center
Dallas, TX, USA
Shawn P. Stallings
Division of Maternal - Fetal Medicine
Department of Obstetrics and Gynecology
University of Tennessee College of Medicine
Chattanooga, TN, USA
Victor R. Suarez
Maternal - Fetal Medicine Attending
Advocate Christ Medical Center
Chicago, IL, USA
Maya S. Suresh
Professor and Interim Chairman
Department of Anesthesiology
Baylor College of Medicine
Houston, TX, USA
Nan H. Troiano
Clinical Nurse Specialist
Women ’ s Services
Labor & Delivery and High Risk Perinatal Unit
Inova Fairfax Hospital Women ’ s Center
Falls Church, Virginia and
Columbia University; New - York Presbyterian
Hospital
Department of Obstetrics and Gynecology
Division of Maternal - Fetal Medicine and
Consultant, Critical Care Obstetrics
New York, USA
James W. Van Hook
Professor and Director
Department of Obstetrics and Gynecology
Division of Maternal - Fetal Medicine
University of Cincinnati College of Medicine
Cincinnati, OH, USA
Michael W. Varner
Department of Obstetrics and Gynecology
University of Utah Health Sciences Center
Salt Lake City, UT, USA
List of Contributors
x
Edward W. Veillon, Jr
Fellow
Maternal - Fetal Medicine
University of Mississippi Medical Center
Jackson, MS, USA
Carey Winkler
MFM Physician
Legacy Health Systems
Maternal - Fetal Medicine Department
Portland, OR, USA
Jerome Yankowitz
Department of Obstetrics and Gynecology
University of Iowa College of Medicine
Iowa City, IA, USA
1
Critical Care Obstetrics, 5th edition. Edited by M. Belfort, G. Saade,
M. Foley, J. Phelan and G. Dildy. © 2010 Blackwell Publishing Ltd.
1
Epidemiology of Critical Illness in Pregnancy
Cande V. Ananth
1
& John C. Smulian
2
1
Division of Epidemiology and Biostatistics, Department of Obstetrics, Gynecology and Reproductive Sciences, UMDNJ –
Robert Wood Johnson Medical School, New Brunswick, NJ, USA
2
Division of Maternal-Fetal Medicine, Department of Obstetrics and Gynecology, Lehigh Valley Health Network, Allentown,
PA, USA
Introduction
The successful epidemiologic evaluation of any particular disease
or condition has several prerequisites. Two of the most important
prerequisites are that the condition should be accurately defi ned
and that there should be measurable outcomes of interest.
Another requirement is that there must be some systematic way
of data collection or surveillance that will allow the measurement
of the outcomes of interest and associated risk factors. The epi-
demiologic evaluation of critical illness associated with pregnancy
has met with mixed success on all of these counts.
Historically, surveillance of pregnancy - related critical illness
has focused on the well - defi ned outcome of maternal mortality
in order to identify illnesses or conditions that might have led to
maternal death. Identifi cation of various conditions associated
with maternal mortality initially came from observations by
astute clinicians. One of the best examples is the link described
by Semmelweiss between hand - washing habits and puerperal
fever. In most industrial and many developing countries, there
are now population - based surveillance mechanisms in place to
track maternal mortality. These often are mandated by law. In
fact, the World Health Organization uses maternal mortality as
one of the measures of the health of a population [1] .
Fortunately, in most industrialized nations the maternal mor-
tality rates have fallen to very low levels. Recent statistics for the
United States suggest that overall maternal mortality was 11.5
maternal deaths per 100 000 live births during 1991 – 97 [2] .
Despite this impressively low rate of maternal mortality, tracking
maternal deaths may not be the best way to assess pregnancy -
related critical illnesses since the majority of such illnesses do
not result in maternal death. As stated by Harmer [3] , “ death
represents the tip of the morbidity iceberg, the size of which
is unknown. ” Unlike mortality, which is an unequivocal
endpoint, critical illness in pregnancy as a morbidity outcome is
diffi cult to defi ne and, therefore, diffi cult to measure and study
precisely.
There are many common conditions in pregnancy such as
the hypertensive diseases, intrapartum hemorrhage, diabetes,
thyroid disease, asthma, seizure disorders, and infection that
occur frequently and require special medical care, but do not
actually become critical illnesses. Most women with these com-
plications have relatively uneventful pregnancies that result in
good outcomes for both mother and infant. Nevertheless, each of
these conditions can be associated with signifi cant complications
that have the potential for serious morbidity, disability and mor-
tality. The stage at which any condition becomes severe enough
to be classifi ed as a critical illness has not been clearly defi ned.
However, it may be helpful to consider critical illness as impend-
ing, developing, or established signifi cant organ dysfunction,
which may lead to long - term morbidity or death. This allows
some fl exibility in the characterization of disease severity since it
recognizes conditions that can deteriorate rather quickly in
pregnancy.
Maternal mortality data collection is well established in many
places, but specifi c surveillance systems that track severe compli-
cations of pregnancy not associated with maternal mortality are
rare. It has been suggested that most women suffering a critical
illness in pregnancy are likely to spend some time in an intensive
care unit [3 – 5] . These cases have been described by some as
“ near - miss ” mortality cases [6,7] . Therefore, examination of
cases admitted to intensive care units can provide insight into the
nature of pregnancy - related critical illnesses and can compliment
maternal mortality surveillance. However, it should be noted that
nearly two - thirds of maternal deaths might occur in women who
never reach an intensive care unit [5] .
The following sections review much of what is currently
known about the epidemiology of critical illness in pregnancy.
Some of the information is based on published studies; however,
much of the data are derived from publicly available data that
are collected as part of nationwide surveillance systems in the
US.
Chapter 1
2
hospitalizations (3.19%), although the average LOS was shorter
for non - delivery hospitalizations.
Hospitalizations for preterm labor occurred twice as frequently
for non - delivery hospitalizations (21.21%) than for delivery -
related hospitalizations (10.28%). This is expected since many
preterm labor patients are successfully treated and some of these
hospitalizations are for “ false labor. ” Liver disorders were uncom-
monly associated with hospitalization. However, the mean hos-
pital LOS for liver disorders that occurred with non - delivery
hospitalizations was over 31 days, compared with a mean LOS of
3 days if the liver condition was delivery related. Coagulation -
related defects required 14.9 days of hospitalization if not related
to delivery compared with a mean LOS of 4.9 days if the condition
was delivery related. Hospitalizations for embolism - related com-
plications were infrequent, but generally required extended hos-
pital stays.
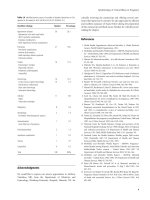
The top 10 conditions associated with hospital admissions,
separately for delivery - and non - delivery - related events, are pre-
sented in Figure 1.1 . The chief cause for hospitalization (either
delivery or non - delivery related) was preterm labor. The second
most frequent condition was hypertensive disease (7.37% for
delivery related and 6.61% for non - delivery related) followed by
anemia (7.13% vs 5.05%). Hospitalizations for infection - related
conditions occurred twice more frequently for non - delivery
periods (11.65%) than during delivery (5.75%). In contrast, hos-
pitalization for hemorrhage was more frequent during delivery
(4.43%) than non - delivery (3.26%). These data provide impor-
tant insights into the most common complications and condi-
tions associated with pregnancy hospitalization. The LOS data
also give some indication of resource allocation needs. While
this is important in understanding the epidemiology of illness in
pregnancy, it does not allow a detailed examination of illness
severity.
Maternal m ortality
The national health promotion and disease prevention objectives
of the Healthy People 2010 indicators specify a goal of no more
than 3.3 maternal deaths per 100 000 live births in the US [12] .
The goal for maternal deaths among black women was set at no
more than 5.0 per 100 000 live births. As of 1997 (the latest avail-
able statistics on maternal deaths in the US) this objective remains
elusive. The pregnancy - related maternal mortality ratio (PRMR)
per 100 000 live births for the US was 11.5 for 1991 – 97 [13] , with
the ratio over threefold greater among black compared with white
women [14] . Several studies that have examined trends in mater-
nal mortality statistics have concluded that a majority of preg-
nancy - related deaths (including those resulting from ectopic
pregnancies, and some cases of infection and hemorrhage) are
preventable [1,15,16] . However, maternal deaths due to other
complications such as pregnancy - induced hypertension, placenta
previa, retained placenta, and thromboembolism, are considered
by some as diffi cult to prevent [17,18] .
Pregnancy - r elated h ospitalizations
Pregnancy complications contribute signifi cantly to maternal,
fetal, and infant morbidity, as well as mortality [8] . Many women
with complicating conditions are hospitalized without being
delivered. Although maternal complications of pregnancy are the
fi fth leading cause of infant mortality in the US, little is known
about the epidemiology of maternal complications associated
with hospitalizations. Examination of complicating conditions
associated with maternal hospitalizations can provide informa-
tion on the types of conditions requiring hospitalized care. In the
US during the years 1991 – 92, it was estimated that 18.0% of
pregnancies were associated with non - delivery hospitalization
with disproportionate rates between black (28.1%) and white
(17.2%) women [9] . This 18.0% hospitalization rate comprised
12.3% for obstetric conditions (18.3% among black women and
11.9% among white women), 4.4% for pregnancy losses (8.1%
among black women and 3.9% among white women), and 1.3%
for non - obstetric (medical or surgical) conditions (1.5% among
black women and 1.3% among white women). The likelihood of
pregnancy - associated hospitalizations in the US declined between
1986 – 87 and 1991 – 92 [9,10] .
More recent information about pregnancy - related hospitaliza-
tion diagnoses can be found in the aggregated National Hospital
Discharge Summary (NHDS) data for 1998 – 99. These data are
assembled by the National Center for Health Statistics (NCHS)
of the US Centers for Disease Control and Prevention. The NHDS
data is a survey of medical records from short - stay, non - federal
hospitals in the US, conducted annually since 1965. A detailed
description of the survey and the database can be found elsewhere
[11] . Briefl y, for each hospital admission, the NHDS data include
a primary and up to six secondary diagnoses, as well as up to four
procedures performed for each hospitalization. These diagnoses
and procedures are all coded based on the International
Classifi cation of Diseases, ninth revision, clinical modifi cation.
We examined the rates (per 100 hospitalizations) of hospitaliza-
tions by indications (discharge diagnoses) during 1998 – 99 in the
US, separately for delivery (n = 7 965 173) and non - delivery
(n = 960 023) hospitalizations. We also examined the mean hos-
pital lengths of stay (with 95% confi dence intervals, CIs).
Antepartum and postpartum hospitalizations were grouped as
non - delivery hospitalizations.
During 1998 – 99, nearly 7.4% of all hospitalizations were for
hypertensive diseases with delivery, and 6.6% were for hyperten-
sive diseases not delivered (Table 1.1 ). Mean hospital length of
stay (LOS) is an indirect measure of acuity for some illnesses.
LOS was higher for delivery - related than for non - delivery - related
hospitalizations for hypertensive diseases. Hemorrhage, as the
underlying reason for hospitalization (either as primary or
secondary diagnosis), occurred much more frequently for
delivery - than non - delivery - related hospitalizations. Non -
delivery hospitalizations for genitourinary infections occurred
three times more frequently (10.45%) than for delivery - related
Epidemiology of Critical Illness in Pregnancy
3
Table 1.1 Rate (per 100 hospitalizations) of delivery and non - delivery hospitalizations, and associated hospital lengths of stay ( LOS ) by diagnoses: USA , 1998 – 99.
Hospital admission diagnosis * Delivery hospitalization
(n = 7,965,173)
Non - delivery hospitalization
(n = 960,023)
Rate (%) Mean LOS (95% CI) Rate (%) Mean LOS (95% CI)
Hypertensive diseases
Chronic hypertension 3.05 3.0 (2.9, 3.2) 3.08 2.3 (1.9, 2.7)
Pre - eclampsia/eclampsia 4.08 3.7 (3.6, 3.9) 3.23 2.7 (1.8, 3.6)
Chronic hypertension + pre - eclampsia 0.24 6.3 (4.7, 7.8) 0.30 2.4 (1.8, 2.9)
Hemorrhage
Placental abruption 1.02 3.9 (3.5, 4.3) 0.72 3.4 (2.2, 4.7)
Placenta previa 0.44 5.5 (4.6, 6.5) 0.13 3.2 (2.0, 4.4)
Hemorrhage (unassigned etiology) 0.24 4.0 (3.2, 4.9) 1.58 1.7 (1.3, 2.2)
Vasa previa 0.17 2.6 (2.0, 3.2) – –
Postpartum hemorrhage 2.56 2.6 (2.5, 2.7) 0.83 2.3 (1.3, 2.9)
Infection - related
Viral infections (not malaria/rubella) 0.93 2.8 (2.6, 3.1) 1.04 2.6 (2.0, 3.2)
Genitourinary infections 3.19 3.4 (2.8, 3.9) 10.45 3.2 (2.5, 3.8)
Infection of the amniotic cavity 1.63 4.2 (3.7, 4.6) 0.16 4.2 (1.7, 6.7)
Anesthesia - related complications 0.02 4.7 (3.5, 5.9)
< 0.01
–
Diabetes
Pre - existing diabetes 0.60 4.6 (3.7, 5.4) 2.40 3.2 (2.7, 3.7)
Gestational diabetes 3.15 2.9 (2.8, 3.1) 2.50 3.5 (3.0, 4.1)
Preterm labor 10.28 3.4 (3.3, 3.6) 21.21 2.5 (2.3, 2.7)
Maternal anemia 7.13 2.9 (2.8, 3.0) 5.05 3.9 (3.2, 4.5)
Drug dependency 0.19 3.0 (2.3, 3.7) 0.53 3.6 (2.3, 4.8)
Renal disorders 0.13 3.4 (2.6, 4.3) 0.86 2.7 (2.1, 3.2)
Liver disorders 0.06 3.0 (2.2, 3.8) 0.08 31.2 (2.7, 59.6)
Congenital cardiovascular disease 0.94 3.0 (2.7, 3.4) 0.98 3.1 (2.3, 3.8)
Thyroid disorders 0.17 2.3 (1.6, 3.0) 0.53 3.0 (1.7, 4.4)
Uterine tumors 0.54 3.8 (3.4, 4.2) 0.63 2.6 (1.5, 3.6)
Uterine rupture 0.11 4.8 (3.3, 6.2) – –
Postpartum coagulation defects 0.11 4.9 (3.7, 6.1) 0.07 14.9 (0.2, 47.8)
Shock/hypotension 0.09 3.3 (2.6, 4.0) 0.15 2.2 (0.4, 4.1)
Acute renal failure 0.02 6.9 (4.1, 9.7) 0.02 –
Embolism - related
Amniotic fl uid embolism 0.02 6.8 (1.8, 11.7) – –
Blood - clot embolism
< 0.01
11.1 (2.7, 19.3) 0.19 5.2 (3.2, 7.5)
Other pulmonary embolism
< 0.01
– – –
* The diagnoses associated with hospital admissions include both primary and secondary reasons for hospitalizations. Each admission may have had up to six associated
diagnoses.
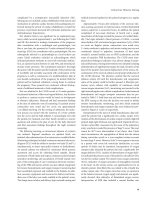
From the 1960s to the mid - 1980s, the maternal mortality ratio
in the US declined from approximately 27 per 100 000 live births
to about 7 per 100 000 live births (Figure 1.2 ). Subsequently, the
mortality ratio increased between 1987 (7.2 per 100 000 live
births) and 1990 (10.0 per 100 000 live births). During the period
1991 – 97, the mortality ratio further increased to 11.5 per 100 000
live births – an overall relative increase of 60% between 1987 and
1997. The reasons for the recent increases are not clear.
Several maternal risk factors have been examined in relation to
maternal deaths. Women aged 35 – 39 years carry a 2.6 - fold (95%
Chapter 1
4
births, followed by embolism - related deaths (PRMR 1.8),
and hypertensive diseases (PRMR 1.6). Among all live births,
hypertensive diseases (23.8%) were the most frequent cause of
death. Among stillbirths (27.2%) and ectopic (94.9%) pregnan-
cies, the chief cause of death was hemorrhage, while infections
(49.4%) were the leading cause of abortion - related maternal
deaths.
Understanding the epidemiology of pregnancy - related deaths
is essential in order to target specifi c interventions. Improved
population - based surveillance through targeted reviews of all
pregnancy - related deaths, as well as additional research to under-
stand the causes of maternal deaths by indication will help in
achieving the Healthy People 2010 goals.
CI 2.2, 3.1) increased risk of maternal death and those over 40
years are at a 5.9 - fold (95% CI 4.6, 7.7) increased risk. Black
maternal race confers a relative risk of 3.7 (95% CI 3.3, 4.1) for
maternal death compared with white women. Similarly, women
without any prenatal care during pregnancy had an almost
twofold increased risk of death relative to those who received
prenatal care [19] .
The chief cause for a pregnancy - related maternal death
depends on whether the pregnancy results in a live born,
stillbirth, ectopic pregnancy, abortion, or molar gestation
(Table 1.2 ). For the period 1987 – 90, hemorrhage was recorded
in 28.8% of all deaths, leading to an overall pregnancy - related
mortality ratio (PRMR) for hemorrhage of 2.6 per 100 000 live
Non-delivery relatedDelivery related
Thyroid
Drug dependency
Uterine tumor
Cardiovascular
Diabetes
Hemorrhage
Infections
Anemia
Hypertension
Preterm labor
0510
Rate (%) of hospitalizations per 100 deliveries
20 2515
Figure 1.1 Ten leading causes of delivery - and
non - delivery - related maternal hospitalizations in the
US, 1998 – 99.
30
25
20
15
10
5
0
Ratio
1967 1971 1975 1979 1983 1987 1991 1995
Year
Figure 1.2 Trends in maternal mortality ratio
(number of maternal deaths per 100 000 live births)
in the US, 1967 – 96. The term “ ratio ” is used
instead of “ rate ” because the numerator includes
some maternal deaths that were not related to live
births and thus were not included in the
denominator.
Epidemiology of Critical Illness in Pregnancy
5
these conditions on pregnancy outcomes. Table 1.3 shows the
results of our examination of perinatal mortality rates among
singleton and multiple births (twins, triplets and quadruplets) by
gestational age and high - risk conditions. The study population
comprises all births in the US that occurred in 1995 – 98. Data
were derived from the national linked birth/infant death fi les,
assembled by the National Center for Health Statistics of the
Centers for Disease Control and Prevention [20] . Gestational age
Perinatal m ortality
Perinatal mortality, defi ned by the World Health Organization as
fetal deaths plus deaths of live - born infants within the fi rst 28
days, is an important indicator of population health. Examination
of the maternal conditions related to perinatal mortality can
provide further information on the association and impact of
Table 1.3 Perinatal mortality rates among singleton and multiple gestations by gestational age and high - risk conditions: USA , 1995 – 98.
High - risk
conditions
20 – 27 weeks 28 – 32 weeks 33 – 36 weeks
≥ 37 weeks
PMR Relative risk
(95% CI)
PMR Relative risk
(95% CI)
PMR Relative risk
(95% CI)
PMR Relative risk
(95% CI)
Singletons
Number of births n = 103 755 n = 352 291 n = 1 072 784 n = 13 440 671
Hypertension 200.4 0.6 (0.5, 0.7) 53.1 0.6 (0.5, 0.6) 13.5 0.6 (0.5, 0.7) 3.6 1.3 (0.5, 0.7)
Hemorrhage 308.9 1.1 (1.0, 1.2) 73.1 1.4 (1.3, 1.5) 19.9 1.6 (1.5, 1.7) 3.6 1.6 (1.5, 1.7)
Diabetes 287.0 1.0 (0.9, 1.1) 60.8 1.2 (1.1, 1.3) 19.5 1.8 (1.7, 1.9) 5.0 2.3 (2.1, 2.4)
SGA 467.4 2.3 (2.1, 2.5) 196.3 6.2 (6.0, 6.4) 56.3 7.8 (7.5, 8.1) 9.1 5.5 (5.4, 5.7)
No complications 297.6 1.0 (Referent) 38.8 1.0 (Referent) 7.0 1.0 (Referent) 1.5 1.0 (Referent)
Multiples
Number of births n = 23 055 n = 76 329 n = 147 627 n = 187 109
Hypertension 183.5 0.7 (0.6, 0.8) 21.4 0.5 (0.4, 0.6) 5.3 0.6 (0.5, 0.7) 4.9 0.8 (0.6, 1.1)
Hemorrhage 251.6 1.0 (0.9, 1.1) 36.6 1.1 (1.0, 1.3) 9.6 1.2 (1.0, 1.4) 6.7 1.3 (1.1, 1.5)
Diabetes 214.9 0.8 (0.7, 1.1) 28.7 0.9 (0.7, 1.2) 9.7 1.3 (1.0, 1.7) 5.9 1.2 (0.9, 1.7)
SGA 394.5 2.0 (1.6, 2.4) 133.4 6.8 (6.3, 7.4) 36.8 7.5 (6.6, 8.4) 24.9 8.6 (7.6, 9.7)
No complications 251.1 1.0 (Referent) 23.4 1.0 (Referent) 5.2 1.0 (Referent) 2.8 1.0 (Referent)
CI, confi dence interval; PMR, perinatal mortality rate per 1000 births; SGA, small for gestational age births.
Hypertension includes chronic hypertension, pregnancy - induced hypertension, and eclampsia.
Hemorrhage includes placental abruption, placenta previa, uterine bleeding of undermined etiology.
No complications include those that did not have any complications listed in the table.
Relative risk for each high - risk condition was adjusted for all other high - risk conditions shown in the table.
Table 1.2 Pregnancy - related maternal deaths by underlying cause: USA , 1987 – 90. From Koonin et al. [53] .
Cause of death All outcomes Outcome of pregnancy (% distribution)
% PRMR * Live birth Stillbirth Ectopic Abortions † Molar Undelivered Unknown
Hemorrhage 28.8 2.6 21.1 27.2 94.9 18.5 16.7 15.7 20.1
Embolism 19.9 1.8 23.4 10.7 1.3 11.1 0.0 35.2 21.1
Hypertension 17.6 1.6 23.8 26.2 0.0 1.2 0.0 4.6 16.3
Infection 13.1 1.2 12.1 19.4 1.3 49.4 0.0 13.0 9.0
Cardiomyopathy 5.7 0.5 6.1 2.9 0.0 0.0 0.0 2.8 13.9
Anesthesia 2.5 0.2 2.7 0.0 1.9 8.6 0.0 1.8 1.0
Others/unknown 12.8 1.2 11.1 13.6 0.6 11.1 83.3 27.5 19.3
Total 100.0 – 100.0 100.0 100.0 100.0 100.0 100.0 100.0
* Pregnancy - related mortality ratio per 100 000 live births.
† Includes both spontaneous and induced abortions.
Chapter 1
6
related ICU admissions involved 37 maternity hospitals in
Maryland and included hospitals at all care levels [22] . This study
found a nearly 30% lower admission rate to ICUs for obstetric
patients from community hospitals compared with major teach-
ing hospitals. Another source of variation is the different criteria
for admission to the ICU used at different institutions. Finally,
there are major differences in the inclusion criteria used for these
studies that further contributes to the variability in reported ICU
utilization rates.
Reported maternal mortality for critically ill obstetric patients
admitted to an ICU is approximately 8.4% (Table 1.4 ). This
refl ects the true seriousness of the illnesses of these women. The
wide range of mortality from 0% to 33% is due to many factors.
Most of the studies were small and just a few deaths may affect
rates signifi cantly. The populations studied also differ in underly-
ing health status. Reports from less developed countries had
much higher mortality rates. The time period of the study can
have an impact. In general, earlier studies had higher maternal
mortality rates. These earlier studies represent the early stages of
development of care mechanisms for critically ill obstetric
patients. They probably refl ect part of the “ learning curve ” of
critical care obstetrics, as well as differences in available technol-
ogy [52] . Regardless, the mortality rate from these ICU admis-
sions is several orders of magnitude higher than the general US
population maternal mortality rate of 11.5 per 100 000 live births.
Therefore, these cases are a good representation of an obstetric
population with critical illnesses.
Illnesses r esponsible for o bstetric i ntensive
c are u nit a dmissions
Examination of obstetric ICU admissions provides some insight
into the nature of obstetric illnesses requiring critical care. Data
were pooled from 26 published studies that provided suffi cient
details about the primary indication for the ICU admission
(Table 1.5 ). It is no surprise that hypertensive diseases and obstet-
ric hemorrhage were responsible for over 50% of the primary
admitting diagnoses. Specifi c organ system dysfunction was
responsible for the majority of the remaining admissions. Of
those, pulmonary, cardiac, and infectious complications had the
greatest frequency. From these reports, it is apparent that both
obstetric and medical complications of pregnancy are responsible
for the ICU admissions in similar proportions. There were 16
studies that provided information on 1980 patients as to whether
the primary admitting diagnosis was related to an obstetric
complication or a medical complication [4,22,23,25,26,36 – 38,40,
42,43,46,49 – 51,54] . The pooled data indicate that approximately
69.3% (n = 1373) were classifi ed as obstetric related and 30.7%
(n = 607) were due to medical complications. These data clearly
highlight the complex nature of obstetric critical care illnesses
and provide support for a multidisciplinary approach to manage-
ment since these patients are quite ill with a variety of diseases.
was predominantly based on the date of last menstrual period
[21] , and was grouped as 20 – 27, 28 – 32, 33 – 36, and ≥ 37 weeks.
Perinatal mortality rates were assessed for hypertension (chronic
hypertension, pregnancy - induced hypertension, and eclampsia),
hemorrhage (placental abruption, placenta previa, and uterine
bleeding of undetermined etiology), diabetes (pre - existing and
gestational diabetes), and small for gestational age (SGA) births
(defi ned as birth weight below 10th centile for gestational age).
We derived norms for the 10th centile birth weight for singleton
and multiple births from the corresponding singleton and mul-
tiple births that occurred in 1995 – 98 in the US. Finally, relative
risks (with 95% CIs) for perinatal death by each high - risk condi-
tion were derived from multivariable logistic regression models
after adjusting for all other high - risk conditions.
Perinatal mortality rates progressively decline, among both
singleton and multiple births, for each high - risk condition with
increasing gestational age (Table 1.3 ). Among singleton and mul-
tiple gestations, with the exception of SGA births, mortality rates
were generally higher for each high - risk condition, relative to the
no complications group. Infants delivered small for their gesta-
tional age carried the highest risk of dying during the perinatal
period compared with those born to mothers without complica-
tions. Among singleton births, the relative risks for perinatal
death for SGA infants were 2.3, 6.2, 7.8, and 5.5 for those deliv-
ered at 20 – 27 weeks, 28 – 32 weeks, 33 – 36 weeks, and term, respec-
tively. Among multiple births, these relative risks were similar at
2.0, 6.8, 7.5, and 8.6, respectively, for each of the four gestational
age categories.
Pregnancy - r elated i ntensive c are
u nit a dmissions
Evaluation of obstetric admissions to intensive care units (ICUs)
may be one of the best ways to approach surveillance of critical
illnesses in pregnancy. Unfortunately, there are no publicly avail-
able population - based databases for obstetric admissions to ICU
that provide suffi ciently detailed information to allow in - depth
study of these conditions. Therefore, it is reasonable to examine
descriptive case series to provide information on these condi-
tions. We reviewed 33 studies published between 1990 and 2006
involving 1 955 111 deliveries and found an overall obstetric -
related admission rate to ICU of 0.07 – 0.89% (Table 1.4 ). Some
of the variation in the rates may be explained by the nature of the
populations studied. Hospitals that are tertiary referral centers for
large catchment areas typically receive a more concentrated high -
risk population. These facilities would be expected to have higher
rates of obstetric admissions to an ICU. However, these studies
provided suffi cient data to allow the exclusion of patients trans-
ported from outside facilities. Community - oriented facilities are
probably less likely to care for critically ill obstetric patients unless
the illnesses develop so acutely that they would preclude trans-
port to a higher - level facility. The largest study of pregnancy -
Epidemiology of Critical Illness in Pregnancy
7
Table 1.4 Obstetric admission rates to an intensive care unit ( ICU ) and corresponding maternal mortality rates from 33 studies.
Reference Year(s) Location Inclusion criteria Total
deliveries
Obstetric ICU
Admissions
(rate)
Obstetric ICU
deaths (rate)
Fetal/neonatal
deaths per ICU
admissions
Mabie & Sibai 1990 [22] 1986 – 89 US – 22 651 200 (0.88%) 7 (3.5%) –
Kilpatrick & Matthay 1992 [23] 1985 – 90 US Up to 6 weeks PP 8000 * 32 (0.4%) 4 (12.0%) 6 (18.8%)
Collop & Sahn 1993 [24] 1988 – 91 US
< 42 weeks
– 20 ( – ) 4 (20.0%) 7 (35.0%)
El - Solh & Grant 1996 [25] 1989 – 95 US Up to 10d PP – 96 ( – ) 10/93 (10.8%) 10 (10.4%)
Monoco et al. 1993 [26] 1983 – 90 US 16 weeks to 2 weeks PP 15 323 38 (0.25%) 7 (18.4%) 4 (10.5%)
Panchal et al. 2000 [27] 1984 – 97 US Delivering admission 822 591 1023 (0.12%) 34 (3.3%) –
Afessa et al. 2001 [28] 1991 – 98 US – – 78 ( – ) 2 (2.7%) 13 (16.7%)
Gilbert et al. 2000 [29] 1991 – 98 US Up to 6 weeks PP 49 349 233 (0.47%) 8 (3.4%) –
Hogg et al. 2000 [30] 1989 – 97 US 15 weeks to 6 weeks PP 30 405 172 (0.57%) 23 (13.4%) 2 (1.2%)
Munnur et al. 2005 [31] 1992 – 2001 US – 58 000 174(0.3%) 4 (2.3%) 23 (13.2%)
Mahutte et al. 1999 [4] 1991 – 97 Canada 14 weeks to 6 weeks PP 44 340 131 (0.30%) 3 (2.3%) –
Lapinsky et al. 1997 [32] 1997 Canada – 25 000 * 65 (0.26%) 0 7 (10.8%)
Baskett & Sternadel 1998 [6] 1980 – 93 Canada
> 20 weeks and PP
76 119 55 (0.07%) 2 (3.6%) –
Hazelgrove et al. 2001 [5] 1994 – 96 England Up to 6 weeks PP 122 850 210 (0.17%) 7 (3.3%) 40/200 (20.0%)
DeMello & Restall 1990 [33] 1985 – 89 England 20 – 42 weeks 9425 13 (0.14%) 0 –
Selo - Ojeme et al. 2005 [34] 1993 – 2003 England 14 weeks to 6 weeks PP 31 097 22 (0.11%) 1 (4.5%) 1 (4.5%)
Stephens 1991 [35] 1979 – 89 Australia Up to 4 weeks PP 61 435 126 (0.21%) 1 (0.8%) –
Tang et al. 1997 [36] 1988 – 95 China Up to 6 weeks PP 39 350 49 (0.12%) 2 (4.1%) 4 (8.2%)
Ng et al. 1992 [37] 1985 – 90 China Delivery related 16 264 37 (0.22%) 2 (5.4%) –
Cheng & Raman 2003 [38] 1994 – 1999 Singapore Up to 1 week PP 13 438 39 (0.28%) 2 (5.1%) –
Heinonen et al. 2002 [39] 1993 – 2000 Finland 18 weeks to 4 weeks PP 23 404 22 (0.14%) 1 (4.5%) –
Keizer et al. 2006 [40] 1990 – 2001 Netherlands Obstetrics admissions
with illness
18 581 142 (0.76%) 7 (4.9%) 35 (24.6%)
Bouvier - Colle et al. 1996 [41] 1991 France Up to 6 weeks PP 140 000 * 435 (0.31%) 22 (5.1%) 58 (13.3%)
Koeberle et al. 2000 [42] 1986 – 96 France Up to 6 weeks PP 27 059 * 46 (0.17%) 2 (4.3%) –
Munnur et al. 2005 [31] 1992 – 2001 India – 157 694 754 (0.48%) 189 (25%) 368 (48.81%)
Ryan et al. 2000 [43] 1996 – 98 Ireland – 26 164 17 (0.07%) 0 –
Cohen et al. 2000 [44] 1994 – 98 Israel 20 weeks to 2 weeks PP 19 474 46 (0.24%) 1 (2.3%) 10 (21.7%)
Lewinsohn et al. 1994 [45] 8 yrs Israel – – 58 ( – ) 4 (6.9%) –
Loverro et al. 2001 [46] 1987 – 1998 Italy – 23 694 41 (0.17%) 2 (4.9%) 5 (12.2%)
Okafor & Aniebue 2004 [47] 1997 – 2002 Nigeria – 6544 18 (0.28%) 6 (33%) –
Platteau et al. 1997 [48] 1992 South Africa – – 80 ( – ) 17 (21.3%) 39 (48.6%)
Demirkiran et al. 2003 [49] 1995 – 2000 Turkey – 14 045 * 125 (0.89%) 13 (9.6%) –
Mirghani et al. 2004 [50] 1997 – 2002 UAE – 23 383 60 (0.26%) 2 (3.3%) –
Suleiman et al. 2006 [51] 1992 – 2004 Saudi Arabia Up to 6 weeks PP 29 432 64 (0.22%) 6 (9.4%) 8/55 (14.5%)
Summary (pooled data) 1 955 111 4389 (0.22%) 395/4718 (8.4%) 640/2499 (25.6%)
PP, postpartum; ( – ) indicates data not provided or unable to be calculated (these values excluded from summaries of columns).
* Estimate calculated based on data in paper.
Causes of m ortality in o bstetric i ntensive
c are u nit a dmissions
When specifi c causes of mortality for the obstetric ICU admis-
sions were reviewed, 26 studies gave suffi cient data to assign a
primary etiology for maternal death (Table 1.6 ). Of a total of 138
maternal deaths, over 57% were related to complications of
hypertensive diseases, pulmonary illnesses, and cardiac diseases.
Other deaths were commonly related to complications of hemor-
rhage, bleeding into the central nervous system, malignancy,
and infection. More importantly, despite an identifi ed primary
Chapter 1
8
tality rate of 25.6%. Reported rates ranged from 1.2 – 48.8%. If the
large report from India is removed [31] , there were 272 of these
deaths among 1 745 cases, with a mortality rate of 15.6%. These
proportions may not refl ect a true perinatal mortality rate since
some of the losses may have occurred before 20 weeks gestation.
In addition, the denominator includes a number of postpartum
admissions for conditions not expected to impact fetal or neona-
tal mortality. Nevertheless, the high loss rate highlights the
importance of considering the fetus when managing critical ill-
nesses in pregnancy.
Summary
In summary, understanding the nature of critical illness in preg-
nancy is an important and evolving process. We have clearly
grown beyond simple mortality reviews for assessment of preg-
nancy - related critical illness. However, our currently available
tools and databases for examining these patients still need
improvement. Reports of critically ill women admitted to the
ICU have further refi ned our understanding of these diseases.
However, targeted surveillance of obstetric ICU admissions is
needed to identify variations in care and disease that may affect
management. As our understanding of these conditions contin-
ues to mature, we will hopefully gain greater insight into the
specifi c nature of these conditions that will lead to improved
prevention strategies and better therapies for the diseases when
they occur. In our view, these data will improve our ability to plan
and allocate the necessary resources to adequately care for these
often complex and severe illnesses.
etiology for the maternal deaths, nearly all cases were associated
with multiorgan dysfunction, which again emphasizes the
complex condition of these critically ill women.
As noted earlier, obstetric and medical complications of preg-
nancy are equally represented in all admissions to the ICU (Table
1.5 ). However, nearly 40% of all maternal deaths in the ICU were
directly related to obstetric conditions (mainly hypertensive dis-
eases, hemorrhage, amniotic fl uid embolism and acute fatty liver
of pregnancy) with the remaining deaths due to medical condi-
tions (Table 1.6 ).
Perinatal l oss 101th obstetric intensive care
unit admissions
When considering the implications of critical illness for obstetric
patients, the focus is usually on the mother. However, it is impor-
tant to re - emphasize that many of these conditions also may have
a signifi cant impact on fetal and neonatal outcomes. There is
surprisingly little detailed information available on these perina-
tal outcomes in pregnancies complicated by critical illnesses.
However, there are data on perinatal outcomes based on specifi c
disease conditions. Maternal high - risk conditions associated with
perinatal mortality in the US are presented in Table 1.3 . However,
these data do not separate outcomes by severity of maternal
illness. We were able to identify 18 studies that provided informa-
tion on fetal or neonatal mortality rates for obstetric admissions
to the ICU (Table 1.4 ). Fetal and/or neonatal deaths were identi-
fi ed in 640 of the pooled 2499 cases, resulting in an overall mor-
Table 1.5 Complications primarily responsible for admission to the intensive care unit for obstetric patients: data summarized from 26 published studies
[4 – 6,22 – 26,28,31,32,35 – 37,39,40,42 – 51] .
Category Category examples n Percentage
Hypertensive diseases Eclampsia, pre - eclampsia, HELLP syndrome, hypertensive crisis 1176 37.4
Hemorrhage Shock, abruption, previa, postpartum hemorrhage, accreta, uterine rupture 647 20.6
Pulmonary Pulmonary edema, pneumonia, adult respiratory distress syndrome, asthma, thromboembolic diseases, amniotic
fl uid embolus
287 9.1
Cardiac Valvular disease, arrhythmia, cardiomyopathy, infarction 187 5.9
Sepsis/infection Chorioamnionitis, pyelonephritis, malaria, hepatitis, meningitis, miscellaneous 288 9.2
Central nervous system Intracranial hemorrhage, seizure (non - eclamptic), arteriovenous malformation 92 2.9
Anesthesia complication Allergic reaction, failed intubation, high spinal 47 1.5
Gastrointestinal Pancreatitis, acute fatty liver of pregnancy, infl ammatory bowel disease, gallbladder disease 64 2.0
Renal Renal failure 30 1.0
Hematologic Thrombotic thrombocytopenic purpura, sickle cell disease, disseminated intravascular coagulation, aspiration 32 1.0
Endocrine Diabetic ketoacidosis, thyroid storm 52 1.7
Malignancy Various 17 0.5
Other Insuffi cient information to assign to specifi c organ system but included anaphylaxis, trauma, drug and overdose/
poisoning
227 7.2
Total 3146 100%