Critical Care Obstetrics part 5 ppsx
Bạn đang xem bản rút gọn của tài liệu. Xem và tải ngay bản đầy đủ của tài liệu tại đây (144.75 KB, 10 trang )
Critical Care Obstetric Nursing
29
10 Witcher PM . Promoting fetal stabilization during maternal hemody-
namic instability or respiratory insuffi ciency . Crit Care Nurs Q 2006 ;
29 ( 1 ): 70 – 76 .
11 Drummond SB , Troiano NH . Cardiac disorders during pregnancy .
In: Mandeville LK , Troiano NH , eds. AWHONN ’ S High - Risk and
Critical Care Intrapartum Nursing , 2nd edn. Philadelphia : Lippincott ,
1999 : 173 – 184 .
12 Sala DJ . Myocardial infarction . In: NAACOG ’ s Clinical Issues in
Perinatal and Women ’ s Health Nursing: Critical Care Obstetrics .
Philadelphia : Lippincott , 1992 : 443 – 453 .
13 Centers for Disease Control and Prevention . Guidelines for the pre-
vention of intravascular catheter - related infections . MMWR Morbidity
Mortality Weekly 2002 ; 51 ( RR - 10 ): 3 – 36 .
14 American Association of Critical Care Nurses . Practice Alert:
Preventing Catheter Related Bloodstream Infections . Washington, DC ,
2005 .
15 Preuss T , Wiegand DLM . Pulmonary artery catheter insertion (assist)
and pressure monitoring . In: Wiegand DLM , Carlson KK , eds. AACN
Procedure Manual for Critical Care, 5th edn . St. Louis : Elsevier
Saunders, Inc. , 2005 : 549 – 569 .
16 Chaiyakunapruk N , Veenstra DL , Lipsky BA , Saint S . Chlorhexidine
compared with providone - iodine solution for vascular catheter - site
care: A meta - analysis . Ann Intern Med 2002 ; 136 : 792 – 801 .
17 Posa PJ , Harrison , D , Vollman KM. Elimination of central line - asso-
ciated bloodstream infections: Application of the evidence . AACN
Advanced Critical Care 2006 ; 17 ( 4 ): 446 – 454 .
18 American Association of Critical Care Nurses . Evaluation of the
effects of heparinized and nonheparinized fl ush solutions on the
patency of arterial pressure monitoring lines: the AACN “ Thunder
Project ” . Am J Crit Care 1993 ; 2 : 3 – 13 .
19 Wallace DC , Winslow EH . Effects of iced and room temperature
injectate on cardiac output measurements in critically ill patients
with decreased and increased cardiac outputs . Heart Lung 1993 ; 22 :
55 – 63 .
20 Troiano NH , Dorman K . Mechanical ventilation during pregnancy .
In: Mandeville LK , Troiano NH , eds. AWHONN ’ S High - Risk and
Critical Care Intrapartum Nursing , 2nd edn. Philadelphia : Lippincott ,
1999 : 84 – 99 .
21 Troiano NH , Baird SM . Critical care of the obstetrical patient . In:
Kinney MR , Dunbar SB , Brooks - Brunn JA , Molter N , Vitello - Cicciu
JM , eds. AACN ’ s Clinical Reference for Critical Care Nursing , 4th edn.
St Louis : Mosby , 1998 : 1219 – 1239 .
22 Martin - Arafeh J , Watson CL , Baird SM . Promoting family centered
care in high risk pregnancy . J Perinat Neonat Nurs 1999 ; 13 ( 1 ).
23 Harvey MG . Humanizing the intensive care unit experience .
NAACOG ’ s Clinical Issues in Perinatal and Women ’ s Health Nursing:
Critical Care Obstetrics . 1992 ; 3 ( 3 ): 369 – 376 .
24 Jenkins TM , Troiano NH , Graves CR , Baird SM , Boehm FH .
Mechanical ventilation in an obstetric population: characteristics
and delivery rates . Am J Obstet Gynecol 2003 ; 188 ( 2 ): 549 –
552 .
25 North American Nursing Diagnosis Association . NANDA Nursing
Diagnoses: Defi nitions and Classifi cation . Philadelphia : Lippincott ,
2003 – 2004 .
Interpretation of these data indicates a normal baseline FHR,
presence of accelerations and absence of FHR decelerations. In
addition, decreased uterine contraction frequency was noted and
uterine resting tone by palpation was normal. Collectively, these
subsequent maternal and fetal assessment fi ndings were consid-
ered reassuring.
Strategies to p repare n urses to c are for
c ritically i ll o bstetric p atients
When creating a program to care for critically ill obstetric
women, careful attention should be paid to the identifi cation of
nursing competencies necessary to create a safe practice environ-
ment. The theoretical basis for this enhanced level of practice
should be presented in a consistent and organized fashion.
Thorough discussion of content to be included would cover
maternal physiology and common pathophysiology of preg-
nancy complications that are common in the critically ill
obstetric population. However, didactic material should be
accompanied by the opportunity for nurses to gain clinical prac-
tice in a mentored, supervised setting to verify competency of
skills. The subject of critical care obstetric staff is addressed in
Chapter 2 of this text. Additional resources are available in the
literature to address this subject.
References
1 Clark SL , Phelan JP , Cotton DB , eds. Critical Care Obstetrics . Medical
Economics Books, Oradell, New Jersey, 1987 .
2 Hankins GDV . Foreword . In: Harvey CJ , ed. Critical Care Obstetrical
Nursing . Gaithersburg, Maryland : Aspen Publishers, Inc. , 1991 .
3 F e d o r k a P . D e fi ning the standard of care . In AWHONN ’ s Liability
Issues in Perinatal Nursing . Philadelphia : Lippincott , 1997 .
4 American Nurses Association . Standards of Clinical Nursing Practice .
Washington, DC, 1991 .
5 Association of Women ’ s Health, Obstetric and Neonatal Nurses .
Standards for Professional Nursing Practice in the Care of Women
and Newborns , 6th edn. Washington, DC, 2003 .
6 Joint Commission for Accreditation of Healthcare Organizations .
Comprehensive Accreditation Manual for Hospitals: The Offi cial
Handbook (CAMH) , 2007 .
7 P a g e A . Keeping Patients Safe: Transforming the Work Environment of
Nurses . Washington, DC : The National Academy Press , 2003 .
8 Baggs JG , Schmitt MH , Mushlin AI , Mitchell PH , Eldredge DH ,
Hutson AD . Association between nurse - physician collaboration and
patient outcomes in three intensive care units . Crit Care Med 200 ; 31 ,
956 – 959 .
9 Baird SM , Kennedy B . Myocardial infarction in pregnancy . J Perinat
Neonat Nurs 2006 ; 220 ( 4 ): 311 – 321 .
30
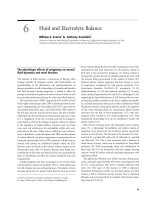
Critical Care Obstetrics, 5th edition. Edited by M. Belfort, G. Saade,
M. Foley, J. Phelan and G. Dildy. © 2010 Blackwell Publishing Ltd.
4
Pregnancy - Induced Physiologic Alterations
Errol R. Norwitz
1
& Julian N. Robinson
2
1
Department of Obstetrics and Gynecology, Tufts University School of Medicine and Tufts Medical Center, Boston, MA, USA
2
Harvard Medical School, Division of Maternal - Fetal Medicine, Department of Obstetrics, Gynecology and Reproductive
Biology, Brigham and Women ’ s Hospital, Boston, MA, USA
Physiologic adaptations occur in the mother in response to the
demands of pregnancy. These demands include support of the
fetus (volume support, nutritional and oxygen supply, and clear-
ance of fetal waste), protection of the fetus (from starvation,
drugs, toxins), preparation of the uterus for labor, and protection
of the mother from potential cardiovascular injury at delivery.
Variables such as maternal age, multiple gestation, ethnicity, and
genetic factors affect the ability of the mother to adapt to the
demands of pregnancy. All maternal systems are required to
adapt; however, the quality, degree, and timing of the adaptation
vary from one individual to another and from one organ system
to another. This chapter reviews in detail the normal physiologic
adaptations that occur within each of the major maternal organ
systems. A detailed discussion of fetal physiology is beyond the
scope of this review. A better understanding of the normal
physiologic adaptations of pregnancy will improve the ability of
clinicians to anticipate the effects of pregnancy on underlying
medical conditions and to manage pregnancy - associated
complications.
Cardiovascular s ystem
Critical illnesses that compromise the cardiovascular system are
among the most challenging problems affecting pregnant women.
When evaluating patients for cardiovascular compromise, it is
important to be aware of the pregnancy - associated changes and
how these changes infl uence the various maternal hemodynamic
variables, including blood volume, blood pressure (BP), heart
rate, stroke volume, cardiac output, and systemic vascular resis-
tance (SVR). Factors such as maternal age, multiple pregnancy,
gestational age, body habitus, positioning, labor, regional anes-
thesia, and blood loss may further complicate the management
of such patients. This section reviews in detail the effects of preg-
nancy on the maternal cardiovascular system, and the relevance
of this information in the management of the critically ill obstet-
ric patient.
Blood v olume
Maternal plasma volume increases by 10% as early as the 7th
week of pregnancy. As summarized in Figure 4.1 , this increase
reaches a plateau of around 45 – 50% at 32 weeks, remaining stable
thereafter until delivery [1 – 6] . Although the magnitude of the
hypervolemia varies considerably between women, there is a ten-
dency for the same plasma volume expansion pattern to be
repeated during successive pregnancies in the same woman [4,7] .
Moreover, the magnitude of the hypervolemia varies with the
number of fetuses [7,8] . In a longitudinal study comparing blood
volume estimations during term pregnancy with that in the same
patient after pregnancy, Pritchard [7] demonstrated that blood
volume in a singleton pregnancy increased by an average of
1570 mL (+48%) as compared with 1960 mL in a twin pregnancy
(Table 4.1 ). There is a similar but less pronounced increase in red
cell mass during pregnancy (see Figure 4.1 ), likely due to the
stimulatory effect of placental hormones (chorionic somato-
mammotropin, progesterone, and possibly prolactin) on mater-
nal erythropoiesis [9,10] . These changes account for the maternal
dilutional anemia that develops in pregnancy despite seemingly
adequate iron stores [11] . Hemodilution is maximal at around
30 – 32 weeks of gestation.
The physiologic advantage of maternal hemodilution of preg-
nancy remains unclear. It may have a benefi cial effect on the
uteroplacental circulation by decreasing blood viscosity, thereby
improving uteroplacental perfusion and possibly preventing
stasis and resultant placental thrombosis [12] . Blood volume
changes are closely related to maternal morbidity, and hypervol-
emia likely serves as a protective mechanism against excessive
blood loss at delivery. Pre - eclamptic women, for example, are less
tolerant of peripartum blood loss because, although total body
fl uid overloaded, they have a markedly reduced intravascular
volume as compared with normotensive parturients, due primar-
ily to an increase in capillary permeability (Table 4.2 ) [13] . The
precise etiology for this increased capillary permeability in the
Pregnancy-Induced Physiologic Alterations
31
plasma volume as measured by Evans blue dye dilution in
term pregnancies with normal and growth - restricted fetuses.
Pregnancies complicated by fetal intrauterine growth restriction
(IUGR) had signifi cantly lower mean maternal plasma volumes
as compared with pregnancies with well - grown fetuses
(2976 ± 76 mL vs 3594 ± 103 mL, respectively). Moreover, recent
studies have found that low pre - pregnancy plasma volumes in
formerly pre - eclamptic women predispose to a recurrence of pre -
eclampsia and adverse pregnancy outcome in a subsequent preg-
nancy [18] . The physiologic mechanisms responsible for these
pregnancy - associated changes in blood volume are not fully
understood. Pregnancy may best be regarded as a state of volume
overload resulting primarily from renal sodium and water reten-
tion, with a shift of fl uid from the intravascular to the extravas-
cular space. Indeed, in addition to fetal growth, a substantial part
of maternal weight gain during pregnancy results from fl uid
accumulation. Unlike other arterial vasodilatory states, preg-
nancy is associated with an increase in renal glomerular fi ltration
and fi ltered sodium load [19] , leading to an increase in urinary
sodium and water excretion [20] . To prevent excessive fl uid loss
and resultant compromise to uteroplacental perfusion, mineralo-
corticoid activity increases to promote sodium and water reten-
tion by the distal renal tubules. The increased mineralocorticoid
activity results primarily from extra - adrenal conversion of pro-
gesterone to deoxycorticosterone [21] . It is also possible that
another as yet unidentifi ed vasodilator(s) may be responsible for
the volume expansion, since studies in pregnant baboons have
demonstrated that systemic vasodilation precedes the measured
increase in maternal blood volume [22] . The net result of these
two opposing mechanisms is an accumulation during pregnancy
of approximately 500 – 900 mEq of sodium and 6 – 8 L of total body
water [23,24] .
There is also evidence to suggest that the fetus may contribute
to the increase in maternal plasma volume. Placental estrogens
are known to promote aldosterone production by directly activat-
ing the renin – angiotensin system, and the capacity of the placenta
to synthesize estrogens is dependent in large part on the avail-
ability of estrogen precursor (dehydroepiandrosterone) from the
fetal adrenal. As such, the fetus may regulate maternal plasma
setting of pre - eclampsia is not clear, but it appears to involve
excessive levels of circulating antiangiogenic factors [14 – 16] .
Normal maternal blood volume expansion also appears to be
important for fetal growth. Salas et al. [17] compared maternal
Figure 4.1 Blood volume changes during pregnancy. (Reproduced with
permission McLennon and Thouin [1] .)
Table 4.1 Blood and red cell volumes in normal women late in pregnancy and
again when not pregnant.
Late
pregnancy
Non - pregnant Increase
(mL)
Increase
(%)
Single fetus (n = 50)
Blood volume 4820 3250 1570 48
RBC volume 1790 1355 430 32
Hematocrit 37.0 41.7 – –
Twins (n = 30)
Blood volume 5820 3865 1960 51
RBC volume 2065 1580 485 31
Hematocrit 35.5 41.0 – –
Reproduced by permission from Pritchard JA. Changes in the blood volume
during pregnancy and delivery.
Anesthesiology
1965; 26: 393.
Table 4.2 Blood volume changes in fi ve women.
Non - pregnant Normal pregnancy Eclampsia
Blood volume (mL) 3035 4425 3530
Change (%) * – +47 +16
Hematocrit (%) 38.2 34.7 40.5
Blood volume estimation (chromium 51) during antepartum eclampsia, again
when non - pregnant, and fi nally at a comparable time in a second pregnancy
uncomplicated by hypertension.
* Change in blood volume (%) as compared with non - pregnant women.
Adapted by permission from Pritchard JA, Cunningham FG, Pritchard SA. The
Parkland Memorial Hospital protocol for treatment of eclampsia: evaluation of
245 cases.
Am J Obstet Gynecol
1984; 148: 951.
Chapter 4
32
thereby providing a reasonable explanation for a lower mean
arterial BP during the fi rst trimester.
Systolic and diastolic BP continue to decrease until midpreg-
nancy and then gradually recover to non - pregnant values by
term. A longitudinal study of 69 women during normal preg-
nancy demonstrated that the lowest arterial BP occurs at around
28 weeks of gestation (Figure 4.2 ) [29] . BP measurements can be
affected by maternal positioning. In this same series, BP was
lowest when measured with the patient in the left lateral decubi-
tus position, and increased by approximately 14 mmHg when
patients were rotated into the supine position [29] (Figure 4.3 ).
Despite the difference in absolute measurements, the pattern of
BP change throughout pregnancy was unaffected (see Figure 4.3 )
For the sake of consistency and standardization, all BP measure-
ments in pregnancy should be taken with the patient in the
sitting position.
Blood pressure measurements are also subject to change
depending on the technique used to attain the measurements. In
a series of 70 pregnant women, Ginsberg and Duncan [30] dem-
onstrated that mean systolic and diastolic BP were lower (by
− 6 mmHg and − 15 mmHg, respectively) when measurements
were taken directly using a radial intra - arterial line as compared
with indirect measurements using a standard sphygmomanome-
ter. Conversely, Kirshon and colleagues [31] found a signifi cantly
lower systolic (but not diastolic) BP when using an automated
sphygmomanometer as compared with direct radial intra - arterial
measurements in a series of 12 postpartum patients.
Heart r ate
Maternal heart rate increases as early as the 7th week of pregnancy
and by late pregnancy is increased approximately 20% as com-
pared with postpartum values [29] (Figure 4.4 ). It is likely that
volume through its effect on the placental renin – angiotensin
system [25] . In support of this mechanism, pregnancies compli-
cated by IUGR have lower circulating levels of aldosterone and
other vasodilator substances (prostacyclin, kallikrein) as com-
pared with pregnancies with well - grown fetuses [17] . However,
the fetus is not essential for the development of gestational hyper-
volemia, because it develops also in complete molar pregnancies
[26] .
Blood p ressure
Blood pressure (BP) is the product of cardiac output and SVR,
and refl ects the ability of the cardiovascular system to maintain
perfusion to the various organ systems, including the fetoplacen-
tal unit. Maternal BP is infl uenced by several factors, including
gestational age, measurement technique, and positioning.
Gestational age is an important factor when evaluating BP in
pregnancy. For example, a maternal sitting BP of 130/84 mmHg
would be considered normal at term but concerningly high at 20
weeks of gestation. A sustained elevation in BP of ≥ 140/90 should
be regarded as abnormal at any stage of pregnancy. Earlier reports
suggested that an increase in BP of ≥ 30 mmHg systolic or
≥ 15 mmHg diastolic over fi rst - or early second - trimester BP
should be used to defi ne hypertension; however, this concept is
no longer valid since many women exhibit such changes in
normal pregnancy [27,28] .
Blood pressure normally decreases approximately 10% by the
7th week of pregnancy [6] . This is likely due to systemic vasodila-
tion resulting from hormonal (progesterone) changes in early
pregnancy. Indeed, studies in baboons have shown that the fall
in arterial BP that occurs very early in pregnancy is due entirely
to the decrease in SVR [22] . The resultant increase in cardiac
output does not fully compensate for the diminished afterload,
Figure 4.2 Sequential changes in systolic and
diastolic BP throughout pregnancy with subjects
sitting and standing (n = 69; values are
mean ± SEM). Postpartum (PP) values drawn on the
ordinate are used as a baseline, and dashed lines
represent the presumed changes during the fi rst 8
weeks. (Reprinted by permission of the publisher
from Wilson M, Morganti AA, Zervodakis I, et al.
Blood pressure, the renin - aldosterone system, and
sex steroids throughout normal pregnancy.
Am J
Med
68: 97. Copyright 1980 by Excerpta Medica
Inc.)
Pregnancy-Induced Physiologic Alterations
33
Figure 4.3 Sequential changes in BP throughout pregnancy with
subjects in the supine and left lateral decubitus positions (n = 69; values
are mean ± SEM). The calculated change in systolic (open triangles) and
diastolic (closed triangles) BP produced by repositioning from the left
lateral decubitus to the supine position is illustrated. LLR, left lateral
recumbent; PP, postpartum. (Reprinted by permission of the publisher
from Wilson M, Morganti AA, Zervodakis I, et al. Blood pressure, the
renin - aldosterone system, and sex steroids throughout normal pregnancy.
Am J Med
68: 97. Copyright 1980 by Excerpta Medica Inc.)
Figure 4.4 Sequential changes in mean heart rate
in three positions throughout pregnancy (n = 69;
values are mean ± SEM). PP, postpartum. (Reprinted
by permission of the publisher from Wilson M,
Morganti AA, Zervodakis I, et al. Blood pressure, the
renin - aldosterone system, and sex steroids
throughout normal pregnancy.
Am J Med
68: 97.
Copyright 1980 by Excerpta Medica Inc.)
the increase in heart rate is a secondary (compensatory) effect
resulting from the decline in SVR during pregnancy [32] .
However, a direct effect of hormonal factors cannot be entirely
excluded. Although human chorionic gonadotropin (hCG) is an
unlikely candidate [33] , free thyroxine levels increase by 10 weeks
and remain elevated throughout pregnancy [33,34] . The possibil-
ity that thyroid hormones may be responsible for the maternal
tachycardia warrants further investigation.
In addition to pregnancy - associated changes, maternal
tachycardia can also result from other causes (such as fever,
pain, blood loss, hyperthyroidism, respiratory insuffi ciency,
and cardiac disease) which may have important clinical
implications for critically ill parturients. For example, women
with severe mitral stenosis must rely on diastolic ventricular
fi lling to achieve satisfactory cardiac output. Because left
ventricular diastolic fi lling is heart rate dependent, maternal
tachycardia can severely limit the capacity of such women
to maintain an adequate BP, and can lead to cardiovascular
shock and “ fetal distress ” . As such, the management of patients
with severe mitral stenosis should include, among other
Chapter 4
34
Beginning in the late 1940s, right heart catheterization pro-
vided a more refi ned although invasive method for studying
cardiac output. Hamilton [38] measured cardiac output in 24
non - gravid and 68 normal pregnant women by this technique.
Cardiac output averaged 4.51 ± 0.38 L/min in non - pregnant
women. In pregnancy, cardiac output began to increase at
approximately 10 – 13 weeks ’ gestation, reached a maximum of
5.73 L/min at 26 – 29 weeks, and returned to non - pregnant levels
by term. These observations have been confi rmed by subsequent
cross - sectional right heart catheterization studies in pregnant
women [39,40] .
Longitudinal studies using Doppler and M - mode echocardiog-
raphy to interrogate maternal cardiac output throughout preg-
nancy report confl icting results about the relative contributions
of heart rate and stroke volume. Katz and colleagues [49] attrib-
uted the elevation in cardiac output (+59% by the third trimester;
n = 19) to increases in both heart rate and stroke volume, whereas
the study by Mashini et al. [51] showed that the increase (+32%
in the third trimester; n = 16) was due almost exclusively to
maternal tachycardia. Laird - Meeter et al. [50] have suggested that
the initial increase in cardiac output prior to 20 weeks ’ gestation
is due to maternal tachycardia, whereas that observed after 20
weeks results from an increase in stroke volume due primarily to
reversible myocardial hypertrophy. Mabie and colleagues [54] ,
on the other hand, attributed the increase in cardiac output (from
6.7 ± 0.9 L/min at 8 – 11 weeks to 8.7 ± 1.4 L/min at 36 – 39 weeks;
n = 18) to augmentation of both heart rate (+29%) and stroke
parameters, careful control of maternal heart rate and cardiac
preload.
Cardiac o utput and s troke v olume
Cardiac output is the product of heart rate and stroke volume,
and refl ects the overall capacity of the left ventricle to maintain
systemic BP and thereby organ perfusion. Cardiac index is calcu-
lated by dividing cardiac output by body surface area (Table 4.3 ).
Although useful in non - pregnant women, cardiac index is less
useful in pregnant women because the normal correlation
between cardiac output and body surface area is lost in pregnancy
[35] . This may be explained, in part, by the observation that the
du Bois and du Bois [36] body surface area nomogram widely
used to calculate cardiac index is based on nine non - gravid sub-
jects and, as such may not apply to pregnant women.
Linhard [37] was the fi rst to report a 50% increase in cardiac
output during pregnancy using the indirect Fick method. Others
have studied maternal cardiac output by invasive catheterization
[38 – 41] , dye dilution [42 – 46] , impedance cardiography [47,48] ,
and echocardiography or Doppler ultrasound [49 – 53] . Despite
controversy about the relative contributions of stroke volume
and heart rate, maternal cardiac output increases as early as 10
weeks ’ gestation and peaks at 30 – 50% over non - pregnant values
by the latter part of the second trimester. This rise, from 4.5 to
6.0 L/min, is sustained for the remainder of the pregnancy.
Nulliparous women have a higher mean cardiac output than
multiparous women [53] .
Table 4.3 Cardiovascular parameters.
Parameter Units Comment/derivation
Measured directly using minimally invasive techniques
Systolic blood pressure (SBP) mmHg
Diastolic blood pressure (DBP) mmHg
Heart rate beats/min (bpm)
Measured directly using invasive techniques
Central venous pressure (CVP) mmHg Refl ects right ventricular preload
Pulmonary artery SBP mmHg
Pulmonary artery DBP mmHg
Pulmonary capillary wedge pressure (PCWP) mmHg Refl ects left ventricular preload
Derived from measured values
Pulse pressure mmHg
= SBP − DBP
Mean arterial pressure (MAP) mmHg = DBP + (pulse pressure/3)
Systemic vascular resistance (SVR)
dynes/sec/cm
− 5
= (MAP − CVP) (80)/CO
Peripheral vascular resistance (PVR)
dynes/sec/cm
− 5
= (MPAP − PCWP) (80)/CO
Cardiac output (CO) L/min = MAP/SVR
= HR (beats/min) × SV (mL/beat)
Stroke volume (SV) mL/beat = CO (L/min)/HR (beats/min)
Cardiac index (CI) L/min/m
2
= CO (L/min)/body surface area (m
2
)
Stroke volume index (SVI) mL/beat/m
2
= SV (mL/beat)/body surface area (m
2
)
Pregnancy-Induced Physiologic Alterations
35
midpregnancy values). Stroke volume was increased by 8 weeks,
with maximal values (+32% over midpregnancy levels) attained
at 16 – 20 weeks. Overall, maternal cardiac output increased from
4.88 L/min at 5 weeks to 7.21 L/min (+48%) at 32 weeks. The
mechanisms responsible for the increase in maternal cardiac
output during pregnancy remain unclear. An increase in circulat-
ing blood volume is unlikely to contribute signifi cantly to this
effect, because hemodynamic studies in pregnant baboons have
shown that the increase in cardiac output develops much earlier
than does the gestational hypervolemia [22] . Burwell et al. [64]
noted that the increase in plasma volume, cardiac output, and
heart rate during pregnancy was similar to that seen in patients
with arteriovenous shunting, and proposed that these hemody-
namic changes are the result of the low - pressure, high - volume
arteriovenous shunting that characterizes the uteroplacental cir-
culation. A third hypothesis is that hormonal factors (possibly
steroid hormones) may act directly on the cardiac musculature
to increase stroke volume and hence cardiac output, analogous
to the mechanisms responsible for the decrease in venous tone
seen in normal pregnancy [65] or after oral contraceptive admin-
istration [66] . In support of this hypothesis, high - dose estrogen
administration has been shown to increase stroke volume and
cardiac output in male transsexuals [67] . To further investigate
this hypothesis, Duvekot and colleagues [32] studied serial echo-
cardiographic, hormonal, and renal electrolyte measurements in
10 pregnant women. The authors propose that the inciting event
may be the fall in SVR that leads, in turn, to a compensatory
tachycardia with activation of volume - restoring mechanisms. In
this manner, the increased stroke volume may be a direct result
of “ normalized ” vascular fi lling in the setting of systemic after-
load reduction. These data support the conclusion of Morton and
co - workers [68] that early stroke volume increases are caused by
a “ shift to the right ” of the left ventricular pressure – volume curve
(Frank – Starling mechanism).
The cardiovascular changes in women carrying multiple preg-
nancies are greater than those described for singleton pregnan-
cies. Two - dimensional and M - mode echocardiography of 119
women with twins showed that cardiac output was 20% higher
than in women carrying singletons, and peaked at 30 weeks of
gestation [69] . This increase was due to a 15% increase in stroke
volume and 4.5% increase in heart rate.
Systemic v ascular r esistance
Systemic vascular resistance (SVR) is a measure of the impedance
to the ejection of blood into the maternal circulation (i.e. after-
load). Bader et al. [40] used cardiac catheterization to investigate
the effect of pregnancy on SVR. They demonstrated that SVR
decreases in early pregnancy, reaching a nadir at around 980
dynes/sec/cm
− 5
at 14 – 24 weeks. Thereafter, SVR rises progres-
sively for the remainder of pregnancy, approaching a pre - preg-
nancy value of around 1240 dynes/sec/cm
− 5
at term. These
fi ndings are consistent with subsequent studies [41] which found
a mean SVR of 1210 ± 266 dynes/sec/cm
− 5
during late
pregnancy.
volume (+18%) (Figure 4.5 ). The confl icting nature of these
studies can be attributed, in part, to the positioning of the patient
during examination (lateral recumbent versus supine position).
It must also be emphasized that although M - mode echocardio-
graphic estimation of stroke volume correlates well with angio-
graphic studies in non - gravid subjects, similar validation studies
have not been carried out during pregnancy [55,56] . For this
reason, ultrasound measurements of maternal volume fl ow in
pregnancy have been validated only against similar measure-
ments attained by thermodilution techniques [57 – 61] .
One criticism of the above studies is that the maternal hemo-
dynamic measurements in pregnancy are usually compared with
those from postpartum control subjects. This comparison may
not be valid, however, because cardiac output remains elevated
for many weeks after delivery [60,62] . To address this issue,
Robson et al. [63] measured cardiac output by Doppler echocar-
diography in 13 women before conception and again at monthly
intervals throughout pregnancy. Maternal heart rate was signifi -
cantly elevated by 5 weeks ’ gestation, and continued to increase
thereafter, reaching a plateau at around 32 weeks (+17% above
Figure 4.5 Hemodynamic changes during pregnancy and postpartum.
(Reproduced by permission from Mabie W, DiSessa TG, Crocker LG, et al. A
longitudinal study of cardiac output in normal human pregnancy.
Am J Obstet
Gynecol
1994; 170: 849.)
Chapter 4
36
Whether atrial natriuretic peptide (ANP) has a role to play in
the regulation of SVR in pregnancy is still unclear. ANP is a
peptide hormone produced by atrial cardiocytes, which promotes
renal sodium excretion and diuresis in non - pregnant subjects
[73] . In vitro , ANP has been shown to promote vasodilation in
vascular smooth muscle pretreated with angiotensin II. Circulating
ANP levels increase in pregnancy, suggesting that ANP may play
a role in decreasing maternal SVR [74,75] . Earlier cross - sectional
studies did not correlate ANP levels with blood volume and
hemodynamic measurements. In a prospective longitudinal
study, Thomsen et al. [76] demonstrated that plasma ANP levels
were positively correlated with Doppler ultrasound estimates of
peripheral vascular resistance. Although their results substantiate
the physiologic importance of ANP in the regulation of blood
volume, the authors conclude that ANP does not function as a
signifi cant vasodilator during pregnancy.
Regional b lood fl ow
Signifi cant regional blood fl ow changes have been documented
during pregnancy. For example, renal blood fl ow increases by
30% over non - pregnant values by midpregnancy and remains
elevated for the remainder of pregnancy [77,78] . As a result,
glomerular fi ltration rate increases 30 – 50% [70] . Similarly, skin
perfusion increases slowly to 18 – 20 weeks ’ gestation but rises
rapidly thereafter, reaching a plateau at 20 – 30 weeks that persists
until approximately 1 week postpartum [79] . This is likely due
When describing the physiologic relationship between pres-
sure and fl ow, it is customary to report vascular impedance as a
ratio of pressure to fl ow (see Table 4.3 ). The observed decrease
in SVR during pregnancy results primarily from a decrease in
mean arterial pressure coupled with an increase in cardiac output.
It is important to recognize the inverse relationship between
cardiac output and SVR.
Peripheral arterial vasodilation with relative underfi lling of the
arterial circulation is likely the primary event responsible for the
decrease in SVR seen in early pregnancy [70,71] . The factors
responsible for this vasodilation are not clear but likely include
hormonal factors (progesterone) and peripheral vasodilators
such as nitric oxide [72] . The existence of a pregnancy - specifi c
vasodilatory substance has been postulated but it has yet to be
characterized. Cardiac afterload is further reduced by the pro-
gressive development of the low - resistance uteroplacental circu-
lation. The decrease in SVR in early pregnancy leads to activation
of compensatory homeostatic mechanisms designed to maintain
arterial blood volume by increasing cardiac output and promot-
ing sodium and water retention (summarized in Figure 4.6 ). This
is accomplished through activation of arterial baroreceptors,
upregulation of vasopressin, stimulation of the sympathetic
nervous system, and increased mineralocorticoid activity. In
addition to vasodilation, creation of a high - fl ow, low - resistance
circuit in the uteroplacental circulation also contributes signifi -
cantly to the decline in peripheral vascular resistance [63] .
High-output
cardiac failure
Sepsis
Cirrhosis Arterivenous
fistula
Pregnancy Arterial
vasodilators
PERIPHERAL
ARTERIAL VASODILATION
Activation of
arterial baroreceptors
Non-osmotic
vasopressin
stimulation
Stimulation of
sympathetic
nervous system
Activation of the
renin–angiotensin–
aldosterone system
CARDIAC
OUTPUT
WATER
RETENTION
PERIPHERAL ARTERIAL
VASCULAR AND RENAL
RESISTANCE
SODIUM
RETENTION
MAINTENANCE OF EFFECTIVE
ARTERIAL BLOOD VOLUME
Figure 4.6 Unifying hypothesis of renal sodium and water retention initiated by peripheral arterial vasodilation. (Reprinted by permission from the American College of
Obstetricians and Gynecologists.
Obstet Gynecol
1991; 77: 632.)
Pregnancy-Induced Physiologic Alterations
37
throughout their pregnancies (Figure 4.7 ). Maternal heart rate
was maximal (range, +13% to +20% compared with postpartum
values) at 28 – 32 weeks of pregnancy, and was further elevated in
the sitting position. Stroke volume increased early in pregnancy,
with maximal values by 20 – 24 weeks (range, +21% to +33%),
followed by a progressive decline towards term that was most
to vasodilation of dermal capillaries [80,81] and may serve as a
mechanism by which the excess heat of fetal metabolism is
allowed to dissipate from the maternal circulation. Pulmonary
blood fl ow increases during pregnancy from 4.88 L/min in early
pregnancy to 7.19 L/min at 38 weeks, an increase of around 32%
[82,83] . A small decrease in pulmonary vascular resistance was
noted at 8 weeks without any subsequent signifi cant change
thereafter. However, both non - invasive [82] and invasive studies
[40,41,84] have shown that mean pulmonary artery pressure
remains stable at around 14 mmHg, which is not signifi cantly
different from the non - gravid state.
The most dramatic change in regional blood fl ow in pregnancy
occurs in the uterus. Uterine blood fl ow increases from approxi-
mately 50 mL/min at 10 weeks to 500 mL/min at term [85,86] . At
term, therefore, uterine blood fl ow accounts for over 10% of
maternal cardiac output. This increase in blood fl ow is likely
related to hormonal factors, because animal studies have shown
a signifi cant decrease in uterine vascular resistance in response to
exogenous administration of estrogen and progesterone [87,88] .
Effect of p osture on m aternal h emodynamics
Prior to the 1960s, clinical investigators did not fully appreciate
the effects of postural change on maternal hemodynamics and
patients were often studied in the supine position. The unique
angiographic studies of Bieniarz et al. [89,90] demonstrate that
the gravid uterus can signifi cantly impair vena caval blood fl ow
in > 90% of women studied in the supine position, thereby pre-
disposing pregnant women to dependent edema and varicosities
of the lower extremities. Moreover, impairment of central venous
return in the supine position can result in decreased cardiac
output, a sudden drop in BP, bradycardia, and syncope [91] .
These clinical features were initially described by Howard et al.
[92] and are now commonly referred to as the “ supine hypoten-
sive syndrome. ” Symptomatic supine hypotension occurs in 8%
[93] to 14% [94] of women during late pregnancy. It is likely that
women with poor collateral circulation through the paravertebral
vessels may be predisposed to symptomatic supine hypotension,
because these vessels usually serve as an alternative route for
venous return from the pelvic organs and lower extremities [95] .
In addition to impairing venous return, compression by the
gravid uterus in the supine position can also result in partial
obstruction of blood fl ow through the aorta and its ancillary
branches, leading, for example, to diminished renal blood fl ow
[77,96] .
The clinical signifi cance of supine hypotension is not clear.
Vorys et al. [97] demonstrated an immediate 16% reduction in
cardiac output when women in the latter half of pregnancy were
moved from the supine to the dorsal lithotomy position, likely
due to the compressive effect of the gravid uterus on the vena
cava (Table 4.4 ). To investigate the effect of gestational age on
the maternal cardiovascular response to posture, Ueland and
Hansen [44] measured changes in resting heart rate, stroke
volume, and cardiac output for 11 normal gravid women in
various positions (sitting, supine, and left lateral decubitus)
Figure 4.7 Effect of posture on maternal hemodynamics. PP, postpartum.
(Reproduced by permission from Ueland K, Metcalfe J. Circulatory changes in
pregnancy.
Clin Obstet Gynecol
1975; 18: 41; modifi ed from Ueland K, Novy MJ,
Peterson EN, et al. Maternal cardiovascular dynamics. IV. The infl uence of
gestational age on the maternal cardiovascular response to posture and exercise.
Am J Obstet Gynecol
1969; 104: 856.)
Table 4.4 Changes in cardiac output with maternal position.
Late - trimester women (
n
= 31) Change from supine (%)
Horizontal left side +14
Trendelenburg left side +13
Lithotomy
− 16
Supine Trendelenburg
− 18
Reproduced by permission from Vorys N, Ullery JC, Hanusek GE. The cardiac
output changes in various positions in pregnancy.
Am J Obstet Gynecol
1961;
82: 1312.)
Chapter 4
38
strate that maternal BP was essentially unaffected by standing in
the third trimester of pregnancy, despite varying effects on cardiac
output (Table 4.6 ). The observed decrease in left ventricular
stroke work index on standing ( − 22%) was attributed to the
subject ’ s inability to compensate for the decrease in stroke volume
by heart rate alone as a result of Starling forces. Intrapulmonary
shunting is not affected by maternal position [102] . Whether
such postural changes have any clinical signifi cance in terms of
placental perfusion, birthweight, and/or preterm delivery is
unclear at this time [103,104] .
Conventional wisdom teaches us that low blood pressure in
pregnancy is reassuring, but recent studies suggest that sustained
low blood pressure in the third trimester (defi ned as a maximum
diastolic blood pressure < 65 mmHg) is a risk factor for stillbirth
and growth restriction [105 – 108] . The rise in blood pressure in
the third trimester of pregnancy likely represents a healthy physi-
ologic response of the maternal cardiovascular system to the rela-
tive inability of the placenta to keep pace with fetal growth, and
striking in the supine position. Indeed, measurements of stroke
volume and cardiac output in the supine position at term were
even lower than the corresponding values in the postpartum
period (see Figure 4.7 ). On an optimistic note, Calvin and associ-
ates [94] were able to demonstrate that supine hypotension does
not normally result in signifi cant oxygen desaturation.
To investigate the effect of standing on the maternal hemody-
namic profi le, Easterling et al. [98] measured cardiac output and
SVR in the recumbent, sitting, and standing positions in women
during early (11.1 ± 1.4 weeks) and late (36.7 ± 1.6 weeks) preg-
nancy. A change from the recumbent to standing position resulted
in a decrease in cardiac output of around 1.7 L/min at any stage
of gestation with a compensatory SVR augmentation (Table 4.5 ).
Of note, the compensatory increase in SVR was signifi cantly
blunted in late pregnancy as compared with non - pregnant
subjects, which may be related to the altered response to norepi-
nephrine observed during pregnancy [99,100] . In addition to
confi rming these fi ndings, Clark et al. [101] were able to demon-
Non - pregnant Early pregnancy Late pregnancy
P
*
MAP (mmHg)
78 ± 8.3 4.7 ± 7.7 5.0 ± 11.3
NS
Heart rate (bpm)
15.5 ± 9.2 25.7 ± 11.8 16.7 ± 11.2
NS
CO (L/min)
− 1.8 ± 0.84 − 1.8 ± 0.79 − 1.7 ± 1.2
NS
Stroke volume (mL/beat)
− 41.1 ± 15.8 − 38.7 ± 14.5 − 30.8 ± 17.5
NS
SVR (dynes/sec/cm
− 5
) 732 ± 363 588 ± 246 379 ± 214
0.005
Data are presented as mean ± S D .
* Determined by analysis of variance.
CO, cardiac output; MAP, mean arterial pressure; NS, not signifi cant; SVR, systemic vascular resistance.
Reproduced with permission from the American College of Obstetricians and Gynecologists.
Obstet Gynecol
1988; 72: 550.
Table 4.5 Net change in hemodynamic parameters
from recumbent to standing positions.
Hemodynamic parameter Position
Left lateral Supine Sitting Standing
MAP (mmHg)
90 ± 6 9 0 ± 8 9 0 ± 8 9 1 ± 14
CO (L/min)
6.6 ± 1.4 6.0 ± 1.4 * 6.2 ± 2.0 5.4 ± 2.0 *
Heart rate (bpm)
82 ± 10 84 ± 10 91 ± 11 107 ± 1 7 *
SVR (dynes/sec/cm
− 5
) 1210 ± 266 1437 ± 338 1217 ± 254 1319 ± 394
PVR (dynes/sec/cm
− 5
) 76 ± 16 101 ± 45 102 ± 35 117 ± 3 5 *
PCWP (mmHg)
8 ± 2 6 ± 3 4 ± 4 4 ± 2
CVP (mmHg)
4 ± 3 3 ± 2 1 ± 1 1 ± 2
LVSWI (g/min/m
− 2
) 43 ± 9 4 0 ± 9 4 4 ± 5 3 4 ± 7 *
* p < 0.05, compared with left lateral position.
CO, cardiac output; CVP, central venous pressure; LVSWI, left ventricular stroke work index; MAP, mean arterial
pressure; PCWP, pulmonary capillary wedge pressure; PVR, pulmonary vascular resistance; SVR, systemic vascular
resistance.
Reproduced with permission from Clark SL, Cotton DB, Pivarnik JM, et al. Position change and central
hemodynamic profi le during normal third - trimester pregnancy and postpartum.
Am J Obstet Gynecol
1991; 164:
884.)
Table 4.6 Hemodynamic alterations in response to
position change late in third trimester of pregnancy.