Critical Care Obstetrics part 7 pps
Bạn đang xem bản rút gọn của tài liệu. Xem và tải ngay bản đầy đủ của tài liệu tại đây (193.58 KB, 10 trang )
Pregnancy-Induced Physiologic Alterations
49
70 Schrier RW . Pathogenesis of sodium and water retention in high -
output and low - output cardiac failure, nephrotic syndrome, cir-
rhosis, and pregnancy . N Engl J Med 1988 ; 319 : 1127 – 1134 .
71 Schrier RW . Body fl uid volume regulation in health and disease: a
unifying hypothesis . Ann Intern Med 1990 ; 113 : 155 – 159 .
72 Seligman SP , Kadner SS , Finlay TH . Relationship between pre-
eclampsia, hypoxia, and production of nitric oxide by the placenta .
Am J Obstet Gynecol 1996 ; 174 : abstract.
73 Brenner BM , Ballermann BJ , Gunning ME , Zeidel ML . Diverse bio-
logical actions of atrial natriuretic peptide . Physiol Rev 1990 ; 70 :
665 – 669 .
74 Cusson JR , Gutkowska , J , Rey E , et al. Plasma concentration of atrial
natriuretic factor in normal pregnancy . N Engl J Med 1985 ; 313 :
1230 – 1231 .
75 Thomsen JK , Storm TL , Thamsborg G , et al. Increased concentra-
tion of circulating atrial natriuretic peptide during normal preg-
nancy . Eur J Obstet Gynecol Reprod Biol 1988 ; 27 : 197 – 201 .
76 Thomsen JK , Fogh - Anderson N , Jaszczak P , Giese J . Atrial natri-
uretic peptide (ANP) decrease during normal pregnancy as related
to hemodynamic changes and volume regulation . Acta Obstet
Gynecol Scand 1993 ; 72 : 103 – 110 .
77 Chesley LC . Renal functional changes in normal pregnancy . Clin
Obstet Gynecol 1960 ; 3 : 349 .
78 Gabert HA , Miller JM . Renal disease during pregnancy . Obstet
Gynecol Surv 1985 ; 40 : 449 – 461 .
79 Katz M , Sokal MM . Skin perfusion in pregnancy . Am J Obstet
Gynecol 1980 ; 137 : 30 – 34 .
80 Burt CC . Peripheral skin temperature in normal pregnancy . Lancet
1949 ; 2 : 787 .
81 Herbert CM , Banner EA , Wakim KG . Variations in the peripheral
circulation during pregnancy . Am J Obstet Gynecol 1958 ; 76 : 742 .
82 Kitabatake A , Inoue M , Asao M , et al. Noninvasive evaluation of
pulmonary hypertension by a pulsed Doppler technique . Circulation
1983 ; 68 : 302 – 309 .
83 Robson SC , Hunter S , Boys J , Dunlop W . Serial changes in pulmo-
nary haemodynamics during human pregnancy: a non - invasive
study using Doppler echocardiography . Clin Sci 1991 ; 80 :
113 – 117 .
84 Werko L . Pregnancy and heart disease . Acta Obstet Gynecol Scand
1954 ; 33 : 162 .
85 Metcalfe J , Romney SL , Ramsy LH , et al. Estimation of uterine blood
fl ow in normal human pregnancy at term . J Clin Invest 1955 ; 34 :
1632 .
86 Assali NS , Rauramo L , Peltonen T . Measurement of uterine blood
fl ow and uterine metabolism. VIII. Uterine and fetal blood fl ow and
oxygen consumption in early human pregnancy . Am J Obstet
Gynecol 1960 ; 79 : 86 – 98 .
87 Ueland K , Parer JT . Effects of estrogens on the cardiovascular system
of the ewe . Am J Obstet Gynecol 1966 ; 96 : 400 – 406 .
88 Caton D , Abrams RM , Clapp JF , et al. The effect of exogenous pro-
gesterone on the rate of blood fl ow of the uterus of ovariectomized
sheep . Q J Exp Physiol Cogn Med Sci 1974 ; 59 : 225 – 231 .
89 Bieniarz J , Maqueda E , Caldeyro - Barcia R . Compression of aorta by
the uterus in late human pregnancy. I. Variations between femoral
and brachial artery pressure with changes from hypertension to
hypotension . Am J Obstet Gynecol 1966 ; 95 : 795 – 808 .
90 Bieniarz J , Crottogini JJ , Curuchet E , et al. Aortocaval compression
by the uterus in late human pregnancy. II. An arteriographic study .
Am J Obstet Gynecol 1968 ; 100 : 204 .
50 Laird - Meeter K , van de Ley G , Bom TH , et al. Cardiocirculatory
adjustments during pregnancy – an echocardiographic study .
Clin
Cardiol 1979 ; 2 : 328 – 332 .
51 Mashini IS , Albazzaz SJ , Fadel HE , et al. Serial noninvasive evalua-
tion of cardiovascular hemodynamics during pregnancy . Am J
Obstet Gynecol 1987 ; 156 : 1208 – 1214 .
52 Easterling TR , Benedetti TJ , Schmucker BC , Millard SP . Maternal
hemodynamics in normal and preeclamptic pregnancies: a longitu-
dinal study . Obstet Gynecol 1990 ; 76 : 1061 – 1069 .
53 Van Oppen ACC , van der Tweel I , Alsbach GPJ , et al. A longitudinal
study of maternal hemodynamics during normal pregnancy . Obstet
Gynecol 1996 ; 88 : 40 – 46 .
54 Mabie WC , DiSessa TG , Crocker LG , et al. A longitudinal study of
cardiac output in normal human pregnancy . Am J Obstet Gynecol
1994 ; 170 : 849 – 856 .
55 Pombo JF , Troy BL , Russell RO . Left ventricular volumes and ejec-
tion fraction by echocardiography . Circulation 1971 ; 43 : 480 – 490 .
56 Murray JA , Johnston W , Reid JM . Echocardiographic determination
of left ventricular dimensions, volumes, and performance . Am J
Cardiol 1972 ; 30 : 252 – 257 .
57 Easterling TR , Watts DH , Schmucker BC , Benedetti TJ . Measurement
of cardiac output during pregnancy: validation of Doppler tech-
nique and clinical observations in preeclampsia . Obstet Gynecol
1987 ; 69 : 845 – 850 .
58 Robson SC , Dunlop W , Boys RJ , Hunter S . Cardiac output during
labor . BMJ 1987 ; 295 : 1169 – 1172 .
59 Robson SC , Dunlop W , Moore M , Hunter S . Combined Doppler and
echocardiographic measurement of cardiac output: theory and appli-
cation in pregnancy . Br J Obstet Gynaecol 1987 ; 94 : 1014 – 1027 .
60 Robson SC , Hunter S , Moore M , Dunlop W . Haemodynamic
changes during the puerperium: a Doppler and M - mode echocar-
diographic study . Br J Obstet Gynaecol 1987 ; 94 : 1028 – 1039 .
61 Lee W , Rokey R , Cotton DB . Noninvasive maternal stroke volume
and cardiac output determinations by pulsed Doppler echocardiog-
raphy . Am J Obstet Gynecol 1988 ; 158 : 505 – 510 .
62 Capeless EL , Clapp JF . When do cardiovascular parameters return
to their preconception values? Am J Obstet Gynecol 1991 ; 165 :
883 – 886 .
63 Robson SC , Hunter S , Boys RJ , Dunlop W . Serial study of factors
infl uencing changes in cardiac output during human pregnancy . Am
J Physiol 1989 ; 256 : H1060 – 1065 .
64 Burwell CS , Strayhorn WD , Flickinger D , et al. Circulation during
pregnancy . Arch Intern Med 1938 ; 62 : 979 .
65 McCalden RA . The inhibitory action of oestradiol - 17b and proges-
terone on venous smooth muscle . Br J Pharmacol 1975 ; 53 :
183 – 192 .
66 Wook JE , Goodrich SM . Dilation of the veins with pregnancy or with
oral contraceptive therapy . Trans Am Clin Climatol Assoc 1964 ; 76 :
174 .
67 Slater AJ , Gude N , Clarke IJ , Walters WA . Haemodynamic changes
and left ventricular performance during high - dose oestrogen admin-
istration to male transsexuals . Br J Obstet Gynaecol 1986 ; 93 :
532 – 538 .
68 Morton M , Tsang H , Hohimer R , et al. Left ventricular size, output,
and structure during guinea pig pregnancy . Am J Physiol 1984 ; 246 :
R40 – 48.
69 Kametas NA , McAuliffe F , Krampl E , Chambers J , Nicolaides KH .
Maternal cardiac function in twin pregnancy . Obstet Gynecol 2003 ;
102 : 806 – 815 .
Chapter 4
50
114 Ueland K . Maternal cardiovascular dynamics. VII. Intrapartum
blood volume changes . Am J Obstet Gynecol 1976 ; 126 :
671 – 677 .
115 Kjeldsen J . Hemodynamic investigations during labor and delivery .
Acta Obstet Gynecol Scand 1979 ; 89 (Suppl): 1 – 252 .
116 Lee W , Rokey R , Cotton DB , Miller JF . Maternal hemodynamic
effects of uterine contractions by M - mode and pulsed - Doppler
echocardiography . Am J Obstet Gynecol 1989 ; 161 : 974 – 977 .
117 Robson SC , Hunter R , Boys W , et al. Changes in cardiac output
during epidural anaesthesia for caesarean section . Anaesthesia 1989 ;
44 : 475 – 479 .
118 Pritchard JA , Baldwin RM , Dickey JC , Wiggins KM . Blood volume
changes in pregnancy and the puerperium. II. Red blood cell loss
and changes in apparent blood volume during and following vaginal
delivery, cesarean section, and cesarean section plus total hysterec-
tomy . Am J Obstet Gynecol 1962 ; 84 : 1271 .
119 Wilcox CF , Hunt AR , Owen FA . The measurement of blood lost
during cesarean section . Am J Obstet Gynecol 1959 ; 77 : 772 .
120 Newton M , Mosey LM , Egli GE , et al. Blood loss during and imme-
diately after delivery . Obstet Gynecol 1961 ; 17 : 9 .
121 Cunningham FG , MacDonald PC , Gant NF , Leveno KJ , Gilstrap LC
III . The puerperium . In: Cunningham FG , MacDonald PC , Gant
NF , Leveno KJ , Gilstrap LC III , eds. Williams ’ Obstetrics , 19th edn.
Norwalk, CT : Appleton and Lange , 1993 : 467 .
122 Chesley LC , Valenti C , Uichano L . Alterations in body fl uid com-
partments and exchangeable sodium in early puerperium . Am J
Obstet Gynecol 1959 ; 77 : 1054 .
123 Hankins GD , Wendel GD , Cunningham FG , et al. Longitudinal
evaluation of hemodynamic changes in eclampsia . Am J Obstet
Gynecol 1984 ; 150 : 506 – 512 .
124 Lee W , Cotton DB . Peripartum cardiomyopathy: current concepts
and clinical management . Clin Obstet Gynecol 1989 ; 32 : 54 – 67 .
125 Sobol SE , Frenkiel S , Nachtigal D , Wiener D , Teblum C . Clinical
manifestations of sinonasal pathology during pregnancy . J
Otolaryngol 2001 ; 30 : 24 – 28 .
126 Braithwaite JM , Economides DL . Severe recurrent epistaxis causing
antepartum fetal distress . Int J Gynaecol Obstet 1995 ; 50 : 197 – 198 .
127 Howard DJ . Life - threatening epistaxis in pregnancy . J Laryngol Otol
1985 ; 99 : 95 – 96 .
128 MacKenzie JN . The physiological and pathological relations between
the nose and the sexual apparatus of man . Alienist Neurol 1898 ; 19 :
219 .
129 Mabry RL . Rhinitis of pregnancy . South Med J 1986 ; 79 : 965 .
130 Schatz M , Zieger RS . Diagnosis and management of rhinitis during
pregnancy . Allergy Proc 1988 ; 9 : 545 – 554 .
131 Mortimer H , Wright RP , Collip JB . The effect of the administration
of oestrogenic hormones on the nasal mucosa of the monkey
( Macata mulatta ) . Can Med Assoc J 1936 ; 35 : 504 .
132 Taylor M . An experimental study of the infl uence of the endocrine
system on the nasal respiratory mucosa . J Laryngol Otol 1961 ; 75 :
972 .
133 Toppozada H , Michaels L , Toppozada M , et al. The human respira-
tory mucosa in pregnancy . J Laryngol Otol 1982 ; 96 : 613 – 626 .
134 Reynolds SRM , Foster FI . Acetylcholine - equivalent content of the
nasal mucosa in rabbits and cats, before and after administration of
estrogen . Am J Physiol 1940 ; 131 : 422 .
135 Contreras G , Guitierrez M , Beroiza T , et al. Ventilatory drive and
respiratory muscle function in pregnancy . Am Rev Respir Dis 1991 ;
144 : 837 – 841 .
91 Kerr MG . Cardiovascular dynamics in pregnancy and labour . Br
Med Bull 1968 ; 24 : 19 .
92 Howard BK , Goodson JH , Mengert WF . Supine hypotensive syn-
drome in late pregnancy . Obstet Gynecol 1953 ; 1 : 371 .
93 Holmes F . Incidence of the supine hypotensive syndrome in late
pregnancy . J Obstet Gynaecol Br Emp 1960 ; 67 : 254 .
94 Calvin S , Jones OW , Knieriem K , Weinstein L . Oxygen saturation in
the supine hypotensive syndrome . Obstet Gynecol 1988 ; 71 :
872 – 877 .
95 Kinsella SM , Lohmann G . Supine hypotensive syndrome . Obstet
Gynecol 1994 ; 83 ( 5 Pt 1 ): 774 – 788 .
96 Lindheimer MD , Katz AI . Renal function in pregnancy . Obstet
Gynecol Annu 1972 ; 1 : 139 – 176 .
97 Vorys N , Ullery JC , Hanusek GE . The cardiac output changes in
various positions in pregnancy . Am J Obstet Gynecol 1961 ; 82 : 1312 .
98 Easterling TR , Schmucker BC , Benedetti TJ . The hemodynamic
effects of orthostatic stress during pregnancy . Obstet Gynecol 1988 ;
72 : 550 – 552 .
99 Barron WM , Mujais SK , Zinaman M , et al. Plasma catecholamine
responses to physiologic stimuli in normal human pregnancy . Am J
Obstet Gynecol 1986 ; 154 : 80 – 84 .
100 Nisell H , Lunell N , Linde B . Maternal hemodynamics and impaired
fetal growth in pregnancy - induced hypertension . Obstet Gynecol
1988 ; 71 : 163 – 166 .
101 Clark SL , Cotton DB , Pivarnik JM , et al. Position change and central
hemodynamic profi le during normal third - trimester pregnancy and
postpartum . Am J Obstet Gynecol 1991 ; 164 : 883 – 887 .
102 Hankins GDV , Harvey CJ , Clark SL , et al. The effects of maternal
position and cardiac output on intrapulmonary shunt in normal
third - trimester pregnancy . Obstet Gynecol 1996 ; 88 : 327 – 330 .
103 Naeye RL , Peters EC . Working during pregnancy: effects on the
fetus . Pediatrics 1982 ; 69 : 724 – 727 .
104 Henriksen TB , Hedegaard M , Secher NJ , Wilcox AJ . Standing at
work and preterm delivery . Br J Obstet Gynaecol 1995 ; 102 :
198 – 206 .
105 Friedman EA , Neff RK . Hypertension - hypotension in pregnancy.
Correlation with fetal outcome . JAMA 1978 ; 239 : 2249 – 2251 .
106 Grunberger W , Leodolter S , Parschalk O . Maternal hypotension:
fetal outcome in treated and untreated cases . Gynecol Obstet Invest
1979 ; 10 : 32 – 38 .
107 Ng PH , Walters WA . The effects of chronic maternal hypotension
during pregnancy . Aust NZ J Obstet Gynaecol 1992 ; 32 : 14 – 16 .
108 Steer PJ , Little MP , Kold - Jensen T , Chapple J , Elliott P . Maternal
blood pressure in pregnancy, birth weight, and perinatal mortality
in fi rst births: prospective study . BMJ 2004 ; 329 : 1312 – 1317 .
109 Easterling TR , Brateng D , Schmucker B , Brown Z , Millard SP .
Prevention of preeclampsia: a randomized trial of atenolol in hyper-
dynamic patients before onset of hypertension . Obstet Gynecol 1999 ;
93 : 725 – 734 .
110 Von Dadelszen P , Ornstein MP , Bull SB , Logan AG , Koren G ,
Magee LA . Fall in mean arterial pressure and fetal growth restriction
in pregnancy hypertension: a meta - analysis . Lancet 2000 ; 355 :
87 – 92 .
111 Adams JQ , Alexander AM . Alterations in cardiovascular physiology
during labor . Obstet Gynecol 1958 ; 12 : 542 .
112 Hendricks ECH , Quilligan EJ . Cardiac output during labor . Am J
Obstet Gynecol 1958 ; 76 : 969 .
113 Winner W , Romney SL . Cardiovascular responses to labor and
delivery .
Am J Obstet Gynecol 1966 ; 96 : 1004 .
Pregnancy-Induced Physiologic Alterations
51
159 Hertzberg BS , Carroll BA , Bowie JD , et al. Doppler US assessment
of maternal kidneys: analysis of intrarenal resistivity indexes in
normal pregnancy and physiologic pelvicaliectasis . Radiology 1993 ;
186 : 689 – 692 .
160 Fried A , Woodring JH , Thompson TJ . Hydronephrosis of preg-
nancy . J Ultrasound Med 1983 ; 2 : 255 – 259 .
161 Davison JM , Hytten FE . The effect of pregnancy on the renal han-
dling of glucose . Br J Obstet Gynaecol 1975 ; 82 : 374 – 381 .
162 Lindheimer MD , Barron WM . Renal function and volume homeo-
stasis . In: Gleicher N , Buttino L , Elkayam U , et al, eds. Principles and
Practice of Medical Therapy in Pregnancy , 3rd edn. Stanford, CT :
Appleton and Lange , 1998 : 1043 – 1052 .
163 Higby K , Suiter CR , Phelps JY , Siler - Khodr T , Langer O . Normal
values of urinary albumin and fetal protein excretions during preg-
nancy . Am J Obstet Gynecol 1994 ; 171 : 984 – 989 .
164 Barron WM , Lindheimer MD . Renal sodium and water handling in
pregnancy . Obstet Gynecol Annu 1984 ; 13 : 35 – 69 .
165 Davison JM , Vallotton MB , Lindheimer MD . Plasma osmolality and
urinary concentration and dilution during and after pregnancy . Br
J Obstet Gynaecol 1981 ; 88 : 472 – 479 .
166 Baer JL , Reis RA , Artens RA . Appendicitis in pregnancy with changes
in position and axis of the normal appendix in pregnancy . JAMA
1932 ; 98 : 1359 .
167 Van Thiel DH , Gavaler JS , Joshi SN , Sara RK , Stremple J . Heartburn
of pregnancy . Gastroenterology 1977 ; 72 : 666 – 668 .
168 Parry E , Shields R , Turnbull AC . Transit time in the small intestine
in pregnancy . J Obstet Gynaecol Br Commonw 1970 ; 77 :
900 – 901 .
169 Radberg G , Asztely M , Cantor P , Rehfeld JF , Jarnfeldt - Samsioe A ,
Svanvik J . Gastric and gall bladder emptying in relation to the secre-
tion of cholecystokinin after a meal in late pregnancy . Digestion
1989 ; 42 : 174 – 180 .
170 Vasicka A , Lin TJ , Bright RH . Peptic ulcer and pregnancy: review of
hormonal relationships and a report of one case of massive hemor-
rhage . Obstet Gynecol Surv 1957 ; 12 : 1 .
171 Waldum HL , Straume BK , Lundgren R . Serum group I pepsinogens
during pregnancy . Scand J Gastroenterol 1980 ; 15 : 61 – 64 .
172 Braverman DZ , Johnson ML , Kern F . Effects of pregnancy and con-
traceptive steroids on gallbladder function . N Engl J Med 1980 ; 302 :
262 – 264 .
173 Girling JC , Dow E , Smith JH . Liver function tests in preeclampsia:
importance of comparison with a reference range derived for normal
pregnancy . Br J Obstet Gynaecol 1997 ; 104 : 246 – 250 .
174 Pirani BBK , Campbell DM , MacGillivray I . Plasma volume in
normal fi rst pregnancy . J Obstet Gynaecol Br Commonw 1973 ; 80 :
884 – 887 .
175 Peck TM , Arias F . Hematologic changes associated with pregnancy .
Clin Obstet Gynecol 1979 ; 22 : 785 – 798 .
176 Jepson JH , Lowenstein L . Role of erythropoietin and placental lac-
togen in the control of erythropoiesis during pregnancy . Can J
Physiol Pharmacol 1968 ; 46 : 573 – 576 .
177 Scott DE , Pritchard JA . Iron defi ciency in healthy young college
women . JAMA 1967 ; 199 : 897 – 900 .
178 Pitkin R , Witte D . Platelet and leukocyte counts in pregnancy . JAMA
1979 ; 242 : 2696 – 2698 .
179 Sejeny SA , Eastham RD , Baker SR . Platelet counts during normal
pregnancy . J Clin Pathol 1975 ; 28 : 812 – 814 .
180 O ’ Brien JR . Platelet counts in normal pregnancy . J Clin Pathol 1976 ;
29 : 174 .
136 Weinberger SE , Weiss ST , Cohen WR , Weiss JW , Johnson TS .
Pregnancy and the lung: state of the art . Am Rev Respir Dis 1980 ;
121 : 559 – 581 .
137 Elkus R , Popovich J . Respiratory physiology in pregnancy . Clin Chest
Med 1992 ; 13 : 555 – 565 .
138 Gilroy RJ , Mangura BT , Lavietes MH . Rib cage and abdominal
volume displacements during breathing in pregnancy . Am Rev
Respir Dis 1988 ; 137 : 668 – 672 .
139 Macklem PT , Gross D , Grassino GA , Roussos C . Partitioning of
inspiratory pressure swings between diaphragm and intercostals/
accessory muscles . J Appl Physiol 1978 ; 44 : 200 – 208 .
140 Nava S , Zanotti E , Ambrosino N , Fracchia C , Scarabelli C , Rampulla
C . Evidence of acute diaphragmatic fatigue in a “ natural ” condition.
The diaphragm during labor . Am Rev Respir Dis 1992 ; 146 :
1226 – 1230 .
141 Milne JA , Howie AD , Pack AI . Dyspnoea during normal pregnancy .
Br J Obstet Gynaecol 1978 ; 85 : 260 – 264 .
142 Thomson JK , Cohen ME . Studies on the circulation in pregnancy.
II. Vital capacity observations in normal pregnant women . Surg
Gynecol Obstet 1938 ; 66 : 591 .
143 Cugell DW , Frank NR , Gaensler EA , Badger TL . Pulmonary function
in pregnancy. I. Serial observations in normal women . Am Rev
Tu ber c 1953 ; 67 : 598 .
144 Rubin A , Russo N , Goucher D . The effect of pregnancy upon pul-
monary function in normal women . Am J Obstet Gynecol 1956 ; 72 :
964 .
145 Gee JB , Packer BS , Millen JE , Robin ED . Pulmonary mechanics
during pregnancy . J Clin Invest 1967 ; 46 : 945 – 952 .
146 Baldwin GR , Moorthi DS , Whelton JA , MacDonnell KF . New lung
functions in pregnancy . Am J Obstet Gynecol 1977 ; 127 : 235 – 239 .
147 Crapo RO . Normal cardiopulmonary physiology during pregnancy .
Clin Obstet Gynecol 1996 ; 39 : 3 – 16 .
148 Alaily AB , Carrol KB . Pulmonary ventilation in pregnancy . Br J
Obstet Gynaecol 1978 ; 85 : 518 – 524 .
149 Norregard O , Shultz P , Ostergaard A , Dahl R . Lung function and
postural changes during pregnancy . Respir Med 1989 ; 83 : 467 .
150 Pernoll ML , Metcalfe J , Kovach PA , Wachtel R , Dunham MJ .
Ventilation during rest and exercise in pregnancy and postpartum .
Respir Physiol 1975 ; 25 : 295 – 310 .
151 Milne JA . The respiratory response to pregnancy . Postgrad Med J
1979 ; 55 : 318 – 324 .
152 Zwillich CW , Natalino MR , Sutton FD , Weil JV . Effects of proges-
terone on chemosensitivity in normal men . J Lab Clin Med 1978 ; 92 :
262 – 269 .
153 Bayliss DA , Millhorn DE . Central neural mechanisms of progester-
one action: application to the respiratory system . J Appl Physiol 1992 ;
73 : 393 – 404 .
154 Awe RJ , Nicotra MB , Newsom TD , et al. Arterial oxygenation and
alveolar – arterial gradients in term pregnancy . Obstet Gynecol 1979 ;
53 : 182 – 186 .
155 Ang CK , Tan TH , Walters WA , et al. Postural infl uence on maternal
capillary oxygen and carbon dioxide tension . BMJ 1969 ; 4 :
201 – 204 .
156 Cietak KA , Newton JR . Serial quantitative maternal nephrosonogra-
phy in pregnancy . Br J Radiol 1985 ; 58 : 405 – 414 .
157 Shulman A , Herlinger H . Urinary tract dilatation in pregnancy . Br
J Radiol 1975 ; 48 : 638 – 645 .
158 Dure - Smith P . Pregnancy dilatation of the urinary tract: the iliac
sign and its signifi cance .
Radiology 1970 ; 96 : 545 – 550 .
Chapter 4
52
200 Kovats S , Main EK , Librach C , Stubblebine M , Fisher SJ , DeMars R .
A class I antigen, HLA - G, expressed in human trophoblasts . Science
1990 ; 248 : 220 – 224 .
201 Bainbridge DR , Ellis SA , Sargent IL . Little evidence of HLA - G
mRNA polymorphism in Caucasian or Afro - Caribbean populations .
J Immunol 1999 ; 163 : 2023 – 2027 .
202 Allan DS , Colonna M , Lanier LL , et al. Tetrameric complexes of
human histocompatibility leukocyte antigen (HLA) - G bind to
peripheral blood myelomonocytic cells . J Exp Med 1999 ; 189 :
1149 – 1156 .
203 Starkey PM , Sargent IL , Redman CW . Cell populations in human
early pregnancy decidua: characterization and isolation of large
granular lymphocytes by fl ow cytometry . Immunology 1988 ; 65 :
129 – 134 .
204 King A , Burrows T , Verma S , Hiby S , Loke YW . Human uterine
lymphocytes . Hum Reprod Update 1998 ; 4 : 480 – 485 .
205 Deniz G , Christmas SE , Brew R , Johnson PM . Phenotypic and func-
tional cellular differences between human CD3 - decidual and
peripheral blood leukocytes . J Immunol 1994 ; 152 : 4255 – 4261 .
206 Drake PM , Gunn MD , Charo IF , et al. Human placental cytotropho-
blasts attract monocytes and CD56 (bright) natural killer cells via
the actions of monocyte infl ammatory protein 1 - alpha . J Exp Med
2001 ; 193 : 1199 – 1212 .
207 Roth I , Corry DB , Locksley RM , Abrams JS , Litton MJ , Fisher SJ .
Human placental cytotrophoblasts produce the immunosuppressive
cytokine interleukin 10 . J Exp Med 1996 ; 184 : 539 – 548 .
208 Pavia C , Siiteri PK , Perlman JD , Stites DP . Suppression of murine
allogeneic cell interactions by sex hormones . J Reprod Immunol
1979 ; 1 : 33 – 38 .
209 Xu C , Mao D , Holers VM , Palanca B , Cheng AM , Molina H . A criti-
cal role for murine complement regulator crry in fetomaternal toler-
ance . Science 2000 ; 287 : 498 – 501 .
210 Munn DH , Zhou M , Attwood JT , et al. Prevention of allogeneic fetal
rejection by tryptophan catabolism . Science 1998 ; 281 : 1191 – 1194 .
211 Kamimura S , Eguchi K , Yonezawa M , Sekiba K . Localization and
developmental change of indoleamine 2,3 - dioxygenase activity in
the human placenta . Acta Med Okayama 1991 ; 45 : 135 – 139 .
212 Schrocksnadel H , Baier - Bitterlich G , Dapunt O , Wachter H , Fuchs
D . Decreased plasma tryptophan in pregnancy . Obstet Gynecol 1996 ;
88 : 47 – 50 .
213 Baboonian C , Griffi ths P . Is pregnancy immunosuppressive?
Humoral immunity against viruses . Br J Obstet Gynaecol 1983 ; 90 :
1168 – 1175 .
214 Gitlin D , Kumate J , Morales C , Noriega C , Arevalo N . The turnover
of amniotic fl uid protein in the human conceptus . Am J Obstet
Gynecol 1972 ; 113 : 632 – 645 .
215 Cunningham FG , MacDonald PC , Gant NF , Leveno KJ , Gilstrap LC
III . The morphological and functional development of the fetus . In:
Cunningham FG , MacDonald PC , Gant NF , Leveno KJ , Gilstrap LC
III , eds. Williams ’ Obstetrics , 19th edn. Norwalk, CT : Appleton and
Lange , 1993 : 165 – 207 .
216 Gitlin D . Development and metabolism of the immune globulins .
In: Kagan BM , Stiehm ER , eds. Immunologic Incompetence . Chicago :
Year Book , 1971 .
181 Fenton V , Saunders K , Cavill I . The platelet count in pregnancy . J
Clin Pathol 1977 ; 30 : 68 – 69 .
182 Wallenburg HC , van Kessel PH . Platelet lifespan in normal preg-
nancy as determined by a nonradioisotopic technique . Br J Obstet
Gynaecol 1978 ; 85 : 33 – 36 .
183 Fay RA , Bromham DR , Brooks JA , et al. Platelets and uric acid in
the prediction of pre - eclampsia . Am J Obstet Gynecol 1985 ; 152 :
1038 – 1039 .
184 Rakoczi I , Tallian F , Bagdany S , Gati I . Platelet lifespan in normal
pregnancy and pre - eclampsia as determined by a non - radioisotope
technique . Thromb Res 1979 ; 15 : 553 – 556 .
185 Burrows RF , Kelton JG . Thrombocytopenia at delivery: a prospec-
tive survey of 6,715 deliveries . Am J Obstet Gynecol 1990 ; 162 :
731 – 734 .
186 Hellgren M . Hemostasis during pregnancy and puerperium .
Hemostasis 1996 ; 26 ( Suppl 4 ): 244 – 247 .
187 Davis GL . Hemostatic changes associated with normal and abnormal
pregnancies . Clin Lab Sci 2000 ; 13 : 223 – 228 .
188 Lindqvist P , Dahlback B , Marsal K . Thrombotic risk during
pregnancy: a population study . Obstet Gynecol 1999 ; 94 :
595 – 599 .
189 Gonzalez JG , Elizondo G , Saldivar D , Nanez H , Todd LE , Villarreal
JZ . Pituitary gland growth during normal pregnancy: an in vivo
study using magnetic resonance imaging . Am J Med 1988 ; 85 :
217 – 220 .
190 Kletzky OA , Rossman F , Bertolli SI , Platt LD , Mischel DR Jr .
Dynamics of human chorionic gonadotropin, prolactin, and growth
hormone in serum and amniotic fl uid throughout normal human
pregnancy . Am J Obstet Gynecol 1985 ; 151 : 878 – 884 .
191 Anderson JR . Prolactin in amniotic fl uid and maternal serum during
uncomplicated human pregnancy . Dan Med Bull 1982 ; 29 : 266 .
192 Ballabio M , Poshyachinda M , Ekins RP . Pregnancy - induced changes
in thyroid function: role of human chorionic gonadotropin as puta-
tive regulator of maternal thyroid . J Clin Endocrinol Metab 1991 ; 73 :
824 – 831 .
193 Nolten WE , Rueckert PA . Elevated free cortisol index in pregnancy:
possible regulatory mechanisms . Am J Obstet Gynecol 1981 ; 139 :
492 – 498 .
194 Watanabe M , Meeker CI , Gray MJ , Sims EA , Solomon S . Secretion
rate of aldosterone in normal pregnancy . J Clin Invest 1963 ; 42 :
1619 .
195 Phelps RL , Metzger BE , Freinkel N . Carbohydrate metabolism in
pregnancy. XVII. Diurnal profi les of plasma glucose, insulin, free
fatty acids, triglycerides, cholesterol, and individual amino acids in
late normal pregnancy . Am J Obstet Gynecol 1981 ; 140 : 730 – 736 .
196 Medawar PB . Some immunological and endocrinological problems
raised by the evolution of viviparity in vertebrates . Symp Soc Exper
Biol 1953 ; 7 : 320 .
197 Norwitz ER , Schust DJ , Fisher SJ . Implantation and the survival of
early pregnancy . N Engl J Med 2001 ; 345 : 1400 – 1408 .
198 Wilder R . Hormones, pregnancy, and autoimmune diseases . Ann NY
Acad Sci 1998 ; 840 : 45 – 50 .
199 Redman CW . HLA - DR antigen on human trophoblast: a review . Am
J Reprod Immunol 1983 ; 3 : 175 – 177 .
53
Critical Care Obstetrics, 5th edition. Edited by M. Belfort, G. Saade,
M. Foley, J. Phelan and G. Dildy. © 2010 Blackwell Publishing Ltd.
5
Maternal – Fetal Blood Gas Physiology
Renee A. Bobrowski
Department of Obstetrics and Gynecology, Saint Alphonsus Regional Medical Center, Boise, ID, USA
Introduction
Abnormalities in acid – base and respiratory homeostasis are
common among patients requiring intensive medical support,
but many clinicians fi nd the physiology cumbersome. As a result
of both their illness and our therapeutic interventions, critically
ill patients frequently require assessment of metabolic and respi-
ratory status. An understanding and clinical application of basic
physiologic principles is therefore essential to the care of these
patients. It is also important that clinicians involved in the care
of critically ill gravidas be familiar with the metabolic and respira-
tory changes of pregnancy as well as their effect on arterial blood
gas interpretation.
The arterial blood gas provides information regarding acid –
base balance, oxygenation, and ventilation. A blood gas should
be considered when a patient has signifi cant respiratory symp-
toms or experiences oxygen desaturation, or as a baseline in the
evaluation of pre - existing cardiopulmonary disease. In this
chapter we focus on fundamental physiology, analytic consider-
ations, effective interpretation of an arterial blood gas, and acid –
base disturbances.
Essential physiology
Acid – base homeostasis
Normal acid – base balance depends on production, buffering, and
excretion of acid. The delicate balance that is crucial for survival
is maintained by buffer systems, the lungs and kidneys. Each day,
approximately 15 000 mEq of volatile acids (e.g. carbonic acid)
are produced by the metabolism of carbohydrates and fats. These
acids are transported to and removed via the lungs as carbon
dioxide (CO
2
) gas. Breakdown of proteins and other substances
results in 1 – 1.5 mEq/kg/day of non - volatile or fi xed acids (pre-
dominantly phosphoric and sulfuric acids), which are removed
by the kidneys.
Buffers are substances that can absorb or donate protons and
thereby resist or reduce changes in H
+
ion concentration. Acids
produced by cellular metabolism move out of cells and into the
extracellular space where buffers absorb the protons. These
protons are then transported to the kidney and excreted in urine.
The intra - and extracellular buffer systems that maintain homeo-
stasis in the human include the carbonic acid – bicarbonate system,
plasma proteins, hemoglobin, and bone.
The carbonic acid – bicarbonate system is the principal extracel-
lular buffer. Its effectiveness is predominantly due to the ability
of the lungs to excrete carbon dioxide. In this system, bicarbon-
ate, carbonic acid and carbon dioxide are related by the
equation:
CO H O CO H CO
Gaseous
phase
Dissolved
Carbonic
acid
22 223
↔+↔ ↔
Carbonicc
anhydrase
Lung Kidney
HHCO
Bicarbonate
+−
+
↓↓
3
Carbon dioxide is produced as an end - product of aerobic
metabolism and physically dissolves in body fl uids. A portion of
dissolved CO
2
reacts with water to form carbonic acid, which
dissociates into bicarbonate and hydrogen ions. The concentra-
tion of carbonic acid is normally very low relative to that of dis-
solved CO
2
and HCO
3
−
. If the H
+
ion concentration increases,
however, the acid load is buffered by bicarbonate, and additional
carbonic acid is formed. The equilibrium of the equation is then
driven to the left, and excess acid can be excreted as carbon
dioxide gas.
The Henderson – Hasselbalch equation expresses the relation-
ship between the reactants of the carbonic acid – bicarbonate
system under conditions of equilibrium:
Chapter 5
54
Acid – base disturbances
Disturbances in acid – base balance are classifi ed according to
whether the underlying process results in an abnormal rise or fall
in arterial pH. The suffi x - osis refers to a pathologic process that
causes a gain or loss of acid or base. Thus, acidosis describes any
condition that leads to a fall in blood pH if the process continues
uncorrected. Conversely, alkalosis characterizes any process that
will cause a rise in pH if unopposed. The terms acidosis and
alkalosis do not require the pH to be abnormal. The suffi x - emia
refers to the state of the blood, and acidemia and alkalemia are
appropriately used when blood pH is abnormally low ( < 7.36) or
high ( > 7.44), respectively [1] .
In addition, alterations in acid – base homeostasis are classifi ed
based upon whether the underlying mechanism is metabolic or
respiratory. If the primary abnormality is a net gain or loss of
CO
2
, this is respiratory acidosis or alkalosis, respectively.
Alternatively, a net gain or loss of bicarbonate results in metabolic
alkalosis or acidosis, respectively. If only one primary process is
present, then the acid – base disturbance is simple, and bicarbon-
ate and PCO
2
always deviate in the same direction. A mixed
disturbance develops when two or more primary processes are
present, and the changes in HCO
3
−
and PCO
2
are in opposite
directions.
The compensatory response attempts to normalize the
HCO PCO
32
−
[]
ratio and maintain pH. Renal and pulmonary
function must be adequate for these responses to be effective and
adequate time must be allowed for the complete response. The
compensatory response for a primary respiratory abnormality is
via the bicarbonate system or acid excretion by the kidney and
requires several days for a complete response. Compensation for
a metabolic aberration is through ventilation changes and occurs
quite rapidly.
Compensatory responses cannot, however, completely return
the pH to normal, with the exception of chronic respiratory alka-
losis. The more severe the primary disorder, the more diffi cult it
is for the pH to return to normal. When the pH is normal but
PCO
2
and HCO
3
−
are abnormal or the expected compensatory
responses do not occur, then a second primary disorder exists.
The four types of acid – base abnormalities and the compensatory
response associated with each are listed in Table 5.1 .
Respiratory and acid – base changes during pregnancy
A variety of physiologic changes occur during pregnancy, affect-
ing maternal respiratory function and gas exchange. As a result,
an arterial blood gas obtained during pregnancy must be inter-
preted with an understanding of these alterations. Since these
changes begin early in gestation and persist into the puerperium,
they must be taken into consideration regardless of the stage of
pregnancy [2] . In addition, the altitude at which a patient lives
will affect arterial blood gas values, and normative data for each
individual population should be established [3] .
Minute ventilation increases by 30 – 50% during pregnancy
[4,5] and alveolar and arterial PCO
2
decrease. Normal maternal
arterial PCO
2
levels range from 26 to 32 mmHg [6 – 8] . Since the
pH pK
HCO
P
metabolic
respiratory
CO
=+
[]
()
=
−
log
3
2
s
As the equation demonstrates, the ratio of [
HCO
3
−
] to PCO
2
determines pH (H
+
ion concentration) and not individual or
absolute concentrations. This ratio is infl uenced to a large extent
by the function of the kidneys ( HCO
3
−
) and lungs (PCO
2
). The
constant s represents the solubility coeffi cient of CO
2
gas in
plasma and relates PCO
2
to the concentration of dissolved CO
2
and HCO
3
−
. The value of s is 0.03 mmol/L/mmHg at 37 ° C. The
dissociation constant (pK) of blood carbonic acid is equivalent
to 6.1 at 37 ° C.
The lungs are the second component of acid – base regulation.
Alveolar ventilation controls PCO
2
independent of bicarbonate
excretion. When the bicarbonate concentration is altered, respira-
tory changes attempt to return the ratio of
HCO PCO
32
−
[]
toward
the normal 20/1. Thus, in the presence of metabolic
acidosis (decreased HCO
3
−
), ventilation increases, PCO
2
is
lowered, and the ratio normalizes. In metabolic alkalosis, the
opposite occurs as PCO
2
rises in response to the primary
increase in HCO
3
−
.
The kidney is the fi nal element of acid – base regulation. The
main functions of the renal system are excretion of fi xed acids
and regulation of plasma bicarbonate levels. Carbonic acid that
has been transported to the kidney dissociates into H
+
and HCO
3
−
in renal tubular cells. Each H
+
ion secreted into the tubular lumen
is exchanged for sodium, and HCO
3
−
is passively reabsorbed into
the blood. Essentially all bicarbonate must be reabsorbed by the
kidney before acid can be excreted, because the loss of one HCO
3
−
is equivalent to the addition of one H
+
ion. Mono - and diphasic
phosphates and ammonia are urinary buffers that combine with
H
+
ions in the renal tubules and are excreted. Under normal
conditions, the amount of H
+
excreted approximates the amount
of non - volatile acids produced.
The buffer systems, the lungs and kidneys interact to maintain
very tight control of the body ’ s acid – base balance. The sequence
of responses to a H
+
ion load and the time required for each may
be summarized:
Extracellular buffering
by HCO
immediate
Respiratory buf
→
()
−
3
ffering
Ps
minutes to hours
Renal excretion
of H s
hour
CO
→
↓
()
↑
+
2
ss to days
In contrast, when P changes
Intracellular b
CO
()
2
:
uuffering
minutes
Renal excretion of H
hours to days
→
()
()
+
Unlike the response to an acid load, no extracellular buffering
occurs with a change in PCO
2
. Since HCO
3
−
is not an effective
buffer against H
2
CO
3
, the only protection against respiratory aci-
dosis or alkalosis is intracellular buffering (i.e. by hemoglobin)
and renal H
+
ion excretion.
Maternal–Fetal Blood Gas Physiology
55
Oxygen delivery and consumption
All tissues require oxygen for the combustion of organic com-
pounds to fuel cellular metabolism. The cardiopulmonary system
serves to deliver a continuous supply of oxygen and other essen-
tial substrates to tissues. Oxygen delivery is dependent on oxy-
genation of blood in the lungs, oxygen - carrying capacity of the
blood and cardiac output. Under normal conditions, oxygen
delivery (DO
2
) exceeds oxygen consumption (VO
2
) by about
75% [17] . The amount of oxygen delivered is determined by the
cardiac output (CO, L/min) times the arterial oxygen content
(CaO
2
mL/O
2
/dL):
DO CO C O dL L
a22
10=× ×
Arterial oxygen content (CaO
2
) is determined by the amount
of oxygen that is bound to hemoglobin (S
a
O
2
) and by the amount
of oxygen that is dissolved in plasma (P
a
O
2
× 0.003):
CO Hb SO PO
aaa222
1 39 0 003=××
()
+×
()
It is clear from this formula that the amount of oxygen dis-
solved in plasma is negligible and, therefore, that arterial oxygen
is dependent largely on hemoglobin concentration and arterial
oxygen saturation. Oxygen delivery can be impaired by condi-
tions that affect either cardiac output (fl ow), arterial oxygen
content, or both (Table 5.3 ). Anemia leads to low arterial oxygen
content because of a lack of hemoglobin binding sites for oxygen
[18] . The patient with hypoxemic respiratory failure will not have
suffi cient oxygen available to saturate the hemoglobin molecule.
Furthermore, it has been demonstrated that desaturated hemo-
globin is altered structurally in such a fashion as to have a dimin-
ished affi nity for oxygen [19] . It must be kept in mind that the
amount of oxygen actually available to tissues also is affected by
the affi nity of the hemoglobin molecule for oxygen. Thus, the
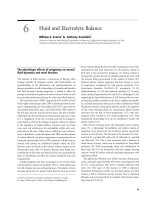
oxyhemoglobin dissociation curve (Figure 5.1 ) and those condi-
tions that infl uence the binding of oxygen either negatively or
positively must be considered when attempts are made to maxi-
mize oxygen delivery [20] . An increase in the plasma pH level or
a decrease in temperature or 2,3 diphosphoglycerate (2,3 - DPG)
will increase hemoglobin affi nity for oxygen, shifting the curve to
the left and resulting in diminished tissue oxygenation. If the
fetus depends upon the maternal respiratory system for carbon
dioxide excretion, the decreased maternal PCO
2
creates a gradient
that allows the fetus to offl oad carbon dioxide. Thus, fetal PCO
2
is approximately 10 mmHg higher than the maternal level when
uteroplacental perfusion is normal.
Maternal alveolar oxygen tension increases as alveolar carbon
dioxide tension decreases, and arterial PO
2
levels rise as high as
106 mmHg during the fi rst trimester [7,9] . Airway closing pres-
sures increase with advancing gestation, causing a slight fall in
arterial PO
2
in the third trimester (101 – 104 mmHg) [7,9,10] . The
arterial PO
2
level, however, is dependent upon the altitude at
which the patient resides. The mean arterial PO
2
for gravidas at
sea level ranges from 95 to 102 mmHg [9,11] , while the average
values reported for those living at 1388 m are 87 mmHg [12] and
61 mmHg at 4200 m [13] . As with carbon dioxide transfer, the
fetus depends upon the oxygen gradient for continued diffusion
across the placenta. Maternal arterial oxygen content, uterine
artery perfusion and maternal hematocrit contribute to fetal oxy-
genation and compromise of any of these factors can cause fetal
hypoxemia and eventually acidemia [14] .
Despite the increased ventilation, maternal arterial pH remains
essentially unchanged during pregnancy [7,15] . A slightly higher
pH value has been noted in women living at a moderate altitude,
with a reported mean of 7.46 at 1388 m above sea level [3] .
Bicarbonate excretion by the kidney is increased during normal
pregnancy to compensate for the lowered PCO
2
, and serum bicar-
bonate levels are normally 18 – 21 mEq/L [2,7,8,16] . Thus, the
metabolic state of pregnancy is a chronic respiratory alkalosis
with a compensatory metabolic acidosis (Table 5.2 ).
Table 5.1 Summary of acid – base disorders: the primary disturbance, compensatory response, and expected degree of compensation.
Primary disturbance Compensatory response Expected degree of compensation
Metabolic acidosis
Decreased
HCO
3
−
Decreased
P
CO
2
P
a
CO
2
= [1.5 × (serum bicarbonate)] + 8
P
a
CO
2
= last two digits of pH
Metabolic alkalosis
Increased
HCO
3
−
Increased
P
CO
2
P
a
CO
2
= [0.7 × (serum bicarbonate)] + 20
Respiratory acidosis Increased
P
CO
2
Increased
HCO
3
−
Acute: pH ∆ = 0.08 × (measured
P
a
CO
2
− 40)/10
Chronic: pH ∆ = 0.03 × (measured
P
a
CO
2
− 40)/10
Respiratory alkalosis Decreased
P
CO
2
Decreased
HCO
3
−
Acute: pH ∆ = 0.08 × (40 − measured
P
a
CO
2
)/10
Chronic: pH ∆ = 0.03 × (40 − measured
P
a
CO
2
)/10
Table 5.2 Arterial blood gas values during pregnancy at sea level.
Normative data should be established for individual populations residing
at high altitude.
Parameter Normal range
pH 7.40 – 7.46
P
CO
2
26 – 32 mmHg
P
O
2
101 – 106 mmHg
HCO
3
−
18 – 21 mEq/L
Chapter 5
56
to some areas, with relative hypoperfusion of other areas, limiting
optimal systemic utilization of oxygen [21] .
The patient with diminished cardiac output secondary to
hypovolemia or pump failure is unable to distribute oxygenated
blood to tissues. Therapy directed at increasing volume with
normal saline, or with blood if the hemoglobin level is less than
10 g/dL, increases oxygen delivery in the hypovolemic patient.
The patient with pump failure may benefi t from inotropic
support and afterload reduction in addition to supplementation
of intravscular volume.
Relationship of oxygen delivery to consumption
Oxygen consumption (VO
2
) is the product of the arteriovenous
oxygen content difference (C
(a – v)
O
2
) and cardiac output. Under
normal conditions, oxygen consumption is a direct function of
the metabolic rate [22] .
VO C O CO dL L
av22
10=××
−
()
The oxygen extraction ratio (OER) is the fraction of delivered
oxygen that is actually consumed:
OER VO DO=
22
The normal OER is about 0.25. A rise in the OER is a compen-
satory mechanism employed when oxygen delivery is inadequate
for the level of metabolic activity. An OER of less than 0.25 sug-
gests fl ow maldistribution, peripheral diffusion defects, or frac-
tional shunting [22] . As the supply of oxygen is reduced, the
fraction extracted from blood increases and oxygen consumption
is maintained. If a severe reduction in oxygen delivery occurs, the
limits of oxygen extraction are reached, tissues are unable to
sustain aerobic energy production, and consumption decreases.
The level of oxygen delivery at which oxygen consumption begins
to decrease has been termed the “ critical DO
2
” [23] . At the critical
DO
2
, tissues begin to use anerobic glycolysis, with resultant
plasma pH level or temperature falls, or if 2,3 - DPG increases,
hemoglobin affi nity for oxygen will decrease and more oxygen
will be available to tissues [20] .
In certain clinical conditions, such as septic shock and adult
respiratory distress syndrome, there is maldistribution of fl ow
relative to oxygen demand, leading to diminished delivery and
loss of vascular autoregulation, producing regional and microcir-
culatory imbalances in blood fl ow [21] . This mismatching of
blood fl ow with metabolic demand causes excessive blood fl ow
10
10
20
30
40
50
60
70
80
90
100
0
20 30 40 50 60 70 80 90 100
P
50
O
2
tension (mmHg)
pH
pH
DPG
Temp
DPG
Temp
Percent oxyhemoglobin
Figure 5.1 The oxygen binding curve for human hemoglobin A under
physiologic conditions (middle curve). The affi nity is shifted by changes in pH,
diphosphoglycerate (DPG) concentration, and temperature, as indicated.
P
50
represents the oxygen tension at half saturation. (Reproduced by permission from
Bunn HF, Forget BG. Hemoglobin: molecular, genetic, and clinical aspects.
Philadelphia: WB Saunders, 1986.)
Table 5.3 Commonly used formulas for assessment of oxygenation.
Formula Normal value
Est. alveolar oxygen tension
P
A
O
2
= 145 −
P
a
CO
2
Pulmonary capillary oxygen content
C
c ′
O
2
= [Hb](1.39) + (
P
A
O
2
)(0.003)
Arterial oxygen content
C
a
O
2
= (1.39 × H b ×
S
a
O
2
) + (
P
a
O
2
× 0.003)
18 – 21 mL/dL
Mixed venous oxygen content
C
O
2
= (1.39 × H b ×
S
O
2
) + (
P
O
2
)(0.003)
Oxygen delivery
D
O
2
=
C
a
O
2
×
Q
T
× 10
640 – 1,200 mLO
2
/min
Oxygen consumption
V
O
2
=
Q
T
(
C
a
O
2
−
C
v
O
2
) = 13.8 (Hb) (Q
T
) (
S
a
O
2
−
S
v
O
2
)/100
180 – 280 mLO
2
/min
Shunt equation
Q
sp
=
C
c ′ O
2
−
C
a
O
2
3 – 8%
Q
t
C
c ′ O
2
−
C
O
2
Estimated shunt
Est. Qsp/Qt =
CC′O
2
– CaO
2
[C
C′O
2
– CaO
2
] + [CaO
2
– CvO
2
]
P
a
CO
2
, partial pressure of arterial carbon dioxide;
P
a
O
2
, partial pressure of arterial oxygen;
P
O
2
, partial pressure of venous oxygen; Hb, hemoglobin;
S
a
O
2
, arterial oxygen
saturation;
S
O
2
, venous oxygen saturation;
Q
T
, cardiac output.
Maternal–Fetal Blood Gas Physiology
57
catheter [29] . An adequate volume of maintenance fl uid or fl ush
solution must be withdrawn from the catheter and discarded
before obtaining the sample for analysis. But the diffi culty is
estimating the appropriate amount to withdraw. Although a 2.5 -
mL discard volume has been suggested, it has also been recom-
mended that each intensive care unit establish its own policy
based upon individual catheter and connection systems [1,30,31] .
Air bubbles in the collection syringe cause time - dependent
changes in the arterial blood gas. Air trapped as froth accelerates
these changes because of the increased surface area [32] . The
degree of change in PO
2
depends upon the initial PO
2
of the
sample. Since an air bubble has a PO
2
of 150 mmHg (room air),
the bubble will cause a falsely elevated PO
2
if the sample PO
2
is
< 150 mmHg. The opposite occurs if the sample has an initial
PO
2
> 150 mmHg. [1,33] . Oxygen saturation is most signifi cantly
affected when the sample PO
2
is < 60 mmHg since saturation
changes rapidly with changes in PO
2
, as predicted by the oxyhe-
moglobin dissociation curve. PCO
2
in the sample decreases
within several minutes of exposure to ambient air [32,34] .
When a blood sample remains at room temperature following
collection, PO
2
and pH may decrease while PCO
2
increases.
Specimens analyzed within 10 – 20 minutes of collection give accu-
rate results even when transported at room temperature [35,36] .
In most clinical settings, however, the time between sampling and
laboratory analysis of the specimen exceeds this limit. Therefore,
the syringe should be placed into an ice bath immediately after
sample collection. The combination of ice and water provides
better cooling of the syringe than ice alone, and a sample may be
stored for up to 1 hour without adversely affecting blood gas
results [34] .
Several additional factors can infl uence blood gas results.
Insuffi cient time between an adjustment in fractional inspired
oxygen or mechanical ventilator settings and blood gas analysis
may not accurately refl ect the change. Equilibration is quite rapid,
however, and has been reported to occur as soon as 10 minutes
after changing ventilator settings of postoperative cardiac patients
[37] . General anesthesia with halothane will falsely elevate PO
2
determination as it mimics oxygen during sample analysis [38 –
41] . Finally, severe leukocytosis causes a false lowering of PO
2
due
to consumption by the cells in the collection syringe [42] . The
effect of the white blood cells may be minimized, but not neces-
sarily eliminated, by cooling the sample immediately after it is
obtained.
The blood gas analyzer
The blood gas analyzer is designed to simultaneously measure the
pH, PO
2
, and PCO
2
of blood. An aliquot of heparinized blood is
injected into a chamber containing one reference and three mea-
suring electrodes. Each measuring electrode is connected to the
reference electrode by a Ag/AgCl wire. The electrodes and injected
sample are kept at a constant 37 ° C by a warm water bath or heat
exchanger. The accuracy of the measurements depends upon
routine calibration of equipment, proper sample collection, and
constant electrode temperature.
lactate production and metabolic acidosis [23] . If this oxygen
deprivation continues, irreversible tissue damage and death
ensue.
Oxygen delivery and consumption in pregnancy
The physiologic anemia of pregnancy results in a reduction in the
hemoglobin concentration and arterial oxygen content. Oxygen
delivery is maintained at or above normal despite this because
cardiac output increases 50%. It is important to remember, there-
fore, that the pregnant woman is more dependent on cardiac
output for maintenance of oxygen delivery than the non - preg-
nant patient [24] . Oxygen consumption increases steadily
throughout pregnancy and is greatest at term, reaching an average
of 331 mL/min at rest and 1167 mL/min with exercise [10] .
During labor, oxygen consumption increases by 40 – 60%, and
cardiac output increases by about 22% [25,26] . Because oxygen
delivery normally far exceeds consumption, the normal pregnant
patient usually is able to maintain adequate delivery of oxygen to
herself and her fetus, even during labor. When a pregnant
patient ’ s oxygen delivery decreases, however, she can very quickly
reach the critical DO
2
, especially during labor, compromising
both herself and her fetus. The obstetrician, therefore, must make
every effort to optimize oxygen delivery before allowing labor to
begin in the compromised patient.
Blood gas analysis
The accuracy of a blood gas determination relies upon many
factors, including blood collection techniques, specimen trans-
port, and laboratory equipment. Up to 16% of specimens may be
improperly handled, diminishing diagnostic utility in a number
of cases [27] . Factors that can infl uence blood gas results include
excessive heparin in the collection syringe, catheter dead space,
air bubbles in the blood sample, time delays to laboratory analysis
as well as other less common causes. This section highlights con-
siderations for obtaining a blood sample and potential sources of
error, and briefl y describes laboratory methods.
Sample collection
The collection syringe typically contains heparin to prevent clot-
ting of the specimen. Excessive heparin in the syringe before
blood collection, however, can signifi cantly decrease the PCO
2
and bicarbonate of the sample. The spurious PCO
2
level results
in a falsely lowered bicarbonate concentration when calculated
using the Henderson – Hasselbalch equation. Although sodium
heparin is an acid, pH is minimally affected because whole blood
is an adequate buffer. Expelling all heparin except that in the dead
space of the syringe and needle will ensure adequate dilution by
obtaining a minimum of 3 mL of blood and reduce or avoid
anticoagulant - related errors [28] .
In the intensive care setting, an arterial catheter is often placed
when frequent blood sampling is anticipated. Dilutional errors
occur when a blood sample is contaminated with fl uids in the
Chapter 5
58
Pulse oximetry is ideal for non - invasive arterial oxygen satura-
tion monitoring near the steep portion of the oxyhemoglobin
dissociation curve, namely at a P
a
O
2
less than or equal to 70 mmHg
[44] . P
a
O
2
levels greater than or equal to 80 mmHg result in very
small changes in oxygen saturation, namely 97 – 99%. Large
changes in the P
a
O
2
from 90 mmHg to 60 mmHg can occur
without signifi cant change in arterial oxygen saturation. This
technique, therefore, is useful as a continuous monitor of the
adequacy of blood oxygenation and not as a method to quantitate
the level of impaired gas exchange [45] .
Poor tissue perfusion, hyperbilirubinemia, and severe anemia
may cause inaccurate oximetry readings [44] . Carbon monoxide
poisoning leads to an overestimation of the P
a
O
2
. When methe-
moglobin levels exceed 5%, the pulse oximeter cannot reliably
predict oxygen saturation. Methylene blue, the treatment for
methemoglobinemia, will also lead to inaccurate oximetry read-
ings. Normal values for maternal pulse oximetry readings (S
p
O
2
)
are dependent upon gestational age, position, and altitude of
residence [46 – 48] .
Mixed venous oxygenation
The mixed venous oxygen tension (P
V
O
2
) and mixed venous
oxygen saturation (S
V
O
2
) are parameters of tissue oxygenation
[22] . P
V
O
2
is 40 mmHg with a saturation of 73%. Saturations less
than 60% are abnormally low. These parameters can be measured
directly by obtaining a blood sample from the distal port of the
pulmonary artery catheter. The S
V
O
2
also can be measured con-
tinuously with a fi beroptic pulmonary artery catheter. Mixed
venous oxygenation is a reliable parameter in the patient with
hypoxemia or low cardiac output, but fi ndings must be inter-
preted with caution. When the S
V
O
2
is low, oxygen delivery can
be assumed to be low. However, normal or high does not guar-
antee that tissues are well oxygenated. In conditions such as septic
shock and adult respiratory distress syndrome, the maldistribu-
tion of systemic fl ow may lead to abnormally high S
V
O
2
in the
face of severe tissue hypoxia [21] . The oxyhemoglobin dissocia-
tion curve must be considered when interpreting the S
V
O
2
as an
indicator of tissue oxygenation [19] . Conditions that result in a
left shift of the curve cause the venous oxygen saturation to be
normal or high, even when the mixed venous oxygen content is
low. The S
V
O
2
is useful for monitoring trends in a particular
patient, because a signifi cant decrease will occur when oxygen
delivery has decreased secondary to hypoxemia or a fall in cardiac
output.
Blood gas interpretation
The processes leading to acid – base disturbances are well described,
and blood gas analysis may facilitate identifi cation of the cause of
a serious illness. Since many critically ill patients have metabolic
and respiratory derangements, correct interpretation of a blood
gas is fundamental to their care. Misinterpretation, however, can
result in treatment delays and inappropriate therapy. Several
Blood pH and PCO
2
are potentiometric determinations, with
the potential difference between each electrode and the reference
electrode quantitated. The pH electrode detects hydrogen ions,
and the electrical potential developed by the electrode varies with
the H
+
ion activity of the sample. The potential difference between
the pH and reference electrode is measured by a voltmeter and
converted to the pH. The PCO
2
electrode is actually a modifi ed
pH electrode. A glass electrode is surrounded with a weak bicar-
bonate solution and enclosed in a silicone membrane. Carbon
dioxide in the sample diffuses through this membrane which is
permeable to CO
2
but not water and H
+
ions. As CO
2
diffuses
through the membrane, the pH of the bicarbonate solution
changes. Thus, the pH measured by the electrode is related to
CO
2
tension.
The measurement of PO
2
is amperometric, as the current gen-
erated between an anode and cathode estimates the partial pres-
sure of oxygen. The PO
2
electrode surrounds a membrane
permeable to oxygen but not other blood constituents. The elec-
trode consists of an anode and a cathode, and constant voltage is
maintained between them. An electrolytic process that occurs
in the presence of oxygen produces current, and the magnitude
of the current is proportional to the partial pressure of oxygen in
the sample. As oxygen tension increases, the electrical current
generated between the anode and cathode increases.
Bicarbonate concentration as reported on a blood gas result is
not directly measured in the blood gas laboratory. Once pH and
PCO
2
are determined, bicarbonate concentration is calculated
using the Henderson – Hasselbalch equation or determined from
a nomogram. In contrast, the total serum CO
2
(tCO
2
) content is
measured by automated methods and reported with routine
serum electrolyte measurements.
Oxygen saturation (SO
2
) is the ratio of oxygenated hemoglobin
to total hemoglobin. It can be plotted graphically once PO
2
is
determined, calculated using an equation that estimates the oxy-
hemoglobin dissociation curve, or determined spectrophoto-
metrically by a co - oximeter. The latter is the most accurate
method since saturation is determined by a direct reading.
Pulse oximetry
The oximetry system determines arterial oxygen saturation by
measuring the absorption of selected wavelengths of light in pul-
satile blood fl ow [43] . Oxyhemoglobin absorbs much less red and
slightly more infrared light than reduced hemoglobin. Oxygen
saturation is therefore the ratio of red to infrared absorption.
Red and infrared light from light - emitting diodes are projected
across a pulsatile tissue bed and analyzed by a photodetector. The
absorption of each wavelength of light varies cyclically with pulse.
The patient ’ s heart rate, therefore, is also determined. When
assessing the accuracy of the arterial saturation measured by the
pulse oximeter, correlation of the oximeter determined heart rate
and the patient ’ s actual pulse rate indicates proper electrode
placement. The oximetry probe is usually placed on a nail bed or
ear lobe. Under ideal circumstances, most oximeters measure
saturation (S
p
O
2
) to within 2% of S
a
O
2
[43] .