Critical Care Obstetrics part 8 pot
Bạn đang xem bản rút gọn của tài liệu. Xem và tải ngay bản đầy đủ của tài liệu tại đây (272.82 KB, 10 trang )
Maternal–Fetal Blood Gas Physiology
59
quantitative assessment of the expected compensatory changes
(Table 5.1 ).
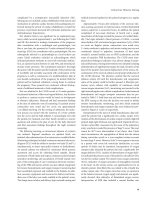
A systematic approach to an acid – base abnormality
Several different approaches for blood gas interpretation have
been devised [53 – 55] . A six - step approach modifi ed from Narins
and Emmitt provides a simple and reliable method to analyze a
blood gas, particularly when a complicated mixed disorder is
present [33,56,57] . This method, adjusted for pregnancy, is as
follows (Figure 5.3 ).
1 Is the patient acidemic or alkalemic? If the arterial blood pH
is < 7.36, the patient is acidemic, while a pH > 7.44 defi nes
alkalemia.
2 Is the primary disturbance respiratory or metabolic? The primary
alteration associated with each of the four primary disorders is
shown in Table 5.1 .
3 If a respiratory disturbance is present, is it acute or chronic? The
equations listed in Table 5.1 are used to determine the acuteness
of the disturbance. The expected change in the pH is calculated
and the measured pH is compared to the pH that would be
expected based on the patient ’ s PCO
2
.
4 If a metabolic acidosis is present, is the anion gap increased?
Metabolic acidosis is classifi ed according to the presence or
absence of an anion gap.
methods of acid – base interpretation have been devised, including
graphic nomograms and step - by - step analysis. Each method is
detailed in this section to aid in rapid and correct diagnosis of
disturbances in acid – base balance.
Blood gas results are not a substitute for clinical evaluation of
a patient, and laboratory values do not necessarily correlate with
the degree of clinical compromise. A typical example is the patient
with an acute exacerbation of asthma who experiences severe
dyspnea and respiratory compromise before developing hyper-
capnea and hypoxemia. Thus, a blood gas is an adjunct to clinical
judgment, and decision - making should not be based on a single
test.
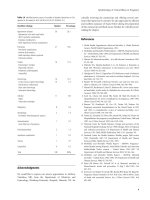
Graphic nomogram
Nomograms are a graphic display of an equation and have been
designed to facilitate identifi cation of simple acid – base distur-
bances [49 – 52] . Figure 5.2 is an example of a nomogram with
arterial blood pH represented on the x - axis, HCO
3
−
concentration
on the y - axis, and arterial PCO
2
on the regression lines.
Nomograms are accurate for simple acid – base disturbances,
and a single disorder can be identifi ed by plotting measured
blood gas values. When blood gas values fall between labelled
areas, a mixed disorder is present and the nomogram does not
apply. These complex disorders must then be characterized by
100 90 80 70 60 50 40 30 20
60
56
52
48
44
40
36
32
28
24
20
16
12
8
4
0
7.0 7.1 7.2 7.3 7.4 7.5 7.6 7.7 7.8
CHRONIC
RESPIRATORY
ACIDOSIS
METABOLIC
ALKALOSIS
ACUTE
RESPIRATORY
ACIDOSIS
NORMAL
ACUTE
RESPIRATORY
ALKALOSIS
CHRONIC
RESP.
ALKALOSIS
METABOLIC
ACIDOSIS
P
CO
2
(mmHg)
10
15
20
25
30
35
405060708090100120
110
Arterial blood pH
Arterial plasma [HCO
3
] (mmol/L)
–
Figure 5.2 Nomogram for interpretation of simple
acid – base disorders. (Reproduced by permission
from Cogan MJ. In: Brenner BM, Rector FC Jr, eds.
The Kidney. Philadelphia: WB Saunders, 1986: 473.)
Chapter 5
60
by a change in maternal position [3] . Abnormal gas exchange,
inadequate ventilation or both can lead to a fall in P
a
O
2
.
Hypoxemia is defi ned as a P
a
O
2
below 60 mmHg or a saturation
less than 90%. At this level, the oxygen content of blood is near
its maximum for a given hemoglobin concentration and any
additional increase in arterial oxygen tension will increase oxygen
content only a small amount.
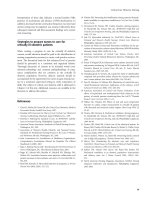
The amount of oxygen combined with hemoglobin is related
to the P
a
O
2
by the oxyhemoglobin dissociation curve and infl u-
enced by a variety of factors (Figure 5.4 ). The shape of the oxy-
hemoglobin dissociation curve allows P
a
O
2
to decrease faster than
oxygen saturation until the P
a
O
2
is approximately 60 mmHg. A
left shift of the curve increases hemoglobin ’ s affi nity for oxygen
and oxygen content, but decreases release of O
2
in peripheral
tissues. The fetal or neonatal oxyhemoglobin dissociation curve
is shifted to the left as a result of fetal hemoglobin and lower
levels of 2,3 - DPG. (Figure 5.4 ) The increased affi nity of hemo-
globin for oxygen allows the fetus to extract maximal oxygen
from maternal blood. A shift to the right has the opposite effect,
with decreased oxygen affi nity and content but increased release
in the periphery.
5 If a metabolic disturbance is present, is the respiratory
compensation adequate? The expected PCO
2
for a given degree
of metabolic acidosis can be predicted by Winter ’ s formula
(Table 5.1 ), since the relationship between PCO
2
and HCO
3
−
is linear. Predicting respiratory compensation for metabolic
alkalosis, however, is not nearly as consistent as with
acidosis.
6 If the patient has an anion gap metabolic acidosis, are additional
metabolic disturbances present? The excess anion gap represents
bicarbonate concentration before the anion gap acidosis devel-
oped. By calculating the excess gap, an otherwise undetected non -
anion gap acidosis or metabolic alkalosis may be detected.
Respiratory components of the arterial blood gas
Partial pressure of arterial oxygen: P
a
O
2
The P
a
O
2
refl ects the lung ’ s ability to provide adequate arterial
oxygen. Normal arterial oxygen tension during pregnancy ranges
from 87 to 106 mmHg, depending upon the altitude at which a
patient lives. Although P
a
O
2
has been reported to decrease by 25%
when samples are obtained from gravidas in the supine position
[11] , arterial blood gas values have been shown to be unaffected
pH
<7.36 >7.44
Metabolic
acidosis
(HCO
3
–
< 20)
Metabolic
alkalosis
(HCO
3
–
> 20)
Respiratory
acidosis
(PCO
2
> 30)
Respiratory
alkalosis
(PCO
2
< 30)
Measure:
Determine:
Calculate:
Calculate:
Serum Na
+
,Cl
-
,CO
2
Anion gap =
Na
+
– (Cl
-
+ HCO
3
-
)
Is respiratory
compensation
adequate?
Is it
acute or chronic?
Expected pH
See Table 5.1
< 20
< 24
> 20
> 24
Excess anion gap =
Measured bicarb + (anion gap –12)
Coexisting primary
metabolic acidosis
Coexisting nongap
metabolic acidosis
Figure 5.3 A systematic approach to the
interpretation of an arterial blood gas during
pregnancy.
Maternal–Fetal Blood Gas Physiology
61
ratio is 500 – 600 and correlates with a shunt of 3 – 5% while a
shunt of 20% or more is present when the ratio is less than 200.
Calculation of the alveolar – arterial oxygen gradient is also an
oxygen tension calculation. The A – a gradient is most reliable
when breathing room air and is normally less than 20. An
increased gradient indicates pulmonary dysfunction. A – a gradi-
ent values, however, can change unpredictably with changes in
F
i
O
2
and vary with alterations in oxygen saturation and con-
sumption. Thus, the utility of this measurement in critically ill
patients has been questioned since these patients often require
a high F
i
O
2
and have unstable oxygenation [61] . Additionally,
the A – a gradient appears to be unreliable in the assessment of
lung impairment during pregnancy [11] .
Oxygen content - based indices include the shunt equation and
estimated shunt as derived from the shunt equation (Table 5.3 ).
The estimated shunt has been shown to be superior to the oxygen
tension - based indices described above [58] . The patient is given
100% oxygen for at least 20 minutes before determining arterial
and venous blood gases and hemoglobin. Since the estimated
shunt equation does not require a pulmonary artery blood
sample, the C
(a – v)
O
2
difference is assumed to be 3.5 mL/dL. A
normal shunt in non - pregnant patients is less than 10%, while a
20 – 29% shunt may be life - threatening in a patient with compro-
mised cardiovascular or neurologic function, and a shunt of 30%
and greater usually requires signifi cant cardiopulmonary support.
Intrapulmonary shunt values during normal pregnancy,
however, have been reported to be nearly three times above the
mean for non - pregnant individuals [12] . The mean Qs/Qt in
normotensive primiparous women at 36 – 38 weeks gestation
ranges from 10% in the knee – chest position to 13% in the stand-
ing position and 15% in the lateral position. The increased Qs/
Qt can be explained by the physiologic changes of pregnancy as
follows. Lung volumes decrease during gestation and the amount
of shunt increases. In addition, pulmonary blood fl ow increases
secondary to increased cardiac output. The combined effect of
decreased lung volumes and increased pulmonary fl ow results in
a higher intrapulmonary shunt during pregnancy.
Oxygenation of peripheral tissues
An adequate P
a
O
2
is only the initial step in oxygen transport,
however, and it does not guarantee well - oxygenated tissues. The
degree of intrapulmonary shunt, oxygen delivery, and oxygen
consumption all contribute to adequate tissue oxygenation.
Accurate assessment of peripheral oxygenation requires measure-
ment of arterial and venous partial pressures of oxygen, arterial
and venous oxygen saturation, hemoglobin, and cardiac output
(Table 5.3 ).
The amount of O
2
(mL) contained in 100 mL of blood defi nes
oxygen content. Oxygen delivery (DO
2
) is the volume of O
2
brought to peripheral tissues in 1 minute and consumption
(VO
2
) is the volume used by the tissues in 1 minute. Under
normal conditions, delivery of oxygen is 3 – 4 times greater than
consumption. Oxygen extraction measures the amount of O
2
transferred to tissues from 100 mL of blood and can be thought
Assessment of lung function
Impairment of lung function can be estimated using an oxygen
tension - or oxygen content - based index. Oxygen tension - based
indices include: (i) expected P
a
O
2
for a given fraction of inspired
oxygen (F
i
O
2
); (ii) P
a
O
2
/F
i
O
2
ratio; and (iii) alveolar – arterial
oxygen gradient (P
(A – a)
O
2
). These methods are quick and easy to
use but have limitations in the critically ill patient [58] . The shunt
calculation (Qsp/Qt) is an oxygen content - based index and is the
most reliable method of determining the extent to which pulmo-
nary disease is contributing to arterial hypoxemia. The need for
a pulmonary artery blood sample is a disadvantage, however, as
not all patients require invasive monitoring. The estimated shunt
calculation (est. Qsp/Qt) is derived from the shunt equation and
is the optimal method to estimate lung compromise when a pul-
monary artery catheter is not in place.
The expected P
a
O
2
is an oxygen tension - based calculation and
can be quickly estimated by multiplying the actual percentage of
inspired oxygen by 6 [59] . Thus, a patient receiving 50% oxygen
has an expected PO
2
of (50 × 6) or 300 mmHg. Alternatively, the
F
i
O
2
(e.g. 0.50 in a patient receiving 50% oxygen) may be multi-
plied by 500 to estimate the minimum PO
2
[60] . The P
a
O
2
/F
i
O
2
ratio has been used to estimate the amount of shunt. The normal
100
90
80
70
60
50
40
30
20
10
0
0
Left shift
Alkalosis
2,3-DPG
P
CO
2
Hypothermia
Carbon monoxide
Fetal hemoglobin
Right shift
Acidosis
2,3-DPG
PCO
2
Hyperthermia
10
Adult
20
HbO
2
saturation (%)
30 40 50 60 70 80 90 100
P
O
2
mmHg (pH 7.40)
Neonatal
(a–v)O
2
Figure 5.4 Maternal and fetal oxyhemoglobin dissociation curves. 2,3 - DPG,
2,3 - diphosphoglycerate. (Reproduced by permission from Semin Perinatol. WB
Saunders, 1984; 8:168.)
Chapter 5
62
can no longer provide adequate excretion of CO
2
. Clinically, this
is recognized as tachypnea, tachycardia, intercostal muscle
retraction, accessory muscle use, diaphoresis and paradoxical
breathing.
The metabolic component of the arterial blood
gas: bicarbonate
Measurement of bicarbonate refl ects a patient ’ s acid – base status.
The bicarbonate concentration reported with a blood gas is cal-
culated using the Henderson – Hasselbalch equation and repre-
sents a single ionic species. Total serum CO
2
(tCO
2
) content is
measured with serum electrolytes and is the sum of the various
forms of CO
2
in serum. Bicarbonate is the major contributor to
tCO
2
, and additional forms include dissolved CO
2
, carbamates,
carbonate, and carbonic acid. The calculated bicarbonate con-
centration does not include carbonic acid, carbonate, and
carbamates.
Frequently, arterial and venous blood samples are obtained
simultaneously, making arterial blood gas bicarbonate and
venous serum tCO
2
measurements available. Venous serum tCO
2
content is 2.5 – 3 mEq/L higher than arterial blood gas bicarbon-
ate, since CO
2
content is higher in venous than arterial blood and
all species of carbon dioxide are included in the determination of
tCO
2
. If the blood sample is arterial, the tCO
2
content reported
on the electrolyte panel should be 1.5 – 2 mEq/L higher than the
calculated bicarbonate. The tCO
2
measured directly with serum
electrolytes will be higher because it includes the different forms
of CO
2
. Since both blood gas bicarbonate and electrolyte tCO
2
determinations are usually available, there is a split of opinion as
to the relative clinical utility of each [63] . A recent review,
however, concludes that calculated and measured bicarbonate
values are close enough in most cases that either is acceptable for
clinical use [64] .
Disorders of acid – base balance
Metabolic acidosis
Metabolic acidosis is diagnosed on the basis of a decreased serum
bicarbonate and arterial pH. The baseline bicarbonate concentra-
tion during pregnancy should, of course, be kept in mind when
interpreting bicarbonate concentration. Metabolic acidosis
develops when fi xed acids accumulate or bicarbonate is lost.
Accumulation of fi xed acid occurs with overproduction as in
diabetic ketoacidosis or lactic acidosis, or with decreased acid
excretion as in renal failure. Diarrhea, a small bowel fi stula, and
renal tubular acidosis can all result in loss of extracellular
bicarbonate.
Although the clinical signs associated with metabolic acidosis
are not specifi c, multiple organ systems may be affected.
Tachycardia develops with the initial fall in pH, but bradycardia
usually predominates as the pH drops below 7.10. Acidosis causes
venous constriction and impairs cardiac contractility, increasing
venous return while cardiac output decreases. Arteriolar dilation
of as CaO
2
– CvO
2
. Thus, an O
2
extraction of 3 – 4 mL/dL suggests
adequate cardiac reserve to supply additional oxygen if demand
increases. Inadequate cardiac reserve is indicated by an O
2
extrac-
tion of 5 mL/dL or greater, and tissue extraction must be increased
to meet changing metabolic needs [62] .
Mixed venous oxygen tension (P
v
O
2
) and saturation (S
v
O
2
) are
measured from pulmonary artery blood. These measurements are
better indicators of tissue oxygenation than arterial values since
venous blood refl ects peripheral tissue extraction. Normal arterial
oxygen saturation is 100% and venous saturation is 75%, yielding
a normal arteriovenous difference (S
a
O
2
– S
v
O
2
) of 25%. An
increased S
v
O
2
( > 80%) can occur when oxygen delivery increases,
oxygen consumption decreases, (or some combination of the
two), cardiac output increases, or the pulmonary artery catheter
tip is in a pulmonary capillary instead of the artery. A decrease in
S
v
O
2
( < 50 – 60%) may be due to increased oxygen consumption,
decreased cardiac output or compromised pulmonary function.
The venous oxygen saturation may not change at all, however,
even with signifi cant cardiovascular changes.
Partial pressure of arterial carbon dioxide: P
a
CO
2
The metabolic rate determines the amount of carbon dioxide that
enters the blood. Carbon dioxide is then transported to the lung
as dissolved CO
2
, bicarbonate, and carbamates. It diffuses from
blood into alveoli and is removed from the body by ventilation,
or the movement of gas into and out of the pulmonary system.
Measurement of the arterial partial pressure of carbon dioxide
allows assessment of alveolar ventilation in relation to the meta-
bolic rate.
Ventilation (V
E
) is the amount of gas exhaled in 1 minute and
is the sum of alveolar and dead space ventilation (V
E
= V
A
+ V
DS
).
Alveolar ventilation (V
A
) is that portion of the lung that removes
CO
2
and transfers O
2
to the blood, while dead space (V
DS
) has no
respiratory function. As dead space increases, ventilation must
increase to maintain adequate alveolar ventilation. Dead space
increases with a high ventilation – perfusion ratio (V/Q) (i.e. an
acute decrease in cardiac output, acute pulmonary embolism,
acute pulmonary hypertension, or ARDS) and positive - pressure
ventilation.
Since P
a
CO
2
refl ects the balance between production and alve-
olar excretion of carbon dioxide, accumulation of CO
2
indicates
failure of the respiratory system to excrete the products of metab-
olism. The primary disease process may be respiratory or a
process outside the lungs. Extrapulmonary processes that increase
metabolism and CO
2
production include fever, shivering, sei-
zures, sepsis, and physiologic stress. Parenteral nutrition with
glucose providing more than 50% of non - protein calories can
also contribute to high CO
2
production.
Recognizing respiratory acid – base imbalance is important
because of the need to assist in CO
2
elimination. As V
E
increases,
the work of breathing can cause fatigue and respiratory failure. It
is important to recognize that the P
a
CO
2
may initially be normal,
but rises as the work of breathing exceeds a patient ’ s functional
reserve. Ventilatory failure occurs when the pulmonary system
Maternal–Fetal Blood Gas Physiology
63
sured ions. Na
+
and K
+
account for 95% of cations while HCO
3
−
and Cl
−
represent 85% of anions [66] . Thus, unmeasured anions
are greater than unmeasured cations. The anion gap is the differ-
ence between measured plasma cations (Na
+
) minus measured
anions (Cl
−
,
H
CO
3
−
) and is derived:
Total anions Total cations
unmeasured
anions
=
+=
Measured
anions
mmeasured
cations
Cl tCO
2
+
[]
+
[]
+
unmeasured
cations
unmeasured
aanions
unmeasured
cations
Unmeasured
anions
unme
⎛
⎝
)
=
[]
+
⎛
⎝
)
−
Na
++
aasured
cations
=
[]
−
[]
+
[]
()
=
[]
−
[]
Na Cl tCO
2
++
++
Anion gap Na Cl + ttCO
2
[]
()
A normal anion gap is 8 – 16 mEq/L. Potassium may be included
as a measured cation, although it contributes little to the accuracy
or utility of the gap. If K
+
is included in the calculation, however,
the normal range becomes 12 – 20 mEq/L [67] .
A change in the gap involves a change in unmeasured cations
or anions. An elevated gap is most commonly due to an accumu-
lation of unmeasured anions that include organic acids (i.e. keto-
acids or lactic acid), or inorganic acids (i.e. sulfate and phosphate)
[68] . A decrease in cations (i.e. magnesium and calcium) will also
increase the gap, but the serum level is usually life - threatening.
occurs at pH < 7.20. Respiratory rate and tidal volume increase in
an attempt to compensate for the acidosis. Maternal acidosis can
result in fetal acidosis as H
+
ions equilibrate across the placenta,
and fetal pH is generally 0.1 pH units less than the maternal pH.
The compensatory response to metabolic acidosis is an
increase in ventilation that is stimulated by the fall in the pH.
Hyperventilation lowers PCO
2
as the body attempts to return the
HCO PCO
32
−
[]
ratio toward normal. The respiratory response is
proportional to the degree of acidosis and allows calculation of
the expected PCO
2
for a given bicarbonate level (Table 5.1 ).
When the measured PCO
2
is higher or lower than expected for
the measured serum bicarbonate, a mixed acid – base disorder
must be present. This formula is ideally applied once the patient
has reached a steady state, when PCO
2
nadirs 12 – 24 hours after
the onset of acidosis [56] .
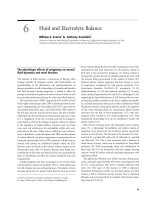
The classifi cation of metabolic acidosis as non - anion gap or
anion gap acidosis helps determine the pathologic process. Once
a metabolic acidosis is detected, serum electrolytes should be
obtained to calculate the anion gap. Frequently the clinical history
and a few additional diagnostic studies can identify the underly-
ing abnormality (Figure 5.5 ) [65] .
Electroneutrality in the body is maintained because the sum of
all anions equals the sum of all cations. Na
+
, K
+
, Cl
−
, and HCO
3
−
are the routinely measured serum ions while Mg
+
, Ca
2+
, proteins
(particularly albumin), lactate, HPO
4
−
and SO
4
−
are the unmea-
pH, HCO
3
2–
Calculate anion gap
Elevated anion gap
Measure:
Serum glucose
Serum ketones
Serum creatinine
Lactate
Serum osmolality
Toxin screen
Salicylate level
Ethylene glycol ingestion
Lactic acidosis
Methanol ingestion
Paraldehyde ingestion
Propylene glycol ingestion
Salicylate toxicity
Renal failure (late acute or early chronic)
Ketoacidosis
Diabetic
Alcoholic
Starvation
Normal anion gap
Gastrointestinal bicarbonate loss
Diarrhea
Small bowel fistula
Renal tubular acidosis
Medication
Carbonic anhydrase inhibitors (e.g.,
acetozolamide)
Amphotericin B
Cyclosporine
Cholestyramine
Acid ingestion
Hypoaldosteronism
Renal failure (early acute or mild chronic)
Figure 5.5 Etiology and evaluation of metabolic
acidosis.
Chapter 5
64
The following example demonstrates use of the anion gap in a
patient who had been experiencing dysuria, polyuria, and poly-
dypsia of several days duration. Initial evaluation of this 19 - year -
old gravida at 24 weeks gestation was notable for a serum glucose
level of 460 mg/dL and 4+ urinary ketones. Further investigation
revealed: arterial pH of 7.30, HCO
3
−
of 14 mEq/L, serum Na
+
of
133 mEq/L, K
+
of 4.1 mEq/L, tCO
2
of 15 mEq/L, and Cl
−
of
95 mEq/L. The anion gap was determined:
Anion gap Na Cl tCO
mEq L mEq L mEq L
=
[]
−
[]
+
[]
()
=−+
()
=
+− −
2
133 95 15
13
33 110
23
mEq L mEq L
Anion gap mEq L
−
=
The elevated anion gap is the result of unmeasured organic
anions or ketoacids that have accumulated and decreased serum
bicarbonate. As this patient with type I diabetes mellitus receives
insulin therapy, the anion gap will normalize, refl ecting disap-
pearance of the ketoacids from the serum.
The limitations of the anion gap, however, should be recog-
nized. Various factors can lower the anion gap, but its importance
is not so much in the etiology of the decrease as in its ability to
mask an elevated gap. Since albumin accounts for the majority of
unmeasured anions, the gap decreases as albumin levels fall. For
each 1 g decrease in albumin, the gap may be lowered by 2.5 –
3 mEq/L. The most common cause of a lowered gap is decreased
serum albumin. Other less common causes include markedly
elevated levels of unmeasured cations (K
+
, Mg
+
, and Ca
2+
), hyper-
lipidemia, lithium carbonate intoxication, multiple myeloma,
and bromide or iodide intoxication.
Although an elevated anion gap is traditionally associated with
metabolic acidosis, it may also occur in the presence of severe
metabolic alkalosis. The ionic activity of albumin changes with
increasing pH and protons are released. The net negative charge
on each molecule increases, thereby increasing unmeasured
anions. Volume contraction leads to hyperproteinemia and aug-
ments the anion gap.
If an anion gap acidosis is present, the ratio of the change in
the anion gap (the delta gap) to the change in HCO
3
−
can be
helpful in determining the type of disturbances present:
∆
∆
gap
HCO
Anion gap
HCO
33
12
24
−−
=
−
−
[]
In simple anion gap metabolic acidosis, the ratio approximates
1.0, since the decrease in bicarbonate equals the increase in
anions. The delta gap for the patient with diabetes and ketoaci-
dosis previously described is calculated as follows:
∆
∆
gap
HCO
Anion gap
HCO
33
12
24
23 12
24 14
11
10
11
−−
=
−
−
[]
=
−
−
==.
The delta gap is 0 when the acidosis is a pure non - anion gap
acidosis. A delta gap of 0.3 – 0.7 is associated with one of two
mixed metabolic disorders: (i) a high anion gap acidosis and
respiratory alkalosis and (ii) high anion gap with a pre - existing
normal or low anion gap. A ratio greater than 1.2 implies a meta-
bolic alkalosis superimposed on a high anion gap acidosis or a
mixed high anion gap acidosis and chronic respiratory acidosis.
The use of the delta gap is, however, limited by the wide range of
normal values for the anion gap and bicarbonate, and its accuracy
has been questioned [69] .
When a normal anion gap metabolic acidosis is present, the
urinary anion gap may be helpful in distinguishing the cause of
the acidosis:
urinary anion gap urine Na urine K urine Cl=
[]
+
[]
−
[]
++ −
The urinary anion gap is a clinically useful method to estimate
urinary ammonium ( NH
4
+
) excretion. Since the amount of NH
4
+
excreted in the urine cannot be directly measured, the urinary
anion gap helps determine whether the kidney is responding
appropriately to a metabolic acidosis [70] . Normally, the urine
anion gap is positive or close to zero. A negative gap (Cl
−
> N a
+
and K
+
) occurs with gastrointestinal bicarbonate loss and NH
4
+
excretion by the kidney increases appropriately. In contrast, a
positive gap (Cl
−
< N a
+
and K
+
) in a patient with acidosis suggests
impaired distal urinary acidifi cation with inappropriately low
NH
4
+
excretion.
A variety of processes can lead to metabolic acidosis and
therapy will depend on the underlying condition. Adequate oxy-
genation should be ensured and mechanical ventilation instituted
for impending respiratory failure. The use of bicarbonate solu-
tions to correct acidosis has been suggested when arterial pH is
less than 7.10 or bicarbonate is lower than 5 mEq/L. Bicarbonate
solutions must be administered with caution since an “ over-
shoot ” alkalosis can lower seizure threshold, impair oxygen avail-
ability to peripheral tissues, and stimulate additional lactate
production.
Metabolic alkalosis
Metabolic alkalosis is characterized by a rise in serum bicarbonate
concentration and an elevated arterial pH. The most impressive
clinical effects of metabolic alkalosis are neurologic and include
confusion, obtundation, and tetany. Cardiac arrhythmias, hypo-
tension, hypoventilation and various metabolic aberrations may
accompany these neurologic changes.
Metabolic alkalosis results from a loss of acid or the addition
of alkali. The development of metabolic alkalosis occurs in two
phases, with the initial addition or generation of HCO
3
−
followed
by the inability of the kidney to excrete the excess HCO
3
−
. The two
most common causes of metabolic alkalosis are excessive loss of
gastric secretions and diuretic administration. Once established,
volume contraction, hypercapnea, hypokalemia, glucose loading,
and acute hypercalcemia promote HCO
3
−
reabsorption by the
kidney and sustain the alkalosis.
Maternal–Fetal Blood Gas Physiology
65
a responsive disorder, infusion of sodium chloride will correct
the abnormality. Conversely, saline administration will not
correct a chloride resistant disorder and can be harmful.
Treatment of the primary disease will concurrently correct the
alkalosis. Although mild alkalemia is generally well tolerated,
critically ill surgical patients with a pH ≥ 7.55 have increased
mortality [72,73] .
Respiratory acidosis
Respiratory acidosis is characterized by hypercapnea (a rise in
PCO
2
) and a decreased arterial pH. The development of respira-
tory acidosis indicates the failure of carbon dioxide excretion to
match CO
2
production. A variety of disorders can contribute to
this acid – base abnormality (Table 5.4 ). It is important to remem-
ber that the normal PCO
2
in pregnancy is 30 mmHg, and norma-
tive data for non - pregnant patients do not apply to the gravida.
The clinical manifestations of acute respiratory acidosis are
particularly evident in the central nervous system. Since carbon
dioxide readily penetrates the blood – brain barrier and cerebro-
spinal fl uid buffering capacity is not as great as blood, PCO
2
elevations quickly decrease the pH of the brain. Thus, neurologic
compromise may be more signifi cant with respiratory acidosis
than metabolic acidosis [59] . Acute hypercapnia also decreases
The degree of respiratory compensation for metabolic alkalosis
is more variable than with metabolic acidosis, and formulas to
estimate the expected P
a
CO
2
have not proven useful [56] . Alkalosis
tends to cause hypoventilation but P
a
CO
2
rarely exceeds 55 mmHg
[56,71] . Tissue and red blood cells attempt to lower HCO
3
−
by
exchanging intracellular H
+
ions for extracellular Na
+
and K
+
.
Once metabolic alkalosis is diagnosed, determination of
urinary chloride concentration can be helpful in determining the
etiology (Figure 5.6 ). Urinary chloride is a more reliable indicator
of volume status than urinary sodium concentration in this group
of patients. Sodium is excreted in the urine with bicarbonate to
maintain electroneutrality and occurs independently of volume
status. Therefore, low urinary chloride in patients with volume
contraction accurately refl ects sodium chloride retention by the
kidney.
A urinary chloride concentration < 10 mEq/L that improves
with sodium chloride administration is a chloride - responsive
metabolic alkalosis. In contrast, a urine chloride > 20 mEq/L indi-
cates that the alkalosis will not improve with saline administra-
tion and is a chloride - resistant alkalosis. Urine chloride levels
must be interpreted with caution since levels are falsely elevated
when obtained within several hours of diuretic administration.
Treatment of metabolic alkalosis is aimed at eliminating
excess bicarbonate and reversing factors responsible for main-
taining the alkalosis. If the urinary chloride level indicates
pH, HCO
3
–
Measure urinary chloride
Chloride resistant
(Urine Cl
–
> 20 mEq/L)
Hypertensive:
Mineralocorticoid excess
Hyperaldosteronism
Normotensive:
Magnesium depletion
Diuretic use (current)
Profound hypokalemia
Alkali ingestion
Bicarbonate therapy
Antacids
Lactate
Acetate
Citrate
Massive blood transfusion
Hypercalcemia
Medications
Carbenicillin
Penicillin
Sulfates
Parathyroid disease
Refeeding alkalosis
Chloride responsive
(Urine Cl
–
< 10 mEq/L)
Gastrointestinal
Vomiting
Nasogastric suction
Diuretic use (discontinued)
Contraction alkalosis
Posthypercapnea
Figure 5.6 Etiology and evaluation of metabolic alkalosis.
Table 5.4 Causes of respiratory acidosis.
Airway obstruction
Aspiration
Laryngospasm
Severe bronchospasm
Impaired ventilation
Pneumothorax
Hemothorax
Severe pneumonia
Pulmonary edema
Adult respiratory distress syndrome
Circulatory collapse
Massive pulmonary embolism
Cardiac arrest
CNS depression
Medication
Sedatives
Narcotics
Cerebral infarct, trauma or encephalopathy
Obesity – hypoventilation syndrome
Neuromuscular disease
Myasthenic crisis
Severe hypokalemia
Guillain – Barr é
Medication
Chapter 5
66
acid – base disorder in which the compensatory response can
return the pH to normal.
Respiratory alkalosis may be diagnostic of an underlying con-
dition and is usually corrected with treatment of the primary
problem. Hypocapnea itself is not life - threatening but the disease
causing the alkalosis may be. The presence of respiratory alkalosis
should always raise suspicion for hypoxemia, pulmonary embo-
lism, or sepsis. These conditions, however, can be overlooked if
the only concern is correction of the alkalosis. Mechanical venti-
lation may lead to iatrogenic respiratory alkalosis and the PCO
2
can usually be corrected by lowering the machine - set respiratory
rate. [75]
References
1 Kruse JA . Acid – base interpretations . Crit Care 1993 ; 14 : 275 .
2 MacRae DJ , Palavradji. Maternal acid – base changes in pregnancy . J
Obstet Gynaecol Br Cwlth 1967 ; 74 : 11 .
3 Hankins GDV , Harvey CJ , Clark SL , Uckan EM . The effects of mater-
nal position and cardiac output on intrapulmonary shunt in normal
third - trimester pregnancy . Obstet Gynecol 1996 ; 88 : 327 .
4 Cruikshank DP , Hays PM . Maternal physiology in pregnancy . In:
Gabbe S , Niebyl J , Simpson JL , eds. Obstetrics: Normal and Problem
Pregnancies , 2nd edn. New York : Churchill Livingstone , 1991 : 129 .
cerebral vascular resistance, leading to increased cerebral blood
fl ow and intracranial pressure.
The compensatory response depends on the duration of the
respiratory acidosis. In acute respiratory acidosis, the respiratory
center is stimulated to increase ventilation. Carbon dioxide is
neutralized in erythrocytes by hemoglobin and other buffers, and
bicarbonate is generated. An acute disturbance implies that renal
compensation is not yet complete. Sustained respiratory acidosis
(longer than 6 – 12 hours) stimulates the kidney to increase acid
excretion, but this mechanism usually requires 3 – 5 days for full
compensation [74] .
The primary goal in the management of respiratory acidosis is
to improve alveolar ventilation and decrease arterial PCO
2
.
Assessment and support of pulmonary function are paramount
when a patient has respiratory acidosis. Carbon dioxide accumu-
lates rapidly, and PCO
2
rises 2 – 3 mmHg/min in a patient with
apnea. The underlying condition should be rapidly corrected and
may include relief of an airway obstruction or pneumothorax,
administration of bronchodilator therapy, narcotic reversal, or a
diuretic.
Adequate oxygenation is crucial because hypoxemia is more
life - threatening than hypercapnia. In the pregnant patient,
hypoxemia also compromises the fetus. Uterine perfusion should
be optimized and maternal oxygenation ensured since the com-
bination of maternal hypoxemia and uterine artery hypoperfu-
sion profoundly affects the fetus. When a patient cannot maintain
adequate ventilation despite aggressive support, endotracheal
intubation and mechanical ventilation should be performed
without delay.
Respiratory alkalosis
Respiratory alkalosis is characterized by hypocapnea (decreased
PCO
2
) and an increased arterial pH. Acute hypocapnea frequently
is accompanied by striking clinical symptoms, including pares-
thesias, circumoral numbness, and confusion. Tachycardia, chest
tightness, and decreased cerebral blood fl ow are some of the
prominent cardiovascular effects. Chronic respiratory alkalosis,
however, is usually asymptomatic.
Respiratory alkalosis is the result of increased alveolar ventila-
tion (Table 5.5 ). Hyperventilation can develop from stimulation
of brainstem or peripheral chemoreceptors and nociceptive lung
receptors. Higher brain centers can override chemoreceptors and
occurs with involuntary hyperventilation. Respiratory alkalosis is
commonly encountered in critically ill patients in response to
hypoxemia or acidosis, or secondary to central nervous system
dysfunction.
The compensatory response is divided into acute and chronic
phases. In acute alkalosis, there is an instantaneous decrease in
H
+
ion concentration due to tissue and red blood cell buffer
release of H
+
ions. If the duration of hypocapnea is greater than
a few hours, renal excretion of bicarbonate is increased and acid
excretion is decreased. This response requires at least several days
to reach a steady state. Chronic respiratory alkalosis is the only
Table 5.5 Causes of respiratory alkalosis.
Pulmonary disease
Pneumonia
Pulmonary embolism
Pulmonary congestion
Asthma
Drugs
Salicylates
Xanthines
Nicotine
CNS disorders
Voluntary hyperventilation
Anxiety
Neurologic disease
Infection
Trauma
Cerebrovascular accident
Tumor
Other causes
Pregnancy
Pain
Sepsis
Hepatic failure
Iatrogenic mechanical hyperventilation
Maternal–Fetal Blood Gas Physiology
67
28 Bloom SA , Canzanello VJ , Strom JA , Madias NE . Spurious assessment
of acid – base status due to dilutional effect of heparin . Am J Med 1985 ;
79 : 528 .
29 New W . Pulse oximetry . J Clin Monit 1985 ; 1 : 126 .
30 Al - Ameri MW , Kruse JA , Carlson RW . Blood sampling from arterial
catheters: minimum discard volume to achieve accurate laboratory
results . Crit Care Med 1986 ; 14 : 399 .
31 Bhaskaran NC , Lawler PG . How much blood for a blood gas?
Anesthesiology 1988 ; 43 : 811 .
32 Biswas CK , Ramos JM , Agroyannis B , Kerr DNS . Blood gas analysis:
effect of air bubbles in syringe and delay in estimation . Br Med J 1982 ;
284 : 923 .
33 Morganroth ML . Six steps to acid – base analysis: clinical applications .
J Crit Ill 1990 ; 5 : 460 .
34 Harsten A , Berg B , Inerot S , Muth L . Importance of correct handling
of samples for the results of blood gas analysis . Acta Anesthesiol Scand
1988 ; 32 : 365 .
35 Mueller RG , Lang GE . Blood gas analysis: effect of air bubbles in
syringe and delay in estimation . Br Med J 1982 ; 285 : 1659 .
36 Madiedo G , Sciacca R , Hause L . Air bubbles and temperature effect
on blood gas analysis . J Clin Pathol 1980 ; 33 : 864 .
37 Schuch CS , Price JG . Determination of time required for blood gas
homeostasis in the intubated, post - open - heart surgery adult following
a ventilator change . NTI Res Abs 1986 ; 15 : 314 .
38 McHugh RD , Epstein RM , Longnecker DE . Halothane mimics oxygen
in oxygen microelectrodes . Anesthesiology 1979 ; 50 : 47 .
39 Douglas IHS , McKenzie PJ , Ledingham IM , Smith G . Effect of halo-
thane on PO
2
electrode . Lancet 1978 ; 2 : 1370 .
40 Maekawa T , Okuda Y , McDowall DG . Effect of low concentrations of
halothane on the oxygen electrode . Br J Anaesth 1980 ; 52 : 585 .
41 Dent JG , Netter KJ . Errors in oxygen tension measurements caused
by halothane . Br J Anaesth 1976 ; 48 : 195 .
42 Hess CE , Nichols AB , Hunt WB . Pseudohypoxemia secondary to
leukemia and thrombocytopenia . N Engl J Med 1979 ; 301 : 363 .
43 Nearman HS , Sampliner JE . Respiratory monitoring . In: Berk JL ,
Sampliner JE , eds. Handbook of critical care , 3rd edn. Boston : Little
Brown , 1982 : 125 – 143 .
44 Demling BK , Knox JB . Basic concepts of lung function and dysfunc-
tion: oxygenation, ventilation and mechanics . New Horiz 1993 ; 1 : 362 .
45 Huch A , Huch R , Konig V et al. Limitations of pulse oximetry . Lancet
1988 ; 1 : 357 .
46 Dildy GA , Loucks CA , Porter TF , Sullivan CA , Belfort MA , Clark SL .
Many normal pregnant women residing at moderate altitude have lower
arterial oxygen saturations than expected . Society for Gynecologic
Investigation , Atlanta, GA , March 1998 .
47 Dildy GA , Sullivan CA , Moore LG , Richlin ST , Loucks CA , Belfort
MA , Clark SL . Altitude reduces and pregnancy increases maternal arte-
rial oxygen saturation . Society for Maternal - Fetal Medicine , San
Francisco, CA , January 1999 .
48 Richlin S , Cusick W , Sullivan C , Dildy GA , Belfort MA . Normative
oxygen saturation values for pregnant women at sea level . The American
College of Obstetricians and Gynecologists , New Orleans, LA , May
1998 .
49 Goldberg M , Green SB , Moss ML et al. Computer - based instruction
and diagnosis of acid – base disorders . JAMA 1973 ; 223 : 269 .
50 Davenport HW . Normal acid – base paths . In: The ABC of Acid – Base
Chemistry , 6th edn. Chicago : University of Chicago Press , 1974 :
69 .
5 Artal R , Wiswell R , Romem Y , Dorey F . Pulmonary responses to
exercise in pregnancy . Am J Obstet Gynecol 1986 ; 154 : 378 .
6 Liberatore SM , Pistelli R , Patalano F et al. Respiratory function during
pregnancy . Respiration 1984 ; 46 : 145 .
7 Andersen GJ , James GB , Mathers NP et al. The maternal oxygen
tension and acid – base status during pregnancy . J Obstet Gynaecol Br
Cwlth 1969 ; 76 : 16 .
8 Dayal P , Murata Y , Takamura H . Antepartum and postpartum acid –
base changes in maternal blood in normal and complicated pregnan-
cies . J Obstet Gynaecol Br Cwlth 1972 ; 79 : 612 .
9 Templeton A , Kelman GR . Maternal blood - gases, (PA|d2dend -
Pa|d2dend (Maternal blood - gases, PaO2 – PaO2, physiological shunt
and VD/VT in normal pregnancy) physiological shunt and V|dDdend/
V|dTdend in normal pregnancy . Br J Anaesth 1976 ; 48 : 1001 .
10 Pernoll ML , Metcalfe J , Kovach PA et al. Ventilation during rest
and exercise in pregnancy and postpartum . Respir Physiol 1975 ; 25 :
295 .
11 Awe RJ , Nicotra MB , Newsom TD , Viles R . Arterial oxygenation and
alveolar - arterial gradients in term pregnancy . Obstet Gynecol 1979 ; 53 :
182 .
12 Hankins GDV , Clark SL , Uckan EM et al. Third trimester arterial
blood gas and acid – base values in normal pregnancy at moderate
altitude . Obstet Gynecol 1996 ; 88 : 347 .
13 Sobrevilla LA , Cassinelli MT , Carcelen A et al. Human fetal and
maternal oxygen tension and acid – base status during delivery at high
altitude . Am J Obstet Gynecol 1971 ; 111 : 1111 .
14 Novy MJ , Edwards MJ . Respiratory problems in pregnancy . Am J
Obstet Gynecol 1967 ; 99 : 1024 .
15 Weinberger SE , Weiss ST , Cohen WR et al. Pregnancy and the lung .
Am Rev Respir Dis 1980 ; 121 : 559 .
16 Lucius H , Gahlenbeck H , Kleine HO et al. Respiratory functions,
buffer system, and electrolyte concentrations of blood during human
pregnancy . Respir Physiol 1970 ; 9 : 311 .
17 Cain SM . Peripheral uptake and delivery in health and disease . Clin
Chest Med 1983 ; 4 : 139 .
18 Stock MC , Shapiro BA , Cane RD . Reliability of SvO
2
in predicting
A - VDO
2
and the effect of anemia . Crit Care Med 1986 ; 14 : 402 .
19 Bryan - Brown CW , Back SM , Malcabalig et al. Consumable oxygen:
oxygen availability in relation to oxyhemoglobin dissociation . Crit
Care Med 1973 ; 1 : 17 .
20 Perutz MF . Hemoglobin structure and respiratory transport . Sci Ann
1978 ; 239 : 92 .
21 Rackow EC , Astiz M . Pathophysiology and treatment of septic shock .
JAMA 1991 ; 266 : 548 .
22 Shoemaker WC , Ayers S , Grenuik A et al. Textbook of Critical Care ,
2nd edn. Philadelphia : WB Saunders , 1989 .
23 Shibutani K , Komatsu T , Kubal K et al. Critical levels of oxygen
delivery in anesthetical man . Crit Care Med 1983 ; 11 : 640 .
24 Barron W , Lindheimer M . Medical Disorders During Pregnancy , 1st
edn. Mosby - Year Book , St Louis , 1991 : 234 .
25 Gemzell CA , Robbe H , Strom G et al. Observations on circulatory
changes and muscular work in normal labor . Acta Obstet Gynecol
Scand 1957 ; 36 : 75 .
26 Ueland K , Hansen JM . Maternal cardiovascular hemodynamics:
II. Posture and uterine contractions . Am J Obstet Gynecol 1969 ; 103 :
1 .
27 Walton JR , Shapiro BA , Wine C . Pre - analytic error in arterial blood
gas measurement . Respir Care 1981 ; 26 : 1136 .
Chapter 5
68
64 Kruse JA . Calculation of plasma bicarbonate concentration versus
measurement of serum CO
2
content. pK` revisited . Clin Int Care 1995 ;
6 : 15 .
65 Battle DC , Hizon M , Cohen E et al. The use of the urinary anion gap
in the diagnosis of hyperchloremic metabolic acidosis . N Engl J Med
1988 ; 318 : 594 .
66 Preuss HG . Fundamentals of clinical acid – base evaluation . Clin Lab
Med 1993 ; 13 : 103 .
67 Kruse JA . Use of the anion gap in intensive care and emergency
medicine . In: Vincent MJ , ed. Yearbook of intensive care and emergency
medicine . New York : Springer , 1994 : 685 – 696 .
68 Oh MS , Carroll HJ . Current concepts: the anion gap . N Engl J Med
1977 ; 297 : 814 .
69 Salem MM , Mujais SK . Gaps in the anion gap . Arch Intern Med 1992 ;
152 : 1625 .
70 Halperin ML , Richardson RMA , Bear RA et al. Urine ammonium: the
key to the diagnosis of distal renal tubular acidosis . Nephron 1988 ; 50 :
1 .
71 Wilson RF . Blood gases: pathophysiology and interpretation . In:
Critical Care Manual: Applied Physiology and Principles of Therapy ,
2nd edn. Philadelphia : FA Davis , 1992 : 389 – 421 .
72 Wilson RF , Gibson D , Percinel AK et al. Severe alkalosis in critically
ill surgical patients . Arch Surg 1972 ; 105 : 197 .
73 Rimmer JM , Gennari FJ . Metabolic alkalosis . J Intensive Care Med
1987 ; 2 : 137 .
74 Nanji AA , Whitlow KJ . Is it necessary to transport arterial blood
samples on ice for pH and gas analysis? Can Anaesth Soc J 1984 ; 31 :
568 .
75 Ng RH , Dennis RC , Yeston N et al. Factitious cause of unexpected
arterial blood - gas results . N Engl J Med 1984 ; 310 : 1189 .
51 Arbus GS . An in vivo acid – base nomogram for clinical use . Can Med
Assoc J 1973 ; 109 : 291 .
52 Cogan MJ . In: Brenner BM , Rector FC Jr , eds. The Kidney , 3rd edn.
Philadelphia : WB Saunders , 1986 : 473 .
53 Haber RJ . A practical approach to acid – base disorders . West J Med
1991 ; 155 : 146 .
54 Ghosh AK . Diagnosing acid - base disorders . J Assoc Physicians India
2006 ; 54 : 720 – 724 .
55 Tremper KK , Barker SJ . Blood - gas analysis . In: Hall JB , Schmidt GA ,
Wood LDH , eds. Principles of Critical Care . N e w Yo r k : M c G r a w - H i l l ,
1992 : 181 – 196 .
56 Narins RG . Acid – base disorders: defi nitions and introductory con-
cepts . In: Narins RG , ed. Clinical Disorders of Fluid and Electrolyte
Metabolism , 5th edn. New York : McGraw - Hill , 1994 : 755 – 767 .
57 Morganroth ML . An analytic approach to diagnosing acid – base dis-
orders . J Crit Ill 1990 ; 5 : 138 .
58 Cane RD , Shapiro BA , Templin R , Walther K . Unreliability of oxygen
tension - based indices in refl ecting intrapulmonary shunting in criti-
cally ill patients . Crit Care Med 1988 ; 16 : 1243 .
59 Wilson RF . Acid – base problems . In: Critical Care Manual: Applied
Physiology and Principles of Therapy , 2nd edn. Philadelphia : FA Davis ,
1992 : 715 – 756 .
60 Shapiro BA , Peruzzi WT . Blood gas analysis . In: Civetta J , Taylor R ,
Kirby J , eds. Critical Care , 2nd edn. Philadelphia : Lippincott , 1992 :
325 – 342 .
61 Narins RG , Emmett M . Simple and mixed acid – base disorders: a
practical approach . Medicine 1980 ; 59 : 161 .
62 Shapiro BA , Peruzzi WT . Interpretation of blood gases . In: Ayers SM ,
Grenvik A , Holbrook PR , Shoemaker WC , eds. Textbook of Critical
Care , 3rd edn. Philadelphia : WB Saunders , 1995 : 278 – 294 .
63 Kruse JA , Hukku P , Carlson RW . Relationship between the apparent
dissociation constant of blood carbonic acid and severity of illness .
J Lab Clin Med 1989 ; 114 : 568 .