Financial Modeling with Crystal Ball and Excel Chapter 6 docx
Bạn đang xem bản rút gọn của tài liệu. Xem và tải ngay bản đầy đủ của tài liệu tại đây (278.01 KB, 10 trang )
CHAPTER
6
Selecting Run Preferences
N
ow that we have covered the basics of setting up a Crystal Ball model and using
its forecasts to help you make decisions, we will take a closer look at the options
available to you through the Run Preferences menu to control the execution of your
simulation models.
TRIALS
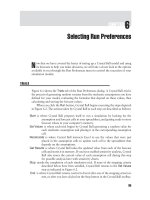
Figure 6.1 shows the Trials tab of the Run Preferences dialog. A Crystal Ball trial is
the process of generating random variates from the stochastic assumptions you have
defined for your model, evaluating the formulas that depend on these values, then
calculating and storing the forecast values.
WhenyouclicktheRun button, Crystal Ball begins executing the steps depicted
in Figure 6.2. The actions taken by Crystal Ball at each step are described as follows:
Start is where Crystal Ball prepares itself to run a simulation by looking for the
assumption and forecast cells in your spreadsheet, and getting ready to store
forecast values in your computer’s memory.
Set Values is where each trial begins by Crystal Ball generating a random value for
each stochastic assumption and placing it in the corresponding assumption
cell.
Recalculate is where Crystal Ball instructs Excel to use the values that were just
placed in the assumption cells to update each cell in the spreadsheet that
depends on the assumptions.
Get Results is where Crystal Ball takes the updated value from each of the forecast
cells and stores it in memory. If you have enabled sensitivity analysis, Crystal
Ball also stores the current value of each assumption cell during this step
for possible analysis later with sensitivity charts.
Stop marks the completion of each simulation trial. If none of the stopping criteria
described below have been satisfied, Crystal Ball returns to the Set Values
step as indicated in Figure 6.2.
End is where Crystal Ball returns control to Excel after one of the stopping criteria is
met, or after you have clicked on the Stop button in the Crystal Ball toolbar.
95
96 FINANCIAL MODELING WITH CRYSTAL BALL AND EXCEL
FIGURE 6.1 Run Preferences Trials tab.
Crystal Ball executes the simulation cycle automatically, but it also gives you
some control over selected aspects of the execution. This section describes those
aspects.
Number of Trials to Run
This is the maximum number of trials you want Crystal Ball to run before it stops the
simulation. There are other stopping criteria, so sometimes the simulation will stop
before the maximum number of trials is reached. In general, the more trials you run,
the better (more precise) will be your solution in a statistical sense. A rule of thumb
is to use no fewer than 2,000 trials (see Figure 2.7). With Crystal Ball’s Extreme
Speed feature, 10,000 trials will execute quickly for moderately complex models, so
that is the number of trials specified in most of the examples shown in this book.
Stop on Calculation Errors
When this box is checked, Crystal Ball will stop the simulation when a numerical
error occurs in an Excel calculation. Numerical errors are often caused by dividing
by some zero somewhere. For example, for arrays of values that have different
algebraic signs, using Excel’s =IRR(values,guess) formula in a forecast cell can
sometimes cause a numerical error.
Selecting Run Preferences
97
Start
Set Values
Recalculate
Get Results
Stop
End
FIGURE 6.2 Simulation cycle.
It is good practice always to have this box checked, as numerical errors are
usually the result of errors in model logic and this feature of Crystal Ball will alert
you if any such errors are present. However, if you are using =IRR(values,guess)
in your model and have difficulty getting Crystal Ball to run to completion, try
unchecking this box.
Stop When Precision Control Limits Are Reached
Checking this box enables Crystal Ball’s statistical precision-checking feature. The
precision of an estimate is determined by the half-width of a (1 −α)100% confidence
interval, which is computed by Crystal Ball for the mean as z
α/2
s/
√
n,where
z
α/2
is the (1 − α/2)100 percentile of the standard normal distribution, s is the
Standard Deviation,andn is the number of trials from which the standard error is
computed. As discussed in Chapter 2, the value of s/
√
n is reported in the Statistics
View of the Forecast window as Mean Standard Error. Smaller values of s yield
smaller half-widths, which yields more precise estimates. Each of the three terms in
the half-width calculation (z
α/2
, s,andn) can be used to increase the precision of the
estimate of the mean.
98 FINANCIAL MODELING WITH CRYSTAL BALL AND EXCEL
The value of z
α/2
is affected by the number you enter in the Confidence level
field in Figure 6.1, which is your specification of 1 −α. For example, when you
specify a 95 percent confidence level, then z
α/2
= z
.975
= 1.96, which means that the
precision is measured as roughly two standard errors of the mean. While there may
sometimes be good reason to change the value of 1 − α in particular situations,
leaving the confidence level at 95% will suffice for most financial models.
Crystal Ball calculates the standard deviation of the forecast values, s,using
Expression 2.1 as the simulation progresses. While s cannot be affected by options
specified in the dialog shown in Figure 6.1, it is possible to increase precision by
reducing s (or equivalently, the variance, s
2
) through so-called variance reduction
techniques, which require structural changes to the model and are described in
Appendix C.
The precision of the estimate increases at a rate inversely proportional to the
square root of the number of trials. During the simulation, Crystal Ball recalculates
the half-width periodically, then stops the simulation when either the maximum
number of trials or specified precision is reached, whichever comes first.
As an example of how to use the precision control feature, open the file
Accumulate.xls, and click on the Forecast cell D4. Then select Define→Define
Forecast to get the Define Forecast dialog shown in Figure 6.3. Select the
Precision tab. Note that you might have to click on the More icon—two arrowheads
pointing down (
) in the upper right portion of the dialog to see the tabs. Check
the two check boxes and punch the radio button indicated in Figure 6.3, and specify
50000 as the absolute units of precision as shown. Click OK.
In Run Preferences, change the Number of trials to run to one million (enter
1000000 with no commas), and make sure that Stop when precision control limits
are reached is checked. Then click OK. Press the Run button on the Crystal Ball
toolbar. Your simulation model should stop running well before 1 million trials
have run, and you should see a Statistics View for Year 30 Wealth that looks like
that shown in Figure 6.4.
It is also possible to specify precision for the median, the standard deviation, or
a selected percentile. This is done by following steps similar to those above for speci-
fying the precision of the mean. See the Crystal Ball User Manual for specific details.
SAMPLING
Figure 6.5 shows the Sampling tab of the Run Preferences dialog, which has options
related to the algorithms for generating the random numbers Crystal Ball uses to
drive the simulation. This section gives a high-level overview of these options. For a
more technical discussion, see Appendix B.
Random Number Generation
Random numbers are values between 0 and 1 that Crystal Ball generates to drive
all the randomness in your models. The algorithm that Crystal Ball uses to generate
Selecting Run Preferences
99
FIGURE 6.3 Define Forecast dialog showing the Precision tab.
FIGURE 6.4 Statistics View for Year 30 Wealth forecast showing
that a precision of $46,587 was reached in 40,000 trials.
100 FINANCIAL MODELING WITH CRYSTAL BALL AND EXCEL
FIGURE 6.5 Run Preferences Sampling tab.
these random numbers has the capability to produce over two billion different
values in such a way they appear to have the Uniform(0,1) distribution and be in a
completely ‘‘random’’ order, that is, the numbers appear to be serially independent.
However, this random order is predetermined and is the same every time Crystal
Ball runs. See Appendix B for more details about the algorithm used by Crystal
Ball’s random number generator.
Think of these random numbers as being placed in the predetermined random
order clockwise on the perimeter of a circle with a spinner arrow in the middle.
Once the spinner arrow is at its starting point, Crystal Ball will select each random
number it needs sequentially in a clockwise direction from the circle beginning with
the number at the spinner’s starting point. With this image in mind, you can think of
the Random number generation options on the Sampling tab as giving you control
over where to set the spinner to designate the starting point.
By checking the Use same sequence of random numbers check box and spec-
ifying an Initial seed value as indicated in Figure 6.5, you are telling Crystal Ball to
set the starting point for its random numbers at the same place each time you run a
simulation. The Initial seed value must be an integer between 1 and 2147483647.
The Use same sequence of random numbers option helps to compare results for
different models having the same stochastic assumptions. By using the same sequence
Selecting Run Preferences
101
of random numbers in two models, any differences in performance are due to
differences in the models rather than sampling error.
If you do not specify an initial seed value, Crystal Ball will determine a seed
from the number of milliseconds that have elapsed since Windows began running
on your computer. This of course will be different each time you run the simulation,
so you can expect Crystal Ball to produce different forecast values on each run.
Sampling Method
Appendix B also provides some technical details and references on the differences
between Monte Carlo sampling (MCS) and Latin Hypercube sampling (LHS). As
the statistical theory behind MCS is well known, it should be used for applications
where your intended audience is most critical, such as in academic research. LHS is
a form of stratified sampling where all portions of the tails of a distribution are sure
to be sampled. The statistical properties of LHS samples are the subject of current
academic research, and no widely accepted methods of assessing precision with LHS
are available yet. Nevertheless, LHS is probably the best choice for most practical
applications. LHS uses slightly more computer memory than MCS, but this should
not pose a problem for most users.
SPEED
Figure 6.6 shows the dialog containing options that let you control how quickly
your simulation model executes. Once it is built and debugged, you will ordinarily
want it to run as fast as possible. However, there are sometimes reasons for not
doing so, such as when you are demonstrating the model to a potential user of its
results.
Run Mode
I suggest that you use Extreme Speed (ES) mode whenever you can, but you must
realize that it imposes a few constraints on how you build your model because it uses
vectorization to speed up the calculations. Essentially, this means that ES mode will
perform hundreds of simulation trials at a time in RAM (random access memory),
while normal speed performs them one at a time. Most of Excel’s 320 functions
are supported, but a few are not. The most commonly used unsupported function
is the string function. One common way for strings to be used is when an Excel IF
command puts ‘‘Yes’’ or ‘‘No’’ in a cell that is referenced by another formula. ES
mode will not work with the strings ‘‘Yes’’ or ‘‘No,’’ but works fine if you replace
these with 1 and 0, or the Excel Boolean values TRUE and FALSE. Consult the
Crystal Ball User Manual Appendix C for a complete list of unsupported functions
and the Crystal Ball Web site for updates on this feature.
102 FINANCIAL MODELING WITH CRYSTAL BALL AND EXCEL
FIGURE 6.6 Run Preferences Speed tab.
Here are some tips for getting the most out of Extreme Speed:
■
Make sure that your computer has lots of RAM.
■
Build your models so that the UsedRange (upper left rectangle of non-empty
cells) is minimized.
■
Use Latin Hypercube sampling.
■
Avoid references to other worksheets that are not required for your model.
■
Avoid using large ranges in function arguments (for example, in the LOOKUP
function).
Normal speed should be checked when you use a function not supported by ES
mode. Demo speed is useful for demonstrating to others how your model works and
animating Excel graphs.
Chart Windows
These two radio buttons let you specify the rate at which Crystal Ball redraws the
chart windows. Because this takes time away from doing the calculations during
a simulation, suppress the chart windows to get the simulation completed most
quickly. This may be most useful when using OptQuest.
Selecting Run Preferences
103
OPTIONS
Figure 6.7 shows the Run options, which are mostly self-explanatory. When
you are building and refining your model, you should always enable
Store assumption values for sensitivity analysis, and do sensitivity analyses to help
refinement. Once you are satisfied with your model, you can disable storage to help
Crystal Ball run the model faster.
It turns out that having highly correlated assumptions can sometimes interfere
with sensitivity analysis. For example, assume that you have a model for which
the Forecast cell is highly sensitive to Assumption A, but not impacted at all by
Assumption B. However, if Assumptions A and B are defined with a high (positive
or negative) correlation, the sensitivity analysis could indicate that the forecast is
sensitive to both Assumptions A and B just because B tends to follow A. Therefore,
when using sensitivity analysis with correlated assumptions, you will want to disable
the correlations when you are doing sensitivity analysis. Just remember to turn it
back on when you run the model for decision making.
The Run user-defined macros option is useful for power users of Crystal Ball
and Excel, but for most financial models Excel has built in all the functions that
you will need. However, if you are facile with Visual Basic for Applications (VBA)
FIGURE 6.7 Run Preferences Options tab.
104 FINANCIAL MODELING WITH CRYSTAL BALL AND EXCEL
and wish to do things Excel doesn’t already do, or you wish to do extra processing
during each trial of the simulation, see the Crystal Ball User Manual for how to use
macros with a Crystal Ball simulation model.
Enabling Warn if insufficient memory will cause Crystal Ball to issue a warning
dialog if you don’t have enough memory in your computer to run the simulation.
The dialog lists several things you can do to help, but the best course of action is to
put more RAM in your computer if you see this warning often.
STATISTICS
Figure 6.8 shows the options to change how percentiles are calculated and formatted.
Punch the radio buttons to match your taste and that of the decision maker who
will use your model’s output. The Calculate capability metrics check box is used
primarily for Six Sigma applications, so is not discussed further here.
FIGURE 6.8 Run Preferences Statistics tab.