Effect of Na2SO4 additive in positive electrodes on the performance of sealed lead-acid cells for electric scooter applications ppt
Bạn đang xem bản rút gọn của tài liệu. Xem và tải ngay bản đầy đủ của tài liệu tại đây (1.51 MB, 10 trang )
Ž.
Journal of Power Sources 90 2000 125–134
www.elsevier.comrlocaterjpowsour
Effect of Na SO additive in positive electrodes on the performance of
24
sealed lead-acid cells for electric scooter applications
Jenn-Shing Chen
)
Department of Chemical Engineering, I-Shou UniÕersity, Ha-Hsu Hsiang, Kaohsiung 84008, Taiwan
Received 25 May 1999; accepted 17 June 1999
Abstract
This study investigated the effects of Na SO additive in the positive electrode on the performance of sealed lead-acid cells. The
24
additive Na SO in the cured plates can reduce the 4BS crystal size, which produces a smaller a-PbO and b-PbO crystal size in the
24 22
formed plates, which will have a larger surface area. The plate’s chemical composition is independent of the amount of Na SO additive
24
in the positive electrodes. Plate composition relies only on the cure temperature conditions. Increasing amounts of Na SO additive to the
24
positive electrode will not decrease the crystal size appreciably. The optimal amount of Na SO additive is 0.01–0.05 M, which produces
24
the smallest crystal size and largest specific surface area. Cells with Na SO additive in the positive plates have a smaller surface area,
24
causing a higher initial capacity and average capacity per cycle for both testing methods: the standard cycle testing and the electric
Ž.
scooter ES driving pattern cycle testing. The initial capacity and average capacity can be increased up to 4% in the standard cycle
testing and up to 8% in the ES driving pattern cycle testing. q 2000 Elsevier Science S.A. All rights reserved.
Keywords: Sealed lead-acid cell; Electric scooters; Positive plates; Additives; Curing temperature
1. Introduction
Ž.
Electric scooters ESs have recently come into com-
mercial use. However, the lower traveling range and higher
initial cost give ESs lower performance than internal com-
Ž.
bustion IC scooters which are not attractive to con-
sumers. Increasing the storage capacity and power output
of ES batteries will increase an ES’s range. Generally, the
higher the energy density, the lower battery the application
costs. The battery cost is critical to the total ES cost. The
battery cost is 30–35% of the entire ES price. Therefore,
the battery selected for ES applications is critical toward
improving ES performance. Two types of batteries are
quite attractive and feasible for ES applications in the
commercial battery market: the valve-regulated lead-acid
Ž. Ž .
VRLA battery PbrPbO and the nickelrmetal-hydrate
2
Ž.
battery NirMH . Although the NirMH performance is
better than that of PbrPbO , NirMH is economically
2
unattractive for ES commercialization. The cost of a
NirMH battery alone rivals the cost of the entire IC
motorcycle. For this reason, VRLA batteries are used in
commercial ES. The general advantages of VRLA batteries
)
Tel.: q886-7-656-3711; fax: q886-7-656-3734
are low cost, free maintenance, high reliability, high dis-
charge rate capability, and low self-discharge rate. How-
ever, the principal disadvantages, low energy density and
short cycle life, have limited the use of this battery to ES
applications. Increasing the energy density and improving
the cycle life are key technology improvements for VRLA
batteries in ES applications.
wx
In our earlier paper 1 , we investigated how the curing
temperature affects the composition and material structure
of the positive plate in ES lead-acid cells. According to the
experimental results, the major morphology in positive
Ž.
active-material crystals is tribasic lead sulfate s3BS at
Ž.
low temperatures and tetrabasic lead sulfate s4BS at
Ž.
high curing temperatures ) 658C . The 4BS and a-PbO
2
crystals are larger than the 3BS and b-PbO crystals;
2
hence, the pore surface area is small. After plate formation,
4BS favors the formation of a-PbO , and 3BS yields
2
b-PbO phase. The formation of 3BS-rich plates appar-
2
ently leads to a higher b-PbO content than 4BS-rich
2
plates. The results show that higher temperature cured
plates have less initial capacity but longer cycle life, as
revealed by the ES driving pattern cycle testing. Also,
wx
many papers 2–5 have shown that higher cure tempera-
ture forms 4BS-rich positive plate materials, which have
0378-7753r00r$ - see front matter q 2000 Elsevier Science S.A. All rights reserved.
Ž.
PII: S0378-7753 99 00308-0
()
J S. ChenrJournal of Power Sources 90 2000 125–134126
stronger mechanical strength and enhance the cycle life for
deep-discharge applications in sealed lead-acid batteries.
This study is a continuation of our previous studies to
develop a high-performance VRLA cell particularly for
increasing the specific energy and cycle life for ES appli-
cations. Higher temperature cured positive plates were
used in this work in order to enhance the VRLA battery
service life for ES applications. Additives to the positive
electrode were used to increase the capacity. In the VRLA
cells, the utilization of active materials remained very low
Ž.
about 30% at the 1 C rate for the positive plate, while
strenuous efforts were made to increase additives to the
wx
plate active materials 6 . Many materials have been pro-
wx
posed as additives for the positive active mass 7–10 . The
additive Na SO in positive electrode material can reduce
24
wx
the 4BS size of electrode materials 10 , leading to a large
capacity. In this work, we studied the effect of Na SO
24
additive in the positive electrode on the performance of
VRLA cells for ES applications.
2. Experimental procedures
2.1. Cell construction
Each cell contained two positive plates and three nega-
tive plates. The positive paste was prepared by mixing
leady oxide with water, sulfuric acid, fiber and Na SO
24
additive. The paste compositions were 50 kg ball-mill
leady oxide, 6000 cm
3
water, 3500 cm
3
sulfuric acid of
1.40 specific gravity, 50 g short fiber and in the presence
of varying amounts of Na SO from 0.01 to 2 M, accord-
24
ing to the volume of sulfuric acid. Mixing was continued
for 35 min and the paste’s apparent density was about 4.1
gcm
y3
. Next, the paste was applied to grids cast from a
PbrCa alloy. The grid dimensions were 69 mm= 40
mm= 3.6 mm. The positive plates were controlled with
around 33 g paste on both sides of each grid and then
cured. Curing was performed for 1 day at 858Cata
relative humidity ) 90%. Prior to electroformation, the
plates were dried in the air for 3–5 days until the moisture
in the paste was - 1 wt.%. The current density was
controlled at 6 mA cm
y2
and the formation capacity had a
theoretical capacity of about 200% under the formation.
After formation, the plates were washed in running water
for several hours and then dried in an oven at 658C for 24
Ž.
h. All negative plates and absorptive glass-mat AGM
separators applied in this work were furnished by The
Ž.
Ztong Yee Battery Taiwan . Each cell was filled with 38
cm
3
of electrolyte and then sealed with a cover. In all
experiments, the electrolyte was a sulfuric acid solution
Ž.
having a specific gravity of 1.335 208C . The cell’s rated
capacity was 4 A h.
Ž. Ž.
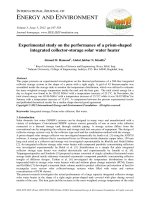
Fig. 1. a Velocity vs. time schedule for CNS-D3029 profile. b Battery power required by Improved Sanyang Dio Electric Scooter to negotiate the
Ž.
velocity schedule in a .
()
J S. ChenrJournal of Power Sources 90 2000 125–134 127
2.2. Cell cycling tests
The cells were cycled under computer-controlled charge
and discharge regimens using the Arbin Battery Testing
System. To render the cell active, all cells were charged at
0.23 A for 13 h before regular cycle testing. Two test
methods were employed: the standard cycle testing and the
ES driving pattern cycle testing. Standard cycle testing
used 0.8 A discharge current to 1.75 V cell cut-off voltage
and a 0.4 A charge current to 120% of the previous
discharge capacity. In addition, an open circuit period of
30 min was implemented at the end of each half-cycle.
Cycling continued until cell capacities have dropped and
remained below 80% of the initial capacity. The ES driv-
ing pattern in Fig. 1b entailed the use of the Chinese
Ž.
National Standard-D3029 CNS-D3029 driving schedule
in Fig. 1a as negotiated by an Improved Sanyang Dio ES
wx
y1
1 . This schedule’s average velocity was 22.5 km h ,
with the scooter traveling ; 0.7 km during one cycle of
the schedule. The ES driving pattern cycle test was com-
posed of 112 s in length, six steps and four power levels.
In the ES driving cycle testing, cells were cycled under the
following procedure: a constant power discharge according
to each power step on the schedule was repeated until the
cell voltage fell below 1.75 V cell cut-off voltage and a 0.4
A charge current to 130% of the previous discharge capac-
ity. Finally, an open circuit period of 30 min was imple-
mented at the end of each half-cycle.
2.3. Analysis of positiÕe plate material
The positive material’s physicochemical properties, in-
cluding the phase composition, morphology and specific
Ž.
area porosity , were obtained by X-ray powder diffraction
Ž. Ž.
XRD , scanning electron microscopy SEM , and
Ž.
Brunauer–Emmet–Teller BET -N adsorption methods.
2
All analytical samples taken from the plates were treated
wx
using the following steps 2 :
Ž.
1. Wash with distilled water to remove acid ;
Ž.
2. Wash with absolute ethanol to removed water and dry
in a desiccator; and
3. After drying, a portion of each sample was gently
ground using a pestle and mortar.
3. Results and discussion
3.1. Analyses of plate composition and morphology
The behavior of the positive plates markedly influences
the deep-discharge service of VRLA batteries, especially
wx
in ES applications. In our earlier paper 1 , we investigated
how curing temperature affected the positive plate material
composition and morphology, and the performance of
VRLA cells for ES applications. The higher curing temper-
Ž.
ature ) 658C , formed 4BS-rich positive plate materials,
which have stronger mechanical strength and enhance the
Table 1
Comparison of phase compositions and BET-specific surface areas of cured and formed active material
Ž.
Sample Composition weight percent "4% BET-specific surface
2 y1
Ž.
area m g
Ž.ŽŽ
a-PbO 4BS 4PbOP PbSO HC 2PbCO P Pb OH a-PbO b-PbO PbSO
43 224
()
A group 0 M Na SO
24
After 858C curing 34.7 61.5 3.8 0.38
After formation 41.8 53.4 4.8 2.78
()
B group 0.01 M Na SO
24
After 858C curing 31.4 64.3 4.3 0.48
After formation 42.3 52.3 5.4 3.34
()
C group 0.05 M Na SO
24
After 858C curing 27.4 60.5 4.1 0.51
After formation 45.1 49.3 5.6 3.68
()
D group 0.5 M Na SO
24
After 858C curing 30.1 66.2 3.7 0.45
After formation 44.2 50.6 5.2 3.37
()
E group 1 M Na SO
24
After 858C curing 32.9 62.8 4.3 0.41
After formation 41.3 53.8 4.9 3.20
()
F group 2 M Na SO
24
After 858C curing 28.6 67.5 3.9 0.40
After formation 40.8 54.1 5.1 3.08
()
J S. ChenrJournal of Power Sources 90 2000 125–134128
cycle life for ES applications. However, 4BS crystallizes
into large prismatic needles, leading to a lower capacity
because of the smaller surface area. The additive Na SO
24
in the positive electrode material can reduce the 4BS
crystal size, which has a larger surface area and increase
the cell capacity. This work aimed to determine the effects
of the different amounts of Na SO additive on the perfor-
24
mance of the positive electrode at higher curing tempera-
Ž.
tures ) 858C . Various amounts of Na SO additive,
24
from 0.01 to 2 M Na SO , were studied. According to the
24
amount of Na SO additive, six proportion groups, A, B,
24
C, D, E and F were studied representing the Na SO
24
Ž.
concentrations at 0 blank, without additive , 0.01, 0.05,
0.5, 1, and 2 M, respectively. In order to increase the
reliability of the experimental results, a total of five cells
of each group type were fabricated and subjected to perfor-
mance tests. Table 1 presents the physicochemical and
XRD analyses of all sulfates in all group plates after
formation and curing at 858C. According to the results, the
major cured plate constituent is 4BS and a-PbO together
ŽŽ
with some HC Hydrocerussite; 2PbCO P Pb OH . Dur-
32
ing formation, the phase composition converts into a-PbO
2
and b-PbO with some PbSO . The plate’s chemical com-
24
position is independent of the amount of Na SO additive
24
wx
in the positive electrodes. Similar to our former results 1 ,
the plate’s chemical composition relies heavily only on the
temperature conditions. Table 1 also shows that group A
without any Na SO additive has a smaller specific sur-
24
face area. This result indicates that the additive Na SO in
24
the cured plates can reduce the 4BS crystal size and
produce a smaller surface area. The groups B and C
contained 0.01–0.05 M Na SO additive, producing a
24
larger specific surface area. Similar to the results with the
cured plates, the positive electrodes with Na SO additive
24
exhibited a larger surface area after plate formation. The
smaller 4BS crystal size in the cured plates caused a
smaller a-PbO and b-PbO crystal size in the formed
22
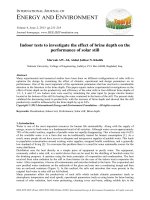
plates. Fig. 2 shows the XRD patterns for the samples
Ž. Ž .
Fig. 2. XRD patterns for samples from group B cells. I Cured plates. II Formed plates.
()
J S. ChenrJournal of Power Sources 90 2000 125–134 129
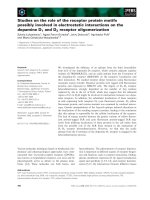
Fig. 3. Scanning electron micrographs of cured crystals in groups A to F cells with different amounts of Na SO additive.
24
()
J S. ChenrJournal of Power Sources 90 2000 125–134130
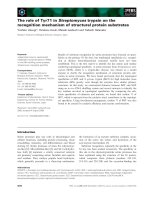
Fig. 4. Scanning electron micrographs of formed crystals in groups A to F cells with different amounts of Na SO additive.
24
()
J S. ChenrJournal of Power Sources 90 2000 125–134 131
Table 2
Cycle-life performance data for representative groups of 4.0 A h VRLA
cells
Sample Cycle Initial Capacity lossr Average
Ž.
number capacity cycle % capacityr
Ž. Ž.
A h cycle A h
Ž.
A 0 M Na SO 193 3.92 0.111 3.71
24
Ž.
B 0.01 M Na SO 210 4.05 0.107 3.87
24
Ž.
C 0.05 M Na SO 196 4.08 0.114 3.86
24
Ž.
D 0.5 M Na SO 208 4.01 0.104 3.83
24
Ž.
E 1 M Na SO 183 3.97 0.122 3.75
24
Ž.
F 2 M Na SO 198 3.94 0.114 3.69
24
from group B in cured and formed plates, respectively.
The results demonstrate that the major constituent is 4BS
and a-PbO together with some HC in the cured plate and
a-PbO and b-PbO with some PbSO in the formed
22 4
plate. Fig. 3 presents scanning electron micrographs of
cured crystals in the groups A–F samples at different
amounts of Na SO additive. The cured paste consists of
24
larger 4BS crystals together with smaller a-PbO crystals.
The 4BS crystals have an elongated prismatic form and
each grain consists of many sub-grains. The crystal size
distributes from 1 to 20 mm. The 4BS crystals exhibit a
smaller size in the cured plate with Na SO additives.
24
However, increasing amounts of Na SO additive to the
24
positive electrode do not continue to decrease the crystal
size. The results show that groups B and C exhibit the
smallest crystal size. Fig. 4 shows scanning electron mi-
crographs of formed crystals in the A–F group samples at
different amounts of Na SO additive. Similar to the
24
results with the BET-specific surface area analysis, the
smaller 4BS crystal size decreases in the formed plates.
Generally, the 4BS crystal was produced using two steps.
Ž.
In the first mixing step, 3BS 3PbOP PbSO P HO is
42
formed in the mixing of the leady oxide with H O and
2
H SO solution. 4BS crystal is formed at a higher temper-
24
ature and a relative humidity from 3BS and a-PbO during
wx
the second curing step 2,4,11,12 . The smaller 4BS crystal
size produced can be attributed to adding Na SO addi-
24
tive, which increases the amount of SO
y2
ions and results
4
in a larger amount of initial nucleus formed in the first
mixing step. The larger amount of nucleus reduces the 4BS
crystal size during the 4BS crystal growth in the second
curing step.
3.2. Cell standard cycle-life performance
This work also attempted to determine the effects of
different amounts of Na SO additive on cells’ perfor-
24
mance. Six groups of cells with various amounts of Na SO
24
additive were subjected to two test methods: the standard
cycle test and the ES driving pattern cycle test. In this
study, five cells in each group were tested with the average
performance based on the results exhibited by five cells.
Six groups of cells were subjected to standard cycle-life
Ž
testing: group A cells without Na SO additive, as a
24
.
control test for comparison purposes and groups B–F
Fig. 5. Capacity vs. cycle number for groups A to F cells.
()
J S. ChenrJournal of Power Sources 90 2000 125–134132
Fig. 6. Cell voltage at different cycles for cells A, B, E and F. Potential vs. time curves are identified for first cycle and 180th cycle. The curves for
Ž.
intermediate cycles nos. 80, 120 are shown, but not identified.
Ž.
cells with various amounts of Na SO additive listed in
24
Table 2. Group A cells were used as the control for cell
testing in all of the cell groups. The cell capacity data
shown in Table 2 are based on initial cell capacity. The
table includes the values of the capacity loss rate and the
average delivered capacity per cycle, both based on the
cell performance before its capacity dropped to 80% of the
initial capacity. The capacity loss rate, expressed as per-
centage per cycle, is based on the initial cell capacity and
can be estimated using:
Ys 1y C
1r n
= 100,
Ž.
q
where n denotes the total cycle number, C represents the
q
Ž
terminal fractional capacity based on the initial cell capac-
.
ity , and Y is the average fractional capacity loss for each
cycle. According to Table 2, the cycle life of all cells had
about 200 cycles for all standard cycles. The similar cycle
life in all groups of cells can be attributed to the same
curing temperature at 858C for the positive electrodes.
However, cells with Na SO additive in the positive elec-
24
trode exhibited a higher average capacity per cycle than
the standard cells without Na SO additive. The initial
24
capacity and average capacity could be increased up to
4%. The difference in cell capacity can be attributed to the
specific surface area of the crystals in the positive elec-
trode. The positive electrodes with Na SO additive exhib-
24
ited a smaller 4BS crystal with a larger specific surface
area and higher initial capacity and average capacity per
cycle. This result also demonstrated that increasing the
amount of Na SO additive in the positive electrode will
24
not substantially increase the initial capacity. Groups B
and C with 0.01–0.05 M Na SO additive had a higher
24
initial capacity and average capacity per cycle. All of the
cells had a capacity loss per cycle of about 0.11%. Fig. 5
shows a plot of capacity vs. cycle number for all cell
groups. The capacity of all cells reached their maximum
Ž.
values ; 105% after roughly 15 cycles, remaining above
Ž.
80% up to 200 cycles at 100% depth-of-discharge DOD .
Adding the Na SO additive to the positive electrode
24
produced a higher capacity, but the cycle life was the
similar. Fig. 6 depicts the cell voltage at various cycles for
group cells A, B, and C. As the data reveal, all cells
exhibited the expected charge and discharge curves shape.
3.3. Cell ES driÕing pattern cycle-life performance
Six group cells were subjected to the ES driving pattern
cycle testing to assess the effect of various amounts of
Na SO additive in the positive electrode listed as in Table
24
3. The cell capacity data shown in Table 3 are based on the
cell initial capacity. Table 3 confirms that cells with
Table 3
Cycle-life performance data for representative groups of 4.0 A h VRLA
cells under the ES driving pattern
Sample Cycle Initial Capacity lossr Average
Ž.
number capacity cycle % capacityr
Ž. Ž.
A h cycle A h
Ž.
A 0 M Na SO 95 3.25 0.235 2.93
24
Ž.
B 0.01 M Na SO 98 3.45 0.229 3.19
24
Ž.
C 0.05 M Na SO 96 3.47 0.233 3.20
24
Ž.
D 0.5 M Na SO 99 3.38 0.223 3.15
24
Ž.
E 1 M Na SO 96 3.29 0.232 3.03
24
Ž.
F 2 M Na SO 94 3.30 0.237 3.02
24
()
J S. ChenrJournal of Power Sources 90 2000 125–134 133
Fig. 7. Capacity vs. cycle number for groups A to F cells under ES driving pattern.
Fig. 8. Cell, voltage and discharge current vs. time during first cycle for cells A, B, E and F under ES driving pattern.
()
J S. ChenrJournal of Power Sources 90 2000 125–134134
Na SO additive in the positive plates have a higher initial
24
capacity and average capacity per cycle. Groups B and C
with 0.01–0.05 M Na SO additive had a higher initial
24
capacity and average capacity per cycle. Similar results
can be found in Table 2. However, the initial capacity and
average capacity could be increased up to 8% in the ES
driving pattern cycle testing. The capacity loss per cycle,
about 0.23% in the ES driving pattern cycle testing, was
greater than that in the standard cycle testing. Fig. 7
presents capacity vs. cycle number for all group cells A–F
under ES driving pattern in Fig. 1b. Similar to Fig. 5, the
Ž
capacity of all cells reached their maximum values ;
.
104% after about five cycles, and remained above 80%
for up to 95 cycles. Various amounts of added Na SO
24
produced similar cycle life, but yielded a higher initial
capacity and average capacity per cycle. Fig. 8 depicts the
cell voltage and discharge current vs. time during the first
Ž
cycle for A, B, and C group cells. In the peak load 60 W
y1
.
kg period, the discharge current reached the highest
value while the cell voltage fell to its lowest one. More-
over, with each successive sub-cycle, the average voltage
followed a downward trend and the discharge current
increased. All of the cells completed about 32 sub-cycles
before the terminal voltage fell to the cut-off value. The
most useful energy density per cell was calculated to be
around 25 W h kg
y1
and the range was about 23 km.
4. Conclusions
The performance of a sealed lead-acid battery is deter-
mined by the behavior of the positive electrode. During
positive electrode production, a curing process operated at
high temperature and humidity will result in 4BS active
material that crystallizes as large prismatic needles. Elec-
trodes made with a large amount of 4BS will have less
initial capacity because of the lower surface area, but have
a longer cycle life. This study investigated the effects of
Na SO additive in the positive electrode on the perfor-
24
mance of VRLA cells. Based on the results presented
herein, we can conclude the following.
Ž.
1 The XRD analyses showed that the major con-
stituent of the additive Na SO in the cured plates is 4BS
24
and a-PbO together with some HC and a-PbO and
2
b-PbO with some PbSO in the formed plates. The
24
plate’s chemical composition is independent of the amount
of Na SO additive in the positive electrodes. Plate com-
24
position relies heavily on the cure temperature conditions.
Ž.
2 The additive Na SO in the cured plates can reduce
24
the 4BS crystal size, which produces a smaller a-PbO
2
and b-PbO crystal size in the formed plates and has a
2
larger surface area. Increasing the amount of Na SO
24
additive to the positive electrode will not decrease the
crystal size appreciably. The Na SO additive containing
24
0.01–0.05 M produces the smallest crystal size and largest
specific surface area.
Ž.
3 The positive electrodes with Na SO additive have
24
smaller 4BS crystals, which have a larger specific surface
area and cause higher initial capacity and average capacity
per cycle for both testing methods: the standard cycle
testing and the ES driving pattern cycle testing. The initial
and average capacities can be increased up to 4% in the
standard cycle testing and up to 8% in the ES driving
pattern cycle testing.
Ž.
4 Higher curing temperature for positive plate materi-
als enhances the cycle life for deep-discharge applications
in sealed lead-acid batteries. Na SO additive in positive
24
plates can increase the cell’s capacity while producing a
longer cycle life at high cure temperatures. Next, our
future research will continue to focus on how to increase
positive plate utilization at higher cure temperatures.
Acknowledgements
This author would like to thank the ROC National
Science Council for financially supporting this work under
contract no. NSC-86-2214-E-214-002. Ztong Yee Battery
Ž.
and Success Battery in Taiwan provided several elec-
trodes and cell parts. The author thanks Ztong Yee Battery
and Success Battery for proving these useful materials.
References
wx Ž.
1 J S. Chen, L.F. Wang, J. Power Sources 70 1998 269–275.
wx Ž.
2 D.A.J. Rand, R.J. Hill, M. McDonagh, J. Power Sources 31 1990
203–215.
wx Ž.
3 J.K. Vilhunen, S. Hornytzkyj, J. Power Sources 39 1992 59–65.
wx Ž.
4 V. Iliev, D. Pavlov, J. Appl. Electrochem. 9 1979 555–562.
wx Ž.
5 B. Culpin, J. Power Sources 25 1989 305–311.
wx Ž.
6 D.A.J. Rand, J. Power Sources 64 1997 157–174.
wx Ž.
7 S.V. Baker, P.T. Moseley, A.D. Turner, J. Power Sources 27 1989
127–143.
wx
8 K.R. Bullock, B.K. Mahato, W.J. Wruck, J. Electrochem. Soc. 138
Ž.
1991 3545.
wx Ž.
9 T. Rogachev, D. Pavlov, J. Power Sources 64 1997 51–56.
wx
10 B. Vyas, R.E. Landwehrel, M.N. Thomas, Proceeding of the sympo-
sium on advanced in batteries, Proc. Electrochem. Soc., 94-2, p.
258.
wx Ž.
11 L. Zerroual, N. Chelali, F. Tedjar, J. Power Sources 51 1994
425–431.
wx
12 G.L. Corino, R.J. Hill, A.M. Jessel, D.A.J. Rand, J.A. Wunderlich,
Ž.
J. Power Sources 16 1985 141–168.